
UNIFORM AND NONUNIFORM PROBABILITY MODELS BELLWORK Use the
UNIFORM AND NON-UNIFORM PROBABILITY MODELS
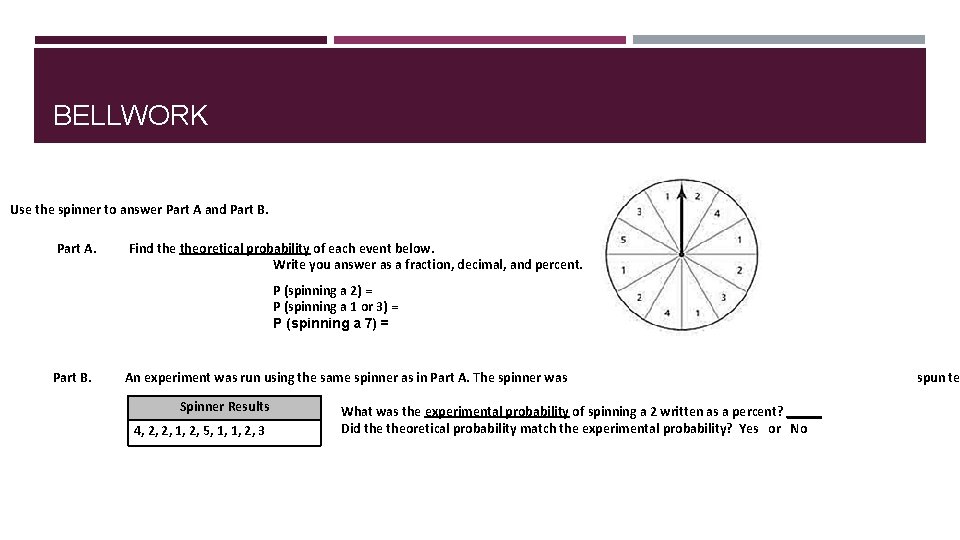
BELLWORK Use the spinner to answer Part A and Part B. Part A. Find theoretical probability of each event below. Write you answer as a fraction, decimal, and percent. P (spinning a 2) = P (spinning a 1 or 3) = P (spinning a 7) = Part B. An experiment was run using the same spinner as in Part A. The spinner was Spinner Results 4, 2, 2, 1, 2, 5, 1, 1, 2, 3 What was the experimental probability of spinning a 2 written as a percent? _____ Did theoretical probability match the experimental probability? Yes or No spun te
OBJECTIVES 7. SP. 7 Develop a probability model and use it to find probabilities of events. Compare probabilities from a model to observed frequencies; if the agreement is not good, explain possible sources of the discrepancy. - A. Develop a uniform probability model by assigning equal probability to all outcomes, and use the model to determine probabilities of events. - B. Develop a probability model (which may not be uniform) by observing frequencies in data generated from a chance process.
I CAN…. develop a probability model (non-uniform) by observing frequencies in data generated from a chance process.
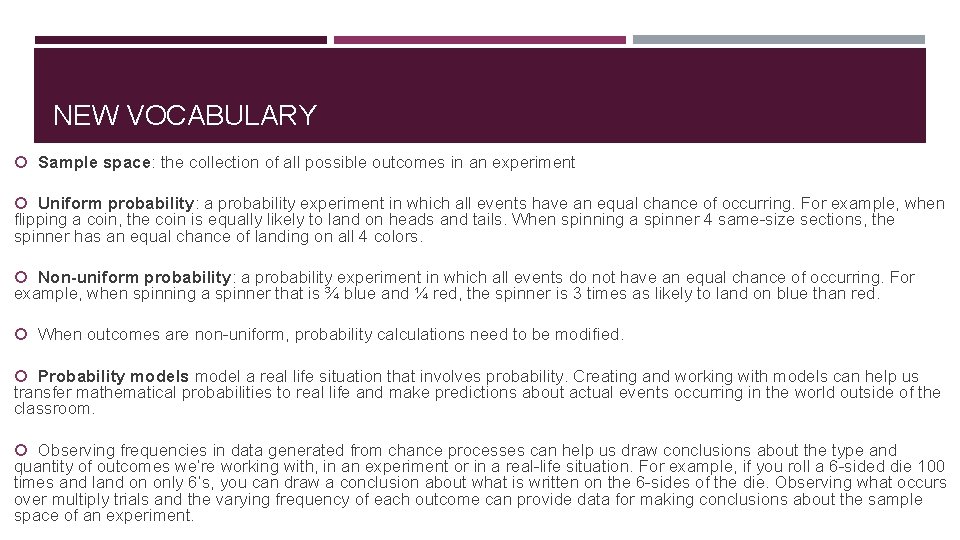
NEW VOCABULARY Sample space: the collection of all possible outcomes in an experiment Uniform probability: a probability experiment in which all events have an equal chance of occurring. For example, when flipping a coin, the coin is equally likely to land on heads and tails. When spinning a spinner 4 same-size sections, the spinner has an equal chance of landing on all 4 colors. Non-uniform probability: a probability experiment in which all events do not have an equal chance of occurring. For example, when spinning a spinner that is ¾ blue and ¼ red, the spinner is 3 times as likely to land on blue than red. When outcomes are non-uniform, probability calculations need to be modified. Probability models model a real life situation that involves probability. Creating and working with models can help us transfer mathematical probabilities to real life and make predictions about actual events occurring in the world outside of the classroom. Observing frequencies in data generated from chance processes can help us draw conclusions about the type and quantity of outcomes we’re working with, in an experiment or in a real-life situation. For example, if you roll a 6 -sided die 100 times and land on only 6’s, you can draw a conclusion about what is written on the 6 -sides of the die. Observing what occurs over multiply trials and the varying frequency of each outcome can provide data for making conclusions about the sample space of an experiment.
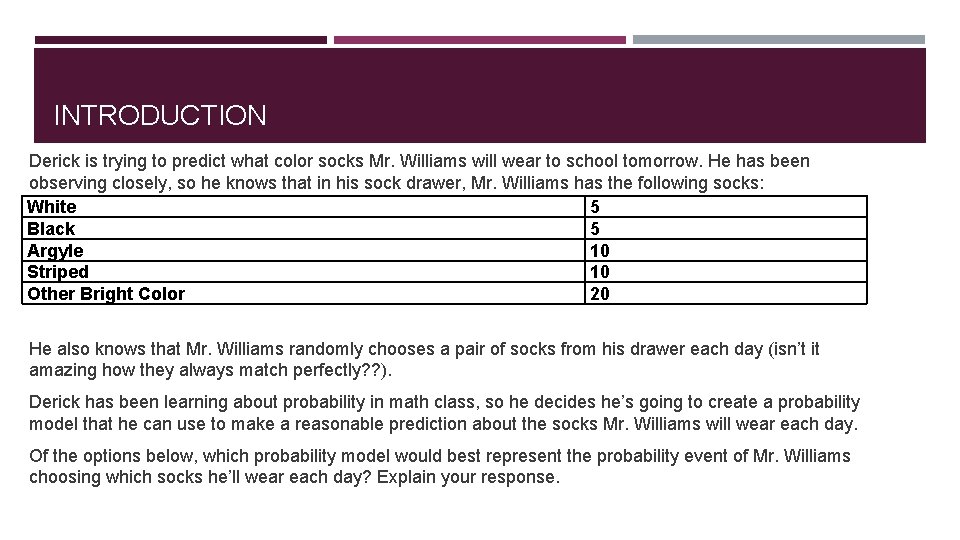
INTRODUCTION Derick is trying to predict what color socks Mr. Williams will wear to school tomorrow. He has been observing closely, so he knows that in his sock drawer, Mr. Williams has the following socks: White 5 Black 5 Argyle 10 Striped 10 Other Bright Color 20 He also knows that Mr. Williams randomly chooses a pair of socks from his drawer each day (isn’t it amazing how they always match perfectly? ? ). Derick has been learning about probability in math class, so he decides he’s going to create a probability model that he can use to make a reasonable prediction about the socks Mr. Williams will wear each day. Of the options below, which probability model would best represent the probability event of Mr. Williams choosing which socks he’ll wear each day? Explain your response.
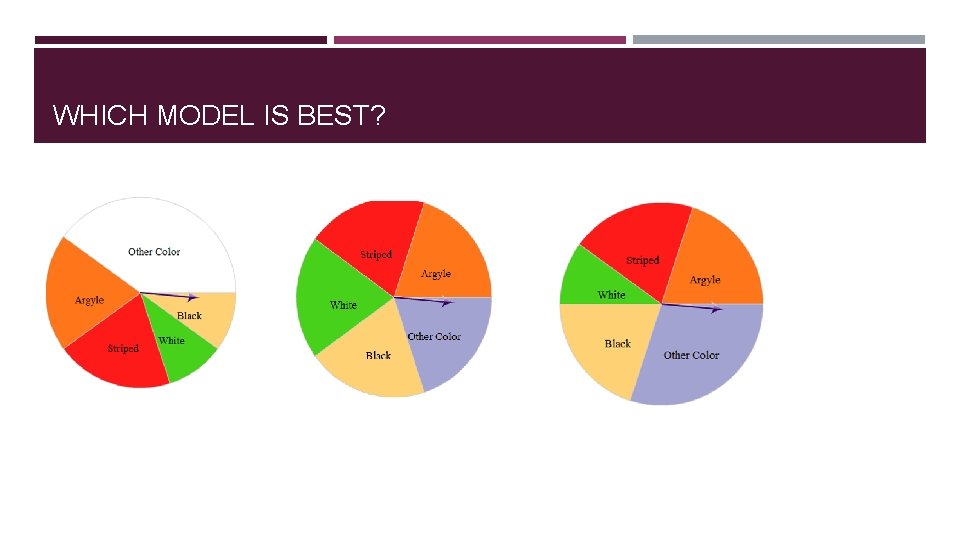
WHICH MODEL IS BEST?
UNIFORM AND NON-UNIFORM PROBABILITY MODELS In Derick’s example, we saw that the spinners we analyzed were not regular, old-fashioned spinners, where each sector was an equal size. Because there was not an equal chance of picking each type of socks, we had to create a model that fairly represented this. In life, not all outcomes are always equally likely – but non-uniform probability helps us account for that. We’ll see today that we can find the probabilities for different events occurring, even when they each have a different likelihood of occurring. You’ll also see that the ability to model non-uniform probability situations is quite useful – because most things in life are not all equally likely to occur.
REAL-WORLD EXAMPLES OF NON-UNIFORM PROBABILITY Example 1: Let’s try a real-world example together. We want to determine the probability that a plastic cup, when tossed in the air, will land upside down. Let’s try it out. What are all the different possible outcomes? In other words, what are the different ways that the cup could land? Let’s record our sample space: Ok, so we’ve done a few trials to generate our possible outcomes – our sample space – now let’s record some more trials and see what we can understand about the relative probabilities of each outcome. As I conduct 20 trials, I want you to record my results in your frequency table.
REAL-WORLD EXAMPLES OF NON-UNIFORM PROBABILITY Questions? Did we have uniform probability here? What probability model would we make to represent the relative probabilities, and the non-uniform probability? What would happen if someone else conducted this experiment? What if I chose a student who was especially skilled at flipping a cup, and he or she had the cup land upside down 75% percent of the time? Does any volunteer think that they can flip the cup 20 times, and have a probability outcome where their percentage of times landing “upside down” is greater than mine? Was the probability for each outcome the same as mine here, or different? What might explain the differences?
What conclusions can we draw about non-uniform probability? When we conduct an experiment with non-uniform probability, each outcome has an unequal chance of occurring. When the breakdown of the sample space is known, we can determine the relative probabilities of each outcome by comparing the number of ways to get each outcome. (I. e. if there are 3 times as many boys as girls, then the probability of the outcome being a boy is 3 times the probability of the outcome being a girl. ) When the breakdown of the sample space is unknown, we can conduct an experiment to determine the relative probability of each outcome occurring. The results of our experiment can help us determine the experimental probability, and then to make predictions about future outcomes based on the data we have.
REAL-WORLD EXAMPLES OF NON-UNIFORM PROBABILITY Example 2: In a seventh grade class, there are 10 girls and 30 boys. Ms. Kinsey is going to randomly select one scholar each day to write the aim on the board, and she wants to determine the probability of picking each gender each day. a) Is this a situation involving uniform or non-uniform probability? How do you know? b) Design a spinner that could be used to model this probability experiment. This spinner would have to reflect the breakdown of the outcomes. There will be two sections, because there are 2 outcomes in the sample space. Should the spinner have 2 equal sections? How should the spinner be set up? We can represent these probabilities using proper notation, and incorporating our understanding of the relationship between fractions and decimals. How could we represent the probability of choosing a girl, as a decimal? Boy? What do our two probabilities add up to? (1) Why does this make sense?
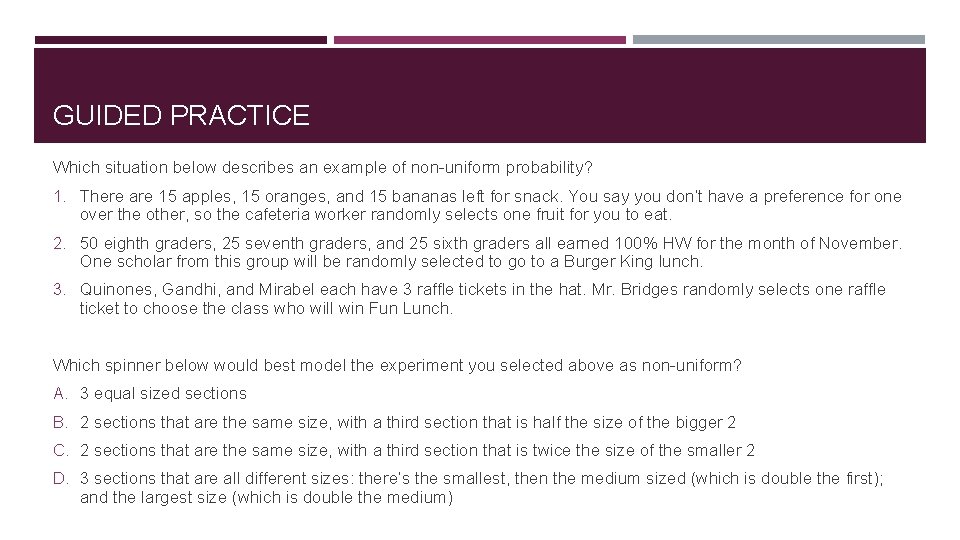
GUIDED PRACTICE Which situation below describes an example of non-uniform probability? 1. There are 15 apples, 15 oranges, and 15 bananas left for snack. You say you don’t have a preference for one over the other, so the cafeteria worker randomly selects one fruit for you to eat. 2. 50 eighth graders, 25 seventh graders, and 25 sixth graders all earned 100% HW for the month of November. One scholar from this group will be randomly selected to go to a Burger King lunch. 3. Quinones, Gandhi, and Mirabel each have 3 raffle tickets in the hat. Mr. Bridges randomly selects one raffle ticket to choose the class who will win Fun Lunch. Which spinner below would best model the experiment you selected above as non-uniform? A. 3 equal sized sections B. 2 sections that are the same size, with a third section that is half the size of the bigger 2 C. 2 sections that are the same size, with a third section that is twice the size of the smaller 2 D. 3 sections that are all different sizes: there’s the smallest, then the medium sized (which is double the first); and the largest size (which is double the medium)
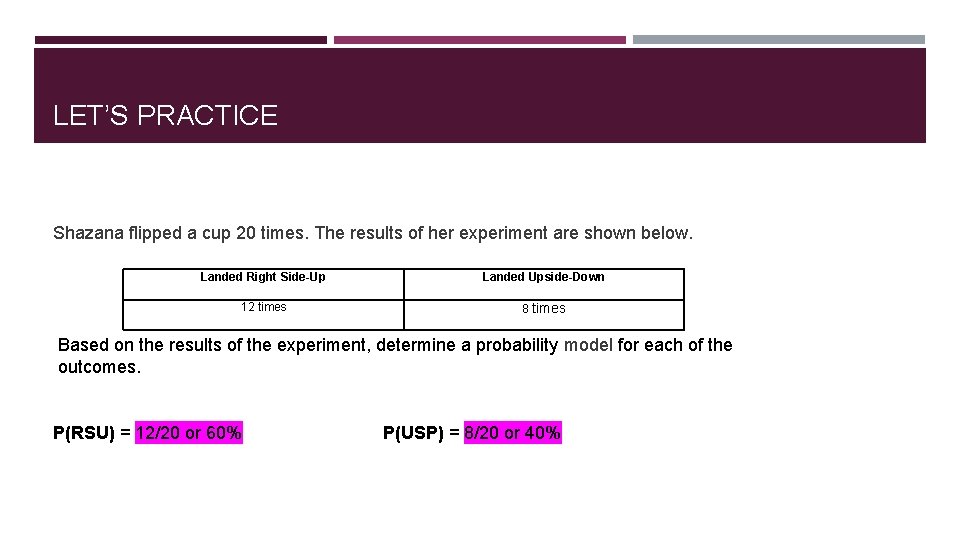
LET’S PRACTICE Shazana flipped a cup 20 times. The results of her experiment are shown below. Landed Right Side-Up Landed Upside-Down 12 times 8 times Based on the results of the experiment, determine a probability model for each of the outcomes. P(RSU) = 12/20 or 60% P(USP) = 8/20 or 40%
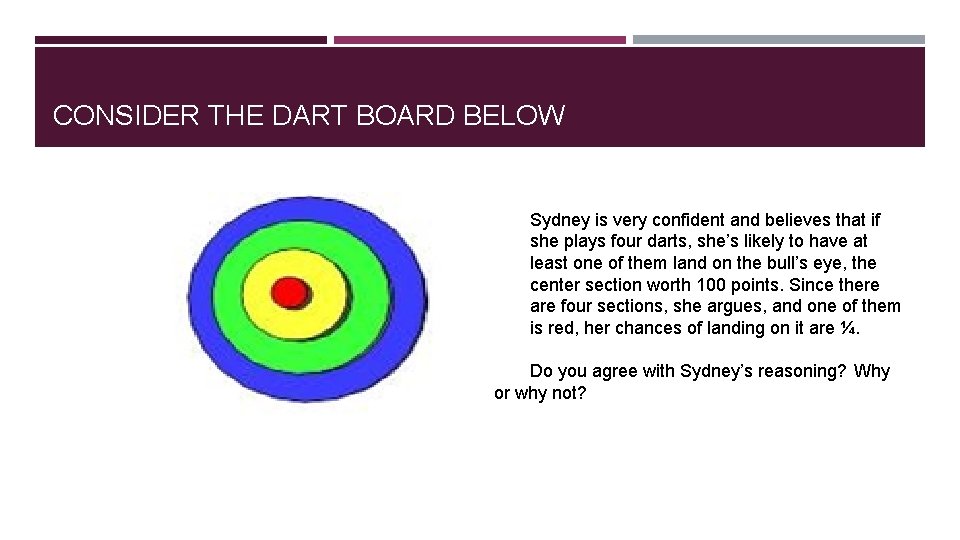
CONSIDER THE DART BOARD BELOW Sydney is very confident and believes that if she plays four darts, she’s likely to have at least one of them land on the bull’s eye, the center section worth 100 points. Since there are four sections, she argues, and one of them is red, her chances of landing on it are ¼. Do you agree with Sydney’s reasoning? Why or why not?
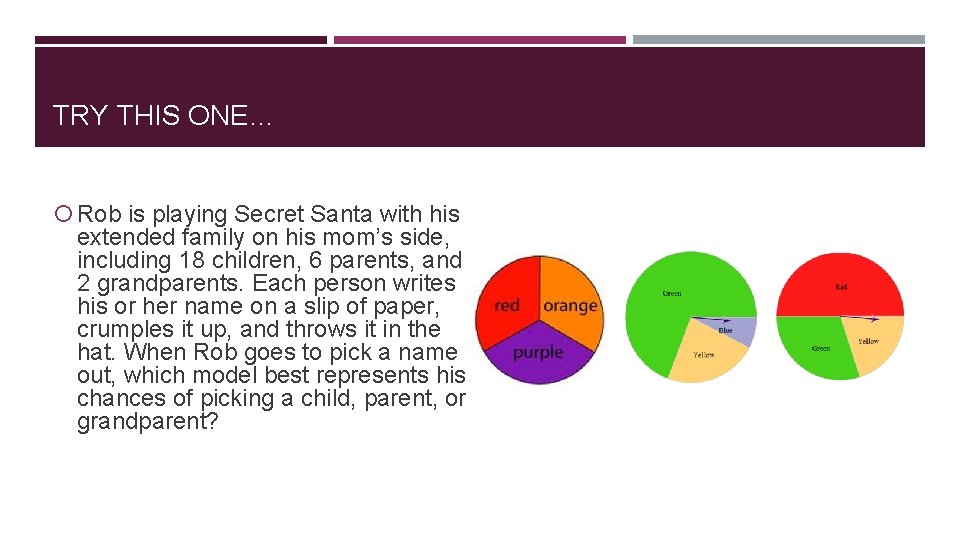
TRY THIS ONE… Rob is playing Secret Santa with his extended family on his mom’s side, including 18 children, 6 parents, and 2 grandparents. Each person writes his or her name on a slip of paper, crumples it up, and throws it in the hat. When Rob goes to pick a name out, which model best represents his chances of picking a child, parent, or grandparent?
- Slides: 16