
UNIDO Productivity Databases Amadou BOLY UNIDO First AlKhawarezmi
UNIDO Productivity Databases Amadou BOLY, UNIDO First Al-Khawarezmi conference Doha, Qatar 6 -8 December 2010 1
UNIDO Industrial Statistics Database • UNIDO collects, maintains and disseminates international industrial statistics (manufacturing) • Data for 181 countries and territories from 1963. . . but with gaps • Data on major industrial statistics, by ISIC rev 3 and rev 2: Number of units, employment, wages and salaries, output, value added, capital formation and production indices • Dissemination media: International Yearbook of Industrial Statistics CD products (INDSTAT 2 and INDSTAT 4) Online access to country briefs 2
Productivity Projects • World Productivity Database (WPD) https: //www. unido. org/data 1/wpd/Index. cfm • World Manufacturing Productivity Database (in progress) • Productivity and Structural Change 3

Why productivity? • Why are some countries richer than others? • Why are some firms more competitive than others? • Why do you earn more than …? • Productivity welfare, prosperity • A few graphs to illustrate 4
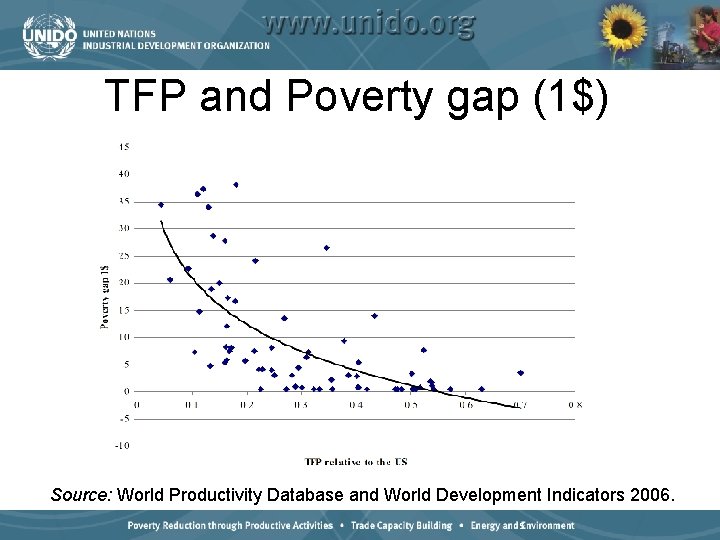
TFP and Poverty gap (1$) Source: World Productivity Database and World Development Indicators 2006. 5
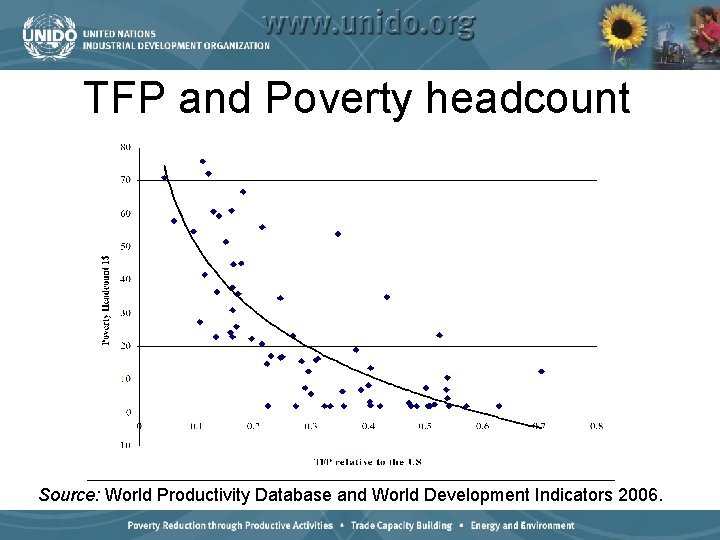
TFP and Poverty headcount Source: World Productivity Database and World Development Indicators 2006. 6
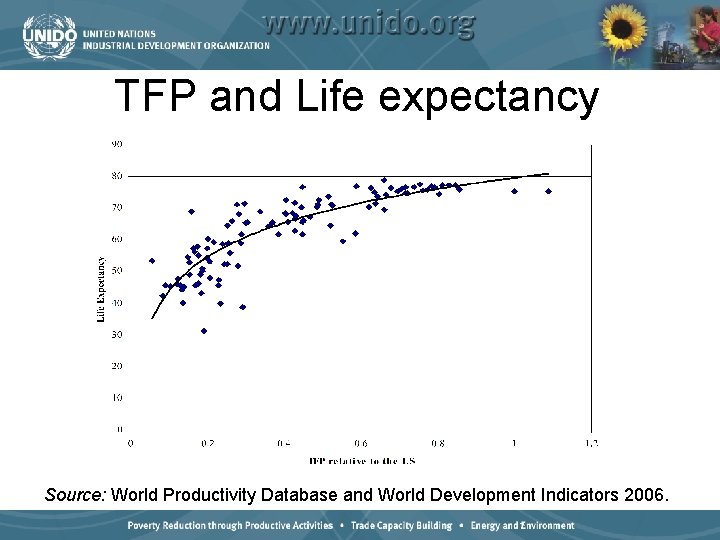
TFP and Life expectancy Source: World Productivity Database and World Development Indicators 2006. 7
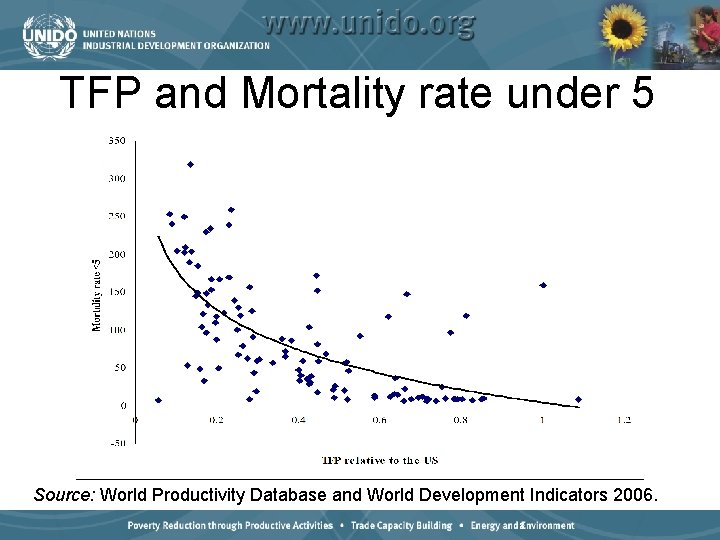
TFP and Mortality rate under 5 Source: World Productivity Database and World Development Indicators 2006. 8
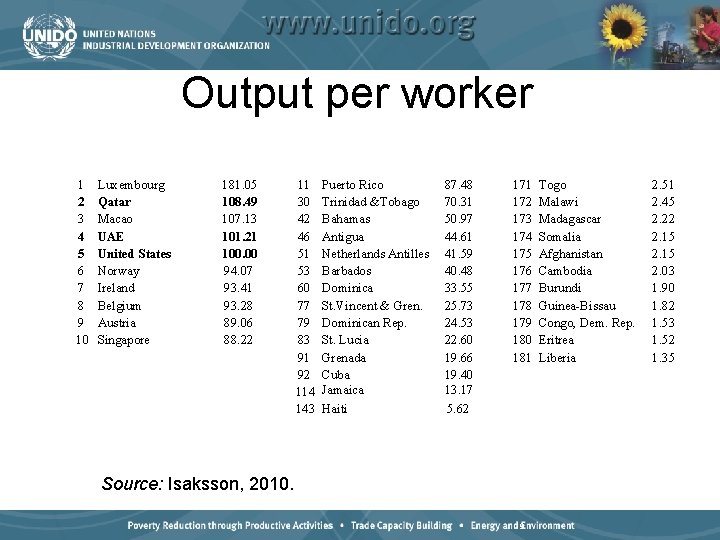
Output per worker 1 2 3 4 5 6 7 8 9 10 Luxembourg Qatar Macao UAE United States Norway Ireland Belgium Austria Singapore 181. 05 108. 49 107. 13 101. 21 100. 00 94. 07 93. 41 93. 28 89. 06 88. 22 11 30 42 46 51 53 60 77 79 83 91 92 114 143 Puerto Rico Trinidad &Tobago Bahamas Antigua Netherlands Antilles Barbados Dominica St. Vincent & Gren. Dominican Rep. St. Lucia Grenada Cuba Jamaica 87. 48 70. 31 50. 97 44. 61 41. 59 40. 48 33. 55 25. 73 24. 53 22. 60 19. 66 19. 40 13. 17 Haiti 5. 62 171 172 173 174 175 176 177 178 179 180 181 Source: Isaksson, 2010. 9 Togo Malawi Madagascar Somalia Afghanistan Cambodia Burundi Guinea-Bissau Congo, Dem. Rep. Eritrea Liberia 2. 51 2. 45 2. 22 2. 15 2. 03 1. 90 1. 82 1. 53 1. 52 1. 35
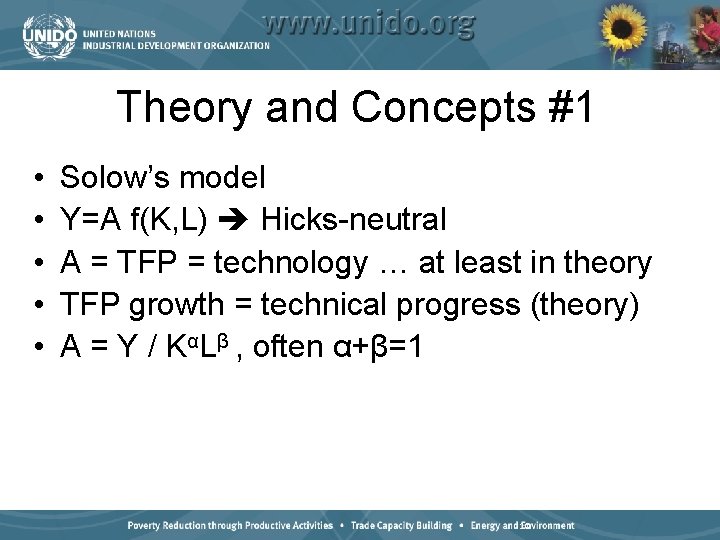
Theory and Concepts #1 • • • Solow’s model Y=A f(K, L) Hicks-neutral A = TFP = technology … at least in theory TFP growth = technical progress (theory) A = Y / KαLβ , often α+β=1 10
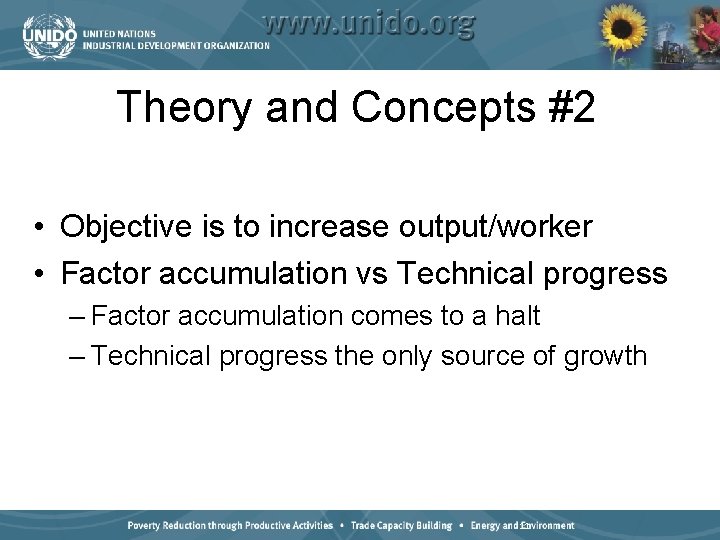
Theory and Concepts #2 • Objective is to increase output/worker • Factor accumulation vs Technical progress – Factor accumulation comes to a halt – Technical progress the only source of growth 11
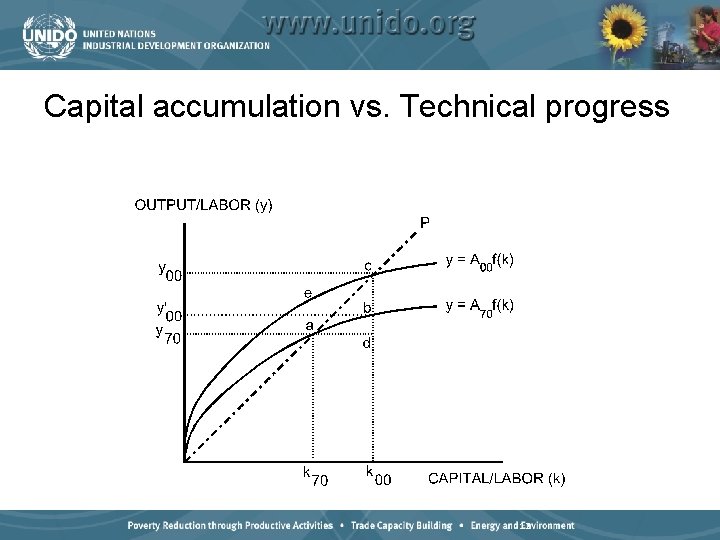
Capital accumulation vs. Technical progress 12
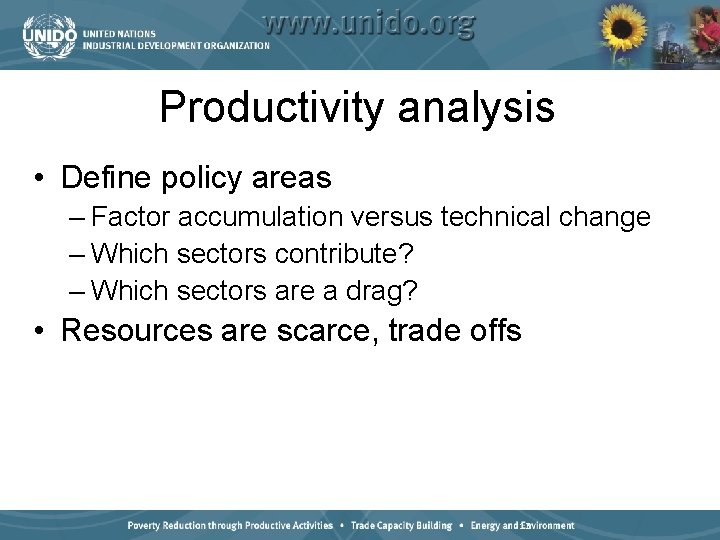
Productivity analysis • Define policy areas – Factor accumulation versus technical change – Which sectors contribute? – Which sectors are a drag? • Resources are scarce, trade offs 13
Determinants: TFP Level • • • TFPt = F(past) Acemoglu, Rodrik on Institutions International integration Glaeser et al on Human capital Health Culture and social institutions? 14
Determinants: TFP growth • • • R&D and the like Schooling and Health Infrastructure … And much more growth econometrics 15
Measurement issues • • • Measurement of Y, K, L (and other inputs) Functional form and specification Measurement of α and β, returns to scale? Quality of inputs and utilization rates Disembodied/embodied technical change 16

Conclusions • • • Productivity is key to our welfare Important to gauge productivity… but difficult Missing and shaky data Are we sure about the determinants? How can poor countries catch up? UN, NSO and academe need to cooperate 17
- Slides: 17