UNEP Live uneplive unep org agree on deployment


- Slides: 28
UNEP Live – uneplive. unep. org agree on deployment,
What is UNEP Live? • On-line knowledge management platform • Focus on open access to global, regional and national environmental data and knowledge • Supports more dynamic, interactive assessment and reporting processes • Range of analytical, mapping, search, visualization tools • SDGs/ MEAs Synergies Portal • Web intelligence portal • Communities of Practice • Principles: Open access; Data managed as close as possible to source; Data collected once and shared for many purposes
Package of UNEP services for monitoring, reporting and data sharing 1. UNEP Live knowledge management platform 2. UNEP-Live SDGs Synergies Portal 3. Indicator Reporting Information System (IRIS)
Country data and knowledge
Regional data and knowledge
Global data and knowledge
Web intelligence
Mapping
Charting Indicators
Package of UNEP services for monitoring, reporting and data sharing 1. UNEP Live knowledge management platform 2. UNEP-Live SDGs Synergies Portal 3. Indicator Reporting Information System (IRIS)
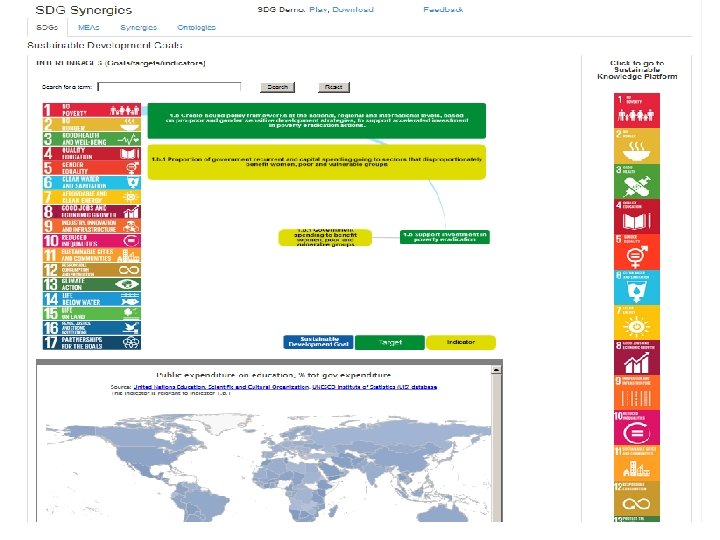
Environmental dimension of SDGs • 17 out of 17 Goals • 81 out of 241 global indicators • UNEP is custodian agency for 31 global indicators, collaborating on others • Many links between SDGs and MEAs • UNEP Live contains datasets related to 112 out of 241 indicators • Data is missing for many countries
Example: Tier 1 indicators for which UNEP is expected to be responsible for providing data flows 6. 5. 1 Degree of integrated water resources management implementation (0 -100) 12. 4. 1 Number of parties to international multilateral environmental agreements on hazardous waste, and other chemicals that meet their commitments and obligations in transmitting information as required by each relevant agreement 14. 5. 1 Coverage of protected areas in relation to marine areas 15. 1. 2 Proportion of important sites for terrestrial and freshwater biodiversity that are covered by protected areas, by ecosystem type 15. 4. 1 Coverage by protected areas of important sites for mountain biodiversity 15. a. 1 Official development assistance and public expenditure on conservation and sustainable use of biodiversity and ecosystems 15. b. 1 Official development assistance and public expenditure on conservation and sustainable use of biodiversity and ecosystems
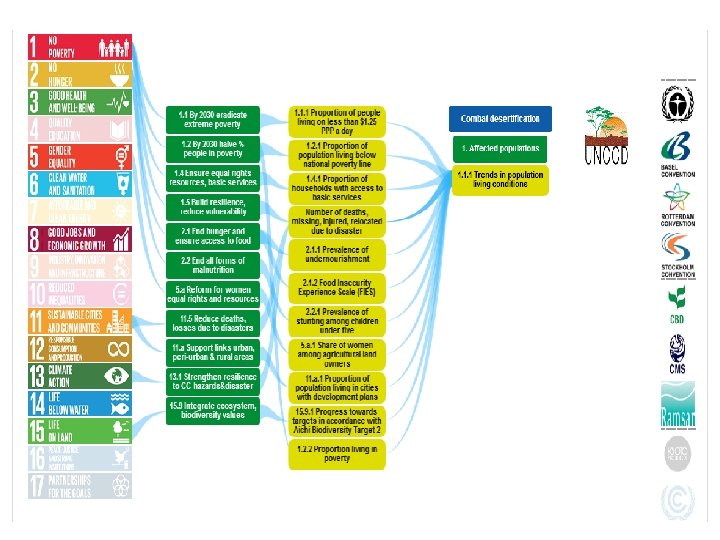
How MEAs contribute to SDGs
Package of UNEP services for monitoring, reporting and data sharing 1. UNEP Live knowledge management platform 2. UNEP-Live SDGs Synergies Portal 3. Indicator Reporting Information System (IRIS)
Integration: UNEP Live, Assessments, IRIS
Reporting Obligations
Indicator Reporting Information System • The IRIS aims to help government ministries responsible for reporting on national, regional and global obligations, to collect, analyze and publish quality assured environmental information in a timely manner • The IRIS enables evidence-based, timely decisionmaking
Indicator Reporting Information System Dashboard: provides a graphical snap-shot of key data/indicators that together highlight, in a quick, easy way, the state and trends of the environment. Datasources: users can upload data so they are available for multiple reporting needs. This is the starting point for reporting. Indicator Workbooks can be generated using formulae’s and multiple datasets and Indicator Instances (chart, map, values) saved for use in reporting Reports allow users to generate reports, using reporting templates, that bring in relevant datasets and indicators available in the IRIS. The Administration menu option is not available to all users. Administrators have the option to add new users and upload reporting templates.
Datasources Upload using an API Upload from a Database Upload from an Excel spreadsheet
IRIS – Indicator Workbooks
Indicator Instances - Charts
Indicator Instances - Maps
Narratives
Reports
Dashboard
UNEP Live – uneplive. unep. org Contact us at: uneplive@unep. org