Understanding Wheat Basis in North Dakota Frayne Olson

Understanding Wheat Basis in North Dakota Frayne Olson, Ph. D Crop Economist/Marketing Specialist frayne. olson@ndsu. edu 701 -231 -7377 (o) 701 -715 -3673 (c) NDSU Extension Service ND Agricultural Experiment Station Dept. of Agribusiness & Applied Economics STUDENT FOCUSED • LAND GRANT • RESEARCH UNIVERSITY

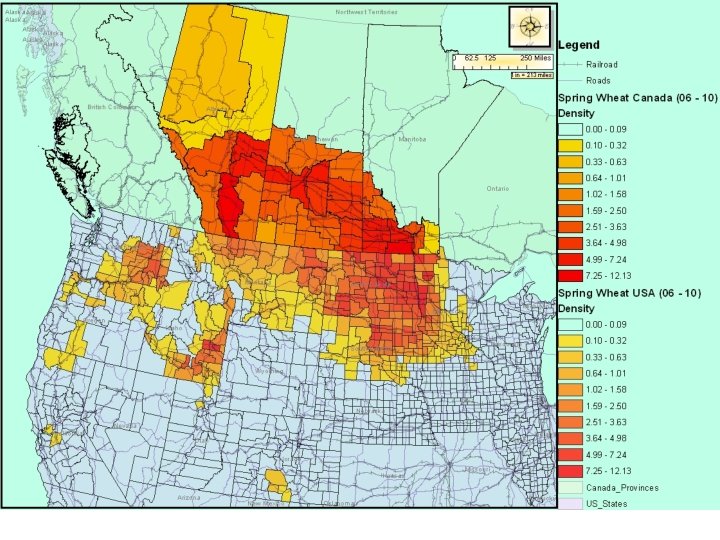
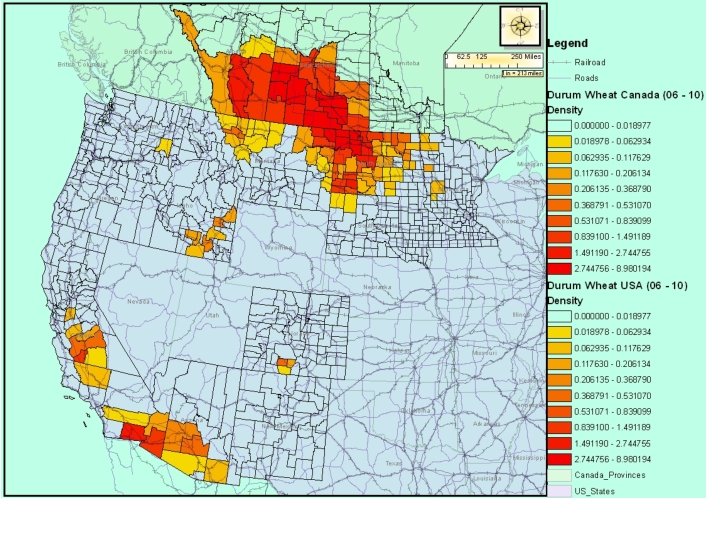
Explain the variability in spring wheat basis values in North Dakota, with an emphasis on detecting transportation disruptions and potential Canadian wheat movements into the U. S.
 1, 400 1, 000 800 600 400")
U. S. All Wheat Use (Million Bushels) 1, 400 1, 000 800 600 400 200 00 20 /01 01 20 /02 02 20 /03 03 20 /04 04 20 /05 05 20 /06 06 20 /07 07 20 /08 08 20 /09 09 20 /10 10 20 /11 11 20 /12 12 20 /13 13 20 /14 14 20 /15 15 20 /16 16 /1 7 0 20 Million Bushels 1, 200 Food Exports Feed & Residual Seed USDA – WASDE – Sep. 12, 2016 & USDA Wheat Yearbook -Table 5

US WHEAT PRODUCTION REGIONS / CLASSES W ft So Durum Ha at he e. W hit rd Re pring ed S ard R H d. W in t er rd rd Ha Ha r d. W e int Re d. W Re er int Durum Hard Red Winter Hard Red Spring Soft White Hard White Soft Red Winter Durum er int f So d. W e t. R

Elevator Locations Chosen • Selected for location on main line railway, near port of entry and on well maintained roads. – Shipment of grain from Canada into U. S. by truck – “Super-B” and bridge weight limits • • • Harvey – CP rail Rugby – BNSF Berthold – BNSF & CP Williston – BNSF Wolf Point, MT – BNSF

Locations for Analysis

Elevator Locations Chosen

Elevator Locations Chosen
 25. 00 20. 00")
Historic Wheat Prices (Jan. 3, 2006 – Apr. 7, 2016) 25. 00 20. 00 15. 00 10. 00 5. 00 MPLS 14% Truck Bid Portland 14% Rail Bid MGEX Nearby Futures 16 20 3/ 1/ 15 20 3/ 1/ 14 20 3/ 1/ 13 20 3/ 1/ 12 20 3/ 1/ 11 20 3/ 1/ 10 20 3/ 1/ 1/ 3/ 20 09 08 20 1/ 3/ 07 20 3/ 1/ 1/ 3/ 20 06 0. 00
 3. 0 Stocks-to-Use")
U. S. All Wheat – Total Prod. & Use (Billion Bushels) 3. 0 Stocks-to-Use Total Production 1. 00 Total Use 0. 90 0. 70 2. 0 0. 60 1. 5 0. 50 0. 40 1. 0 0. 30 Stocks-to-Use Ratio 0. 80 0. 20 0. 5 0. 10 2016/17 2014/15 2012/13 2010/11 2008/09 2006/07 2004/05 2002/03 2000/01 1998/99 1996/97 1994/95 1992/93 1990/91 1988/89 1986/87 1984/85 0. 00 1982/83 0. 0 1980/81 Billion Bushels 2. 5 Sep. 12, 2016 WASDE Report & Wheat Yearbook Table 6
 750. 0 Stocks-to-Use Total Production")
World Wheat Prod, Use & Stocks/Use (Million Metric Ton) 750. 0 Stocks-to-Use Total Production 0. 70 Total Dom. Use 700. 0 600. 0 0. 50 550. 0 0. 40 500. 0 450. 0 0. 30 400. 0 0. 20 350. 0 2016/17 2014/15 2012/13 2010/11 2008/09 2006/07 2004/05 2002/03 2000/01 1998/99 1996/97 1994/95 1992/93 1990/91 1988/89 1986/87 1984/85 0. 10 1982/83 300. 0 1980/81 Million Metric Tons 650. 0 Stocks-to-Use Ratio 0. 60 USDA – WASDE- Sep. 12, 2016 & PSD Custom Query
 250 200 150")
Basis Comparison by Location (Jan. 6, 2000 – Apr. 7, 2016) 250 200 150 100 50 0 -50 -100 -150 -200 -250 Harvey 6 5 01 /2 23 23 1/ Wolf_Point 1/ /2 01 /2 23 01 4 3 1/ 23 /2 01 2 Williston 1/ /2 23 1/ 01 /2 23 01 1 0 Berthold 1/ 23 /2 01 9 1/ 23 /2 00 8 Rugby 1/ /2 1/ 23 00 /2 23 1/ 00 7 6 00 /2 23 1/ 23 /2 00 4 1/ 23 /2 00 3 1/ 00 /2 23 1/ 5 -300

Shifting North Dakota Planted Acreage 14, 000 12, 000 10, 000 8, 000 6, 000 4, 000 2, 000 1985 1986 1987 1988 1989 1990 1991 1992 1993 1994 1995 1996 1997 1998 1999 2000 2001 2002 2003 2004 2005 2006 2007 2008 2009 2010 2011 2012 2013 2014 2015 2016 0 All Wheat Soybean Corn Spring Wheat
 200 150 100")
Historical Basis - Harvey (Jun. 1, 2000 – Apr. 7, 2016) 200 150 100 50 0 -50 -100 -150 -200 -250 1 3 5 7 9 11 13 15 17 19 21 23 25 27 29 31 33 35 37 39 41 43 45 47 49 51 53 2000 -01 2001 -02 2002 -03 2003 -04 2004 -05 2005 -06 2006 -07 2007 -08 2008 -09 2009 -10 2010 -11 2011 -12 2012 -13 2013 -14 2014 -15 2015 -16
 200 150 100")
Historical Basis - Rugby (Jun. 1, 2000 – Apr. 7, 2016) 200 150 100 50 0 -50 -100 -150 -200 -250 1 3 5 7 9 11 13 15 17 19 21 23 25 27 29 31 33 35 37 39 41 43 45 47 49 51 53 2000 -01 2001 -02 2002 -03 2003 -04 2004 -05 2005 -06 2006 -07 2007 -08 2008 -09 2009 -10 2010 -11 2011 -12 2012 -13 2013 -14 2014 -15 2015 -16
 200 150 100")
Historical Basis - Berthold (Jun. 1, 2000 – Apr. 7, 2016) 200 150 100 50 0 -50 -100 -150 -200 -250 1 3 5 7 9 11 13 15 17 19 21 23 25 27 29 31 33 35 37 39 41 43 45 47 49 51 53 2000 -01 2001 -02 2002 -03 2003 -04 2004 -05 2005 -06 2006 -07 2007 -08 2008 -09 2009 -10 2010 -11 2011 -12 2012 -13 2013 -14 2014 -15 2015 -16
 200 150 100")
Historical Basis - Williston (Jun. 1, 2000 – Apr. 7, 2016) 200 150 100 50 0 -50 -100 -150 -200 -250 1 3 5 7 9 11 13 15 17 19 21 23 25 27 29 31 33 35 37 39 41 43 45 47 49 51 53 2000 -01 2001 -02 2002 -03 2003 -04 2004 -05 2005 -06 2006 -07 2007 -08 2008 -09 2009 -10 2010 -11 2011 -12 2012 -13 2013 -14 2014 -15 2015 -16
 200 150")
Historical Basis – Wolf Point (Jun. 1, 2000 – Apr. 7, 2016) 200 150 100 50 0 -50 -100 -150 -200 -250 1 3 5 7 9 11 13 15 17 19 21 23 25 27 29 31 33 35 37 39 41 43 45 47 49 51 53 2000 -01 2001 -02 2002 -03 2003 -04 2004 -05 2005 -06 2006 -07 2007 -08 2008 -09 2009 -10 2010 -11 2011 -12 2012 -13 2013 -14 2014 -15 2015 -16
 200 150 100")
Historical Basis – Harvey (Jun. 1, 2000 – May 29, 2008) 200 150 100 50 0 -50 -100 -150 -200 -250 1 3 5 7 9 11 13 15 17 19 21 23 25 27 29 31 33 35 37 39 41 43 45 47 49 51 53 2000 -01 2001 -02 2002 -03 2003 -04 2004 -05 2005 -06 2006 -07 2007 -08
 200 150 100")
Historical Basis – Harvey (May 5, 2008 – Apr. 7, 2016) 200 150 100 50 0 -50 -100 -150 -200 -250 1 3 5 7 9 11 13 15 17 19 21 23 25 27 29 31 33 35 37 39 41 43 45 47 49 51 53 2008 -09 2009 -10 2010 -11 2011 -12 2012 -13 2013 -14 2014 -15 2015 -16
 200 150 100")
Historical Basis – Rugby (Jun. 1, 2000 – May 29, 2008) 200 150 100 50 0 -50 -100 -150 -200 -250 1 3 5 7 9 11 13 15 17 19 21 23 25 27 29 31 33 35 37 39 41 43 45 47 49 51 53 2000 -01 2001 -02 2002 -03 2003 -04 2004 -05 2005 -06 2006 -07 2007 -08
 200 150 100")
Historical Basis – Rugby (May 5, 2008 – Apr. 7, 2016) 200 150 100 50 0 -50 -100 -150 -200 -250 1 3 5 7 9 11 13 15 17 19 21 23 25 27 29 31 33 35 37 39 41 43 45 47 49 51 53 2008 -09 2009 -10 2010 -11 2011 -12 2012 -13 2013 -14 2014 -15 2015 -16
 200 150 100")
Historical Basis – Berthold (Jun. 1, 2000 – May 29, 2008) 200 150 100 50 0 -50 -100 -150 -200 -250 1 3 5 7 9 11 13 15 17 19 21 23 25 27 29 31 33 35 37 39 41 43 45 47 49 51 53 2000 -01 2001 -02 2002 -03 2003 -04 2004 -05 2005 -06 2006 -07 2007 -08
 200 150 100")
Historical Basis – Berthold (May 5, 2008 – Apr. 7, 2016) 200 150 100 50 0 -50 -100 -150 -200 -250 1 3 5 7 9 11 13 15 17 19 21 23 25 27 29 31 33 35 37 39 41 43 45 47 49 51 53 2008 -09 2009 -10 2010 -11 2011 -12 2012 -13 2013 -14 2014 -15 2015 -16
 200 150 100")
Historical Basis – Williston (Jun. 1, 2000 – May 29, 2008) 200 150 100 50 0 -50 -100 -150 -200 -250 1 3 5 7 9 11 13 15 17 19 21 23 25 27 29 31 33 35 37 39 41 43 45 47 49 51 53 2000 -01 2001 -02 2002 -03 2003 -04 2004 -05 2005 -06 2006 -07 2007 -08
 200 150 100")
Historical Basis – Williston (May 5, 2008 – Apr. 7, 2016) 200 150 100 50 0 -50 -100 -150 -200 -250 1 3 5 7 9 11 13 15 17 19 21 23 25 27 29 31 33 35 37 39 41 43 45 47 49 51 53 2008 -09 2009 -10 2010 -11 2011 -12 2012 -13 2013 -14 2014 -15 2015 -16
 200 150")
Historical Basis – Wolf Point (Jun. 1, 2000 – May 29, 2008) 200 150 100 50 0 -50 -100 -150 -200 -250 1 3 5 7 9 11 13 15 17 19 21 23 25 27 29 31 33 35 37 39 41 43 45 47 49 51 53 2000 -01 2001 -02 2002 -03 2003 -04 2004 -05 2005 -06 2006 -07 2007 -08
 200 150")
Historical Basis – Wolf Point (May 5, 2008 – Apr. 7, 2016) 200 150 100 50 0 -50 -100 -150 -200 -250 1 3 5 7 9 11 13 15 17 19 21 23 25 27 29 31 33 35 37 39 41 43 45 47 49 51 53 2008 -09 2009 -10 2010 -11 2011 -12 2012 -13 2013 -14 2014 -15 2015 -16

The Wheat Basis Model Variables • Seasonality – Sep – Nov – Dec – Feb – Mar – May • Basis at terminal markets – Minneapolis 20 day to-arrive truck basis – Portland 30 day to-arrive rail basis

The Wheat Basis Model Variables • Weekly wheat export sales – Current week, one week lag, two week lag, three week lag and four week lag • Tariff rate with Fuel Service Charge – North Dakota – Grand Forks – Montana – Great Falls • Non-Shuttle – Secondary Market – Current Month – Previous Month (Feb. delivery in Jan. )

The Wheat Basis Model Variables • Shuttle – Secondary Market – Current Month – Previous Month (ex. Feb. delivery in Jan. ) • Carry in the futures market • Nearby futures market price

The Wheat Basis Model Results Variable Units Harvey CP Constant Cents/Bu 133. 06 105. 32 178. 37 139. 17 82. 89 Sep – Nov Dummy N. S. -11. 972 8. 642 Dec – Feb Dummy N. S. -6. 862 N. S. 7. 814 Mar – May Dummy N. S. 6. 671 (0. 000) Rugby - Berthold – Williston BNSF/CP BNSF (0. 005) (0. 105) (0. 000) (0. 001) (0. 019) Wolf Point BNSF (0. 000) (0. 021) (0. 045) (0. 055)

The Wheat Basis Model Results Units Harvey CP Cents/Bu 0. 9513 0. 9280 0. 9536 0. 9301 0. 5453 0. 3085 0. 3899 0. 3772 0. 4050 0. 5975 Weekly All - Wheat 1, 000 Bu Export Sales N. S. Weekly All - Wheat Export Sales – 1 1, 000 Bu Week Lag N. S. Variable Minneapolis 20 Day To-Arrive Truck Basis Portland 30 Day To Cents/Bu -Arrive Rail Basis (0. 000) Rugby - Berthold – Williston BNSF/CP BNSF (0. 000) Wolf Point BNSF (0. 000)

The Wheat Basis Model Results Variable Units Weekly All - Wheat Export Sales – 2 1, 000 Bu Week Lag Weekly All - Wheat Export Sales – 3 1, 000 Bu Week Lag Weekly All - Wheat Export Sales – 4 1, 000 Bu Week Lag North Dakota Tariff Rate + FSC $/Bu Harvey CP Rugby - Berthold – Williston BNSF/CP BNSF Wolf Point BNSF 0. 0481 0. 0464 N. S. 0. 0712 0. 0378 0. 0519 0. 0568 0. 0825 N. S. 0. 0553 N. S. 0. 0763 0. 0754 N. S. -194. 25 -179. 73 -242. 90 ------ (0. 072) (0. 060) (0. 042) (0. 000) (0. 093) (0. 047) (0. 000) (0. 003) (0. 007) (0. 000) (0. 034) (0. 027) (0. 084)

The Wheat Basis Model Results Variable Units Harvey CP Rugby - Berthold – Williston BNSF/CP BNSF Montana Tariff Rate + FSC $/Bu ------ -312. 93 -200. 22 Non-Shuttle Secondary Market $/Car N. S. Shuttle – Secondary Market $/Car N. S. -0. 0046 Non-Shuttle Secondary Market – Previous Month $/Car N. S. -0. 0093 N. S. (0. 000) (0. 046) Wolf Point BNSF (0. 000) (0. 005)

The Wheat Basis Model Results Variable Units Harvey CP Rugby - Berthold – Williston BNSF/CP BNSF Shuttle – Secondary Market – Previous Month $/Car -0. 0165 -0. 0197 -0. 0165 -0. 0061 -0. 0120 Carry in Futures Market $/Bu -0. 3904 -0. 3228 -0. 5154 -0. 5929 -0. 2067 Nearby Futures Price $/Bu 2. 6051 2. 5430 4. 9490 2. 9934 N. S. 0. 7507 0. 7885 0. 7879 0. 7531 0. 8618 Adj. R 2 (0. 000) (0. 043) (0. 000) (0. 004) (0. 059) (0. 000) (0. 032) (0. 001) (0. 077) Wolf Point BNSF (0. 000) (0. 051)

The Wheat Basis Model Results Harvey Basis 100 50 0 -50 -100 -150 6/5/2008 6/5/2009 6/5/2010 6/5/2011 6/5/2012 6/5/2013 Harvey Predicted 6/5/2014 6/5/2015

The Wheat Basis Model Results Rugby Basis 100 50 0 -50 -100 -150 6/5/2008 6/5/2009 6/5/2010 6/5/2011 Rugby 6/5/2012 6/5/2013 Rugby Predicted 6/5/2014 6/5/2015

The Wheat Basis Model Results Berthold Basis 100 50 0 -50 -100 -150 6/5/2008 6/5/2009 6/5/2010 6/5/2011 Berthold 6/5/2012 6/5/2013 Berthold Predicted 6/5/2014 6/5/2015

The Wheat Basis Model Results Williston Basis 100 50 0 -50 -100 -150 6/5/2008 6/5/2009 6/5/2010 6/5/2011 Williston 6/5/2012 6/5/2013 Williston Predicted 6/5/2014 6/5/2015

The Wheat Basis Model Results Wolf Point Basis 100 50 0 -50 -100 -150 6/5/2008 6/5/2009 6/5/2010 6/5/2011 Wolf Point 6/5/2012 6/5/2013 Wolf Point Predicted 6/5/2014 6/5/2015
 200 150 100")
Historical Basis – Harvey (May 5, 2008 – Apr. 7, 2016) 200 150 100 50 0 -50 -100 -150 -200 -250 1 3 5 7 9 11 13 15 17 19 21 23 25 27 29 31 33 35 37 39 41 43 45 47 49 51 53 2008 -09 2009 -10 2010 -11 2011 -12 2012 -13 2013 -14 2014 -15 2015 -16
 200 150 100")
Historical Basis – Rugby (May 5, 2008 – Apr. 7, 2016) 200 150 100 50 0 -50 -100 -150 -200 -250 1 3 5 7 9 11 13 15 17 19 21 23 25 27 29 31 33 35 37 39 41 43 45 47 49 51 53 2008 -09 2009 -10 2010 -11 2011 -12 2012 -13 2013 -14 2014 -15 2015 -16
 200 150 100")
Historical Basis – Berthold (May 5, 2008 – Apr. 7, 2016) 200 150 100 50 0 -50 -100 -150 -200 -250 1 3 5 7 9 11 13 15 17 19 21 23 25 27 29 31 33 35 37 39 41 43 45 47 49 51 53 2008 -09 2009 -10 2010 -11 2011 -12 2012 -13 2013 -14 2014 -15 2015 -16
 200 150 100")
Historical Basis – Williston (May 5, 2008 – Apr. 7, 2016) 200 150 100 50 0 -50 -100 -150 -200 -250 1 3 5 7 9 11 13 15 17 19 21 23 25 27 29 31 33 35 37 39 41 43 45 47 49 51 53 2008 -09 2009 -10 2010 -11 2011 -12 2012 -13 2013 -14 2014 -15 2015 -16
 200 150")
Historical Basis – Wolf Point (May 5, 2008 – Apr. 7, 2016) 200 150 100 50 0 -50 -100 -150 -200 -250 1 3 5 7 9 11 13 15 17 19 21 23 25 27 29 31 33 35 37 39 41 43 45 47 49 51 53 2008 -09 2009 -10 2010 -11 2011 -12 2012 -13 2013 -14 2014 -15 2015 -16

Overview of Canadian Wheat Sector
 1, 400 1, 000 800 600 400")
U. S. All Wheat Use (Million Bushels) 1, 400 1, 000 800 600 400 200 00 20 /01 01 20 /02 02 20 /03 03 20 /04 04 20 /05 05 20 /06 06 20 /07 07 20 /08 08 20 /09 09 20 /10 10 20 /11 11 20 /12 12 20 /13 13 20 /14 14 20 /15 15 20 /16 16 /1 7 0 20 Million Bushels 1, 200 Food Exports Feed & Residual Seed USDA – WASDE – Sep. 12, 2016 & USDA Wheat Yearbook -Table 5

Food, Seed, Ind Exports 7 /1 6 /1 16 20 5 /1 15 20 4 /1 3 /1 14 20 13 20 2 /1 12 20 1 /1 11 20 0 9 /0 /1 10 20 09 20 8 /0 08 20 7 /0 07 20 6 5 /0 /0 06 20 05 20 4 /0 04 20 3 /0 03 20 2 /0 02 20 1 /0 01 20 00 20 Million Metric Ton Canadian All Wheat Disappearance (Million Metric Tons) 30. 0 25. 0 20. 0 15. 0 10. 0 5. 0 0. 0 Feed USDA-PSD Custom Query

What role did the Canadian Wheat Board play?

Core function of “The Board” • Monopoly buyer/seller of milling quality wheat, durum and barley (feed and malt) since 1943. • Sales were made directly or through accredited exporters. • Operated Pool Pricing System • Canadian Government guaranteed: • All borrowing needed to buy/sell grain • Borrowing for initial payments to growers • Margin calls on futures hedging positions

Ancillary functions of “The Board” • Allocated rail cars to elevators. • Conducted tendering system for elevation system. • A committee member influencing: • Grain quality regulations • Variety releases • Export promotion • Indirectly involved in export permits. • NOTE: The CWB owned limited assets, so it relied on Canadian Government to guarantee funding.
 G 3 Canada Limited (JV of Bunge Canada and")
The CWB (v. 2. 0) G 3 Canada Limited (JV of Bunge Canada and Saudi Agricultural and Livestock Investment Company)

Western Canada Export Locations • Vancouver, British Columbia • Prince Rupert, British Columbia • Thunder Bay, Ontario • Churchill, Manitoba

Western Canada Export Locations

CN Rail Lines

CP Rail Lines
 Locations")
Viterra (Glencore) Locations

JRI Locations

Cargill Locations

Paterson Grain Locations

Parrish & Heimbecker Locations

Louis Dreyfus Locations

Berthold Farmers LD - Aberdeen LD - Joffre BTR - US BTR - CD MGEX Nearby /2 14 7/ 6 6 01 01 /2 14 5/ /2 15 5 5 01 20 /2 14 3/ 14 1/ 01 5 5 5 01 01 /2 4/ /1 14 9/ /2 14 7/ 4 4 4 14 01 /2 14 5/ /2 14 3/ /2 14 1/ 01 01 01 4 4 01 20 4/ /1 /2 14 9/ /2 14 7/ 3 3 13 01 /2 /2 14 5/ 01 01 20 /2 14 3/ 14 1/ /2 4/ /1 11 /2 14 9/ 11 /2 14 7/ 11 /2 14 5/ 14 3/ US Cents/Bu. US & Canadian Spring Wheat Prices 800 700 600 500 400 300

Berthold Farmers LD - Aberdeen LD - Joffre BTR - US BTR - CD 01 01 5 5 5 6 6 6 01 01 01 6 15 01 /2 14 7/ 4 4 4 14 01 /2 /2 14 5/ 01 01 01 20 /2 14 3/ 14 1/ 4/ /1 11 /2 14 9/ /2 14 7/ /2 14 5/ /2 4 4 01 20 /2 14 3/ 14 1/ 4/ /1 11 /2 14 9/ /2 14 7/ 3 13 01 /2 14 5/ /2 3 3 3 01 20 /2 14 3/ 14 1/ 4/ /1 11 01 01 01 /2 14 9/ /2 /2 14 7/ /2 14 5/ 14 3/ US & Canadian Spring Wheat Basis 0 -50 -100 -150 -200 -250 -300

Questions?
- Slides: 68