Understanding the Potential Impact of Climate Change The


. Red")


 Geographic distribution of long-term linear trends in mean sea")


 Equation")
 = high-frequency part + low-frequency part")
")


 and")


: Five types of uncertainties: Incomplete or")
: with respect to mass-sea level relation: No;")


- Slides: 43
Understanding the Potential Impact of Climate Change: The Example of Sea Level Change Hans-Peter Plag Nevada Bureau of Mines and Geology & Seismological Laboratory University of Nevada, Reno, USA.
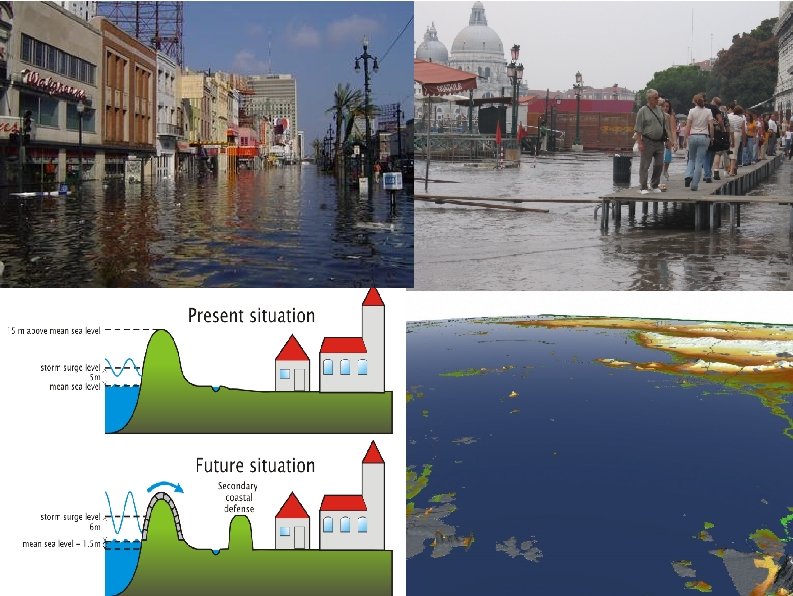
Potential impact: Example Florida Today 2 m 1 m 4 m
Potential impact: Example Bangladesh Today 1 m 2 m 4 m
Observed Impacts on Coast Line Long-term changes Example: Danish Coast
Observed Impacts on Coast Line Instantaneous Impacts: Example: December 26, 2004 Tsunami Lampuuk, northwest Sumatra
Observed Impacts on Coast Line Instantaneous Impacts: Example: December 26, 2004 Tsunami Gleebruk Village
Observed Impacts on Coast Line Instantaneous Impacts: Example: December 26, 2004 Tsunami Gleebruk Village
Understanding the Potential Impact of Climate Change: Example of Sea Level Change My focus: Understanding slow sea level changes, their relation to climate change, and their impacts: Comments on past sea level changes (IPCC AR 4) Basic terms Local sea level equation (illustrating the complexity) Observation-based approximation (simplification) Understanding past sea level changes: the example of the Dutch coast Plausible Forcing scenarios and range of predictions Uncertainties (main contributions) How to address the uncertainties in decision making?
Global Sea Level Rise Annual averages of the global mean sea level (mm). Red curve: reconstructed sea level since 1870 (Church and White, 2006); Blue curve: coastal tide gauge measurements (Holgate and Woodworth, 2004) Black curve: satellite altimetry (Leuliette et al. , 2004). IPCC, AR 4
Global Sea Level Rise Budget of the global mean sea level change Blue: 1961 to 2003 Brown: 1993 to 2003 Bars represent the 90% error range. IPCC, AR 4
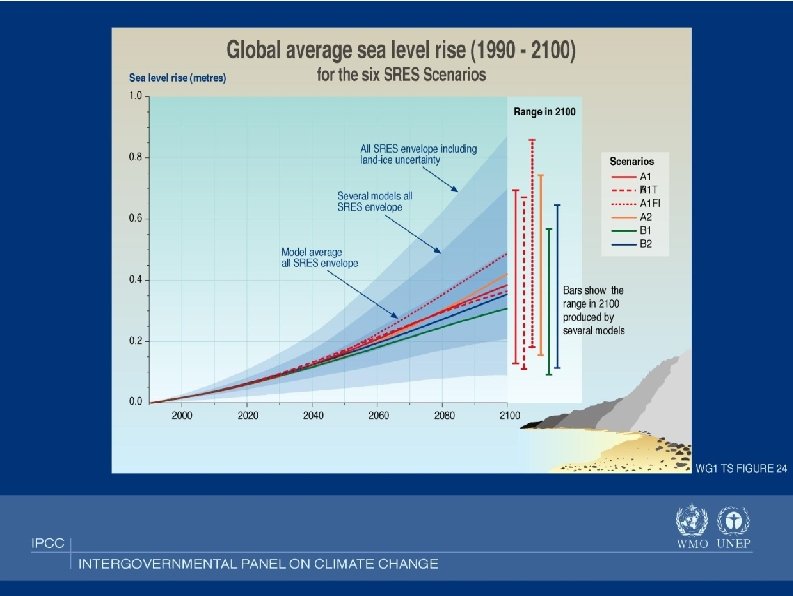
Global Sea Level Rise IPCC, AR 4
Local Sea Level Rise (a) Geographic distribution of long-term linear trends in mean sea level (mm yr– 1) for 1955 to 2003 as reconstructed based on tide gauges and altimetry data (Church et al. , 2004). (b) Geographic distribution of linear trends in thermal expansion (mm yr– 1) for 1955 to 2003 (700 m, Ishii et al. , 2006). IPCC, AR 4
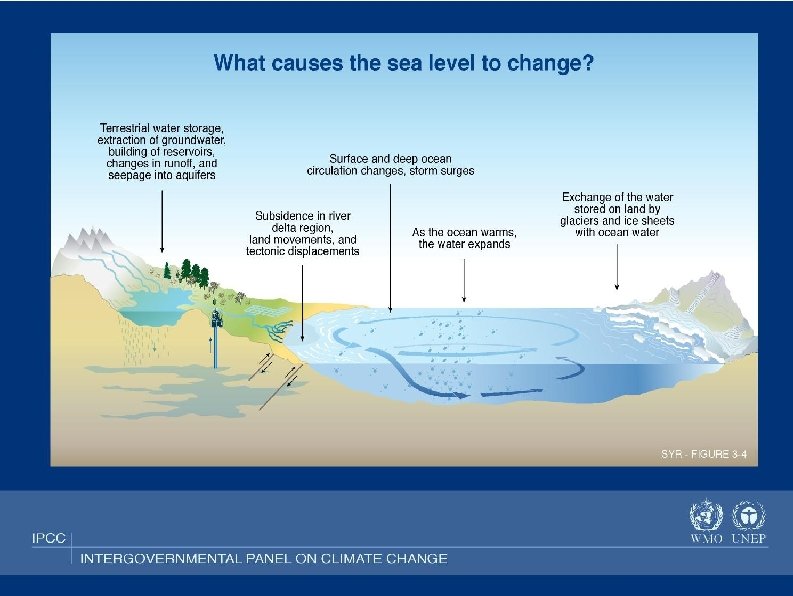
Basic Terms and Concepts in Sea Level Studies Sea surface Comments on the relation between mass changes (exchange and redistribution) and LSL Sea floor
Geodetic Monitoring of Sea Level Tide Gauges Laser http: //sealevel. colorado. edu/tidegauges. html GRACE GNSS Reflections Zufada & Zavorotny (2004) Satellite Altimetry Radar
Local Sea Level (LSL) Equation
Local Sea Level Equation Local Sea Level (LSL) = high-frequency part + low-frequency part Result of local and regional processes.
Local Sea Level Equation Comments on the relation between mass changes (exchange and redistribution) and LSL Result of local, regional and global processes!
Local Sea Level Equation Green's Function for LSL Ocean function Load on ocean areas Loads on land areas All mass movements • change the geoid, • displace the ocean bottom vertically
Forcing: Postglacial Rebound Postglacial rebound: present-day signal in sea level 120_1_2 mm/yr 120110. mn mm/yr
Forcing: Ice Sheet Fingerprints Present-day changes in: * Ice sheets Greenland * Glaciers * Land water storage Finger-print functions: describe the effect of a unit ice mass change in a given area on sea level. Solution of the static sea level equation for a unit linear trend over a given ice mass area. Simplifications: - spherically symmetric Earth model - elastic (up to century time scales) Antarctica
Forcing: Thermo-Steric Changes Levitus et al. , 2000 mm/yr Ishii et al. , 2003 mm/yr
Observations: Local Sea Level Trends Plag, 2006
Reconstruction of Local Sea Level Trends Levitus et al. , 2000 Global models consistent with tide gauges Global average: 1. 14 mm/yr at tide gauges 0. 90 mm/yr global average Ishii et al. , 2003 Global average: 1. 10 mm/yr at tide gauges 0. 83 mm/yr global average Plag, 2006
Observation-Based Local Approximation Note: Importance of link between geodetic Reference Frame Origin (RFO) and Center of Mass of the Earth System (CM)
Observation-Based Approximation Uncertainty in relationship between RFO and CM: ~ 2 mm/yr Apparent vertical motion due to relative motion of origin ITRF 2000 minus ITRF 2005 ITRF 97 minus ITRF 2000 Effect on global sea level: 0. 4 mm/yr (Plag, 2005) Effect on LSL +- 2 mm/yr ITRF 2000 minus ITRF 2005
Example Dutch Coast: Spatial Pattern of Past LSL Trends 0 to 4 mm/yr Observed LSL Trends Upper: All data Lower: Data for 1950 - 2008
Example Dutch Coast: Past LSL Trends, Summary Observed Trends: * Considerable spatial variability (order ± 2 mm/yr) * Considerable temporal variability from 5 to more decades (order ± 1 mm/yr) Forcing: * Atmospheric forcing: order 1 mm/yr over 50 years * Postglacial rebound: order 1 -2 mm/yr with large uncertainties * thermo-steric: very small, order 0. 2 mm/yr * ice sheets: small, order 0. 7 mm/yr (Plag, 2006, -0. 3 and + 1. 0 mm/yr) * balance for individual tide gauges between -4 and +2. 5 mm/yr, mean 0. 2 mm/yr. Main uncertainties: * Postglacial rebound * Ice sheets * Vertical land motion
Example Dutch Coast: Future LSL Changes Delta Commission, advising the Dutch parliament: Main Question: Can the Probability Density Function for global temperature be translated into a Probability Density Function for local sea level at the Dutch Coast? IPCC AR 4
Introduction: Scenarios of Future Sea Levels Main goal of scenario analysis: Characterize uncertainties for less predictable aspects of future projections Main approach: Make different assumption about the forcing The case of climate change: consider a range of reasonable emission scenarios. The case of Local Sea Level: consider a range of reasonable ocean warming and ice sheet scenarios combined with model output for ocean and atmospheric circulation, vertical land motion, and LSL fingerprints • • LSL is impact parameter for coastal zone.
Introduction: Examples of Scenarios
Scenarios of Future Sea Levels
Forcing Scenarios and Projections of Future LSLs PDFs
Forcing Scenarios and Projections of Future LSLs Forcing Scenarios
Forcing Scenarios and Projections of Future LSLs LSL Projections
Forcing Scenarios and Projections of Future LSLs Blue: 2050 Red: 2100 Green: 2200
Uncertainties Manning and Petit (2003, IPCC Theme paper): Five types of uncertainties: Incomplete or imperfect observations (aleatoric uncertainties): vertical land motion, reference frame, oceanographic observations; • Incomplete conceptual framework (epistemic uncertainties): with respect to climate system: Yes; with respect to mass-sea level relation: No; • Inaccurate description of known processes: one-dimensional models, incomplete mass redistribution, gravitationally inconsistent models; • Chaos: With respect to climate system: Yes; for mass-sea level: No; • Lack of predictability: ice sheet behavior, ocean warming, circulation. •
Uncertainties * Incomplete conceptual framework (epistemic uncertainties): with respect to mass-sea level relation: No; But we have large inter-model difference in ice sheet fingerprints! Very Surprising! Elastic Theory well established and applied to: * Earth tides * Ocean tidal loading * Atmospheric, hydrological loading * Earth rotation * Inaccurate description of known processes: one-dimensional models, incomplete mass redistribution, gravitationally inconsistent models, programming errors;
Uncertainties “Uncertainties affecting available scientific results need to be explained clearly and in ways that avoid confusion and assist policymakers and nonspecialists when considering decisions and risk management” (Manning and Petit, 2003). Main uncertainties in understanding past/current LSL changes: • Steric effect not well known due to lack of data; • Vertical land motion still uncertain in a geocentric reference frame; • Mass redistribution/Geoid variations not well constrained; Consequences: • Separation of the different factors contributing to LSL not satisfactory • Large uncertainties map into future scenarios creating a wide range of possible sea level changes
Uncertainties “Uncertainties affecting available scientific results need to be explained clearly and in ways that avoid confusion and assist policymakers and nonspecialists when considering decisions and risk management” (Manning and Petit, 2003). Sea-level related risk of coastal inundation: • Future changes in ice sheets are main uncertainty (large spatial variations). • Currently, the range of plausible LSL scenarios for most locations is very large. Precautionary approach: Slow retreat from coastal zone areas prone to inundation or Building increasingly more expensive protections where needed? Don't put your jewellery at the window where thief can easily get it!
The End