Understanding Population Change Principles of Population Ecology Population


:")
:")


. 2013, U. S. : b")


 Largest population that can be maintained for")


")
")


- Slides: 43
Understanding Population Change
Principles of Population Ecology Population ecologists ask: How many are in the population? Are its numbers increasing / decreasing? What is its pattern of reproduction? What is its pattern of mortality?
Principles of Population Ecology Population Density Number of organisms of a species per unit area or volume. Varies by habitat, season, or year 20 / 100 m 2 20 / 25 m 2
Principles of Population Ecology Populations change over time On a global scale (closed system):
Principles of Population Ecology Populations change over time On a local scale (open system):
Principles of Population Ecology Populations change over time. Growth rate equals rate of birth minus the rate of death in the population. In humans, b and d are per 1, 000 people per year. Growth Death rate r= b–d Birth rate
Principles of Population Ecology Populations change over time Dispersal – movement from one region to another Emigration Immigration Death Growth Emigration rate r = (b – d) + (i – e) Birth rate Immigration rate
Principles of Population Ecology Ex. Calculating growth rate (r). 2013, U. S. : b = 13 per 1000 people, d = 8 per 1000 people. r=b–d r = 13/1000 - 8/1000 = 5/1000 =. 0005 rate of growth in U. S. in 2013
Principles of Population Ecology Maximum Population Growth Intrinsic rate of increase a. k. a. biotic potential Rate at which a population could increase under ideal conditions. Determined by age of 1 st reproduction, amount of life span spent reproducing, # of times of reproduction, # of offspring produced
Principles of Population Ecology Maximum Population Growth Exponential population growth http: //www. hippocampus. org/hippocampus. php/course_locator. php? skin. Path=http: //www. hippocampus. org/hippoca mpus. skins/default&course=Environmental%20 Science&lesson=36&topic=1&topic. Title=Population%20 Crash Population growth when conditions are optimal and reproduction is constant. J-shaped curve (exponential growth)
Principles of Population Ecology Environmental Resistance Environmental limits that prevents exponential growth. Ex. Food, water, shelter, etc. S-shaped curve (logistic growth)
Principles of Population Ecology Carrying capacity (K) Largest population that can be maintained for an indefinite period of time Changes in response to environmental changes & resource consumption. S-shaped curve (logistic growth)
STATIONARY PHASE DEATH PHASE EXPONENTIAL/ LOG PHASE LAG PHASE
Principles of Population Ecology Time Zero - time of establishment of a population Lag Phase - time that it takes for the population to start growing Log Phase - period of exponential (logarithmic) growth. Stationary (stabilization) Phase - # of deaths = the # of new individuals. Death Phase - population is dying due to depletion of resources and or contamination of habitat with waste products.
Principles of Population Ecology Population crash – abrupt decline from high to low population density; caused by overshooting K
Reproductive Strategies Life history strategy Organisms lifestyle that is adapted for its reproductive patterns. Organisms can’t use ALL of their energy for reproduction. Make tradeoffs Two life history strategies: r-selected species K-selected species
Reproductive Strategies Life History Strategies r-selected vs. high growth rate small body size early maturity short life span large broods little / no parental care K-selected slow growth rate large body size late maturity long life span small broods high parental care
Reproductive Strategies
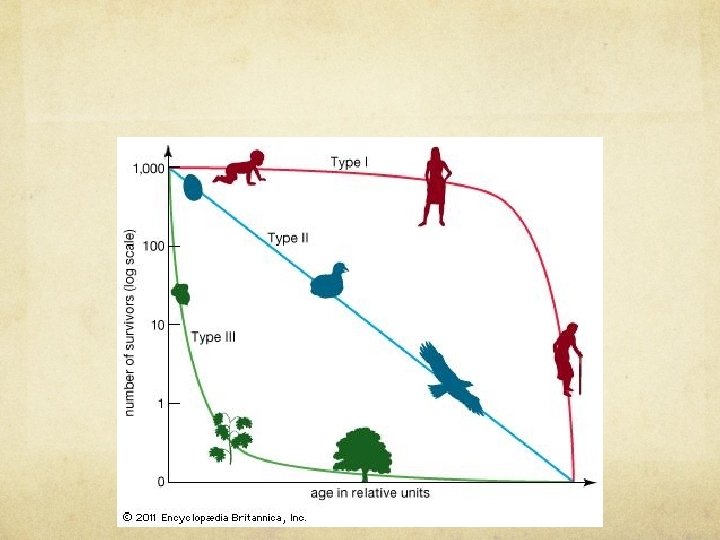
Reproductive Strategies Survivorship Probability of survival of an individual to a particular age. Life history table likelihood of survival for individuals at different times during their lives.
Reproductive Strategies Types of Strategists Type I High survival early in life. Deaths later in life Type II Survivorship doesn’t change with age. Type III High survival later in life. Deaths early in life
Factors that Affect Population Size Density-Dependent Factors that influence population growth as a result of population density. Causes slower population growth at higher density. Ex. predation, competition, disease.
Factors that Affect Population Size Boom-or-Bust Cycles of population highs and lows Caused by density-dependent factors?
Factors that Affect Population Size Case-in-Point: Predatory Prey Dynamics on Isle Royale
Factors that Affect Population Size Density-Independent Factors that influence population growth, regardless of population density. Usually abiotic. Ex. Weather, fire.
The Human Population Human population size 2013 = 7 billion people Thomas Malthus Consequences of population growth are famine, disease, & war. Green revolution has allowed population to grow.
The Human Population Current Population Numbers In 2004 = ~6. 4 billion Pop. increase is the result of a decrease in death rate. More food, better medical care, better water quality / sanitation Population Changes http: //www. census. gov/main/www/popclock. html
The Human Population Current Population Numbers Rapid growth primarily due to drop in death rates
The Human Population Projecting Future Population Numbers When will zero population growth occur? b=d End of 21 st century? Depends upon resource consumption vs. availability http: //www. hippocampus. org/hippocampus. php/course_locato r. php? course=Environmental%20 Science&lesson=35&topic= 1&width=800&height=684&topic. Title=Cultural%20 Carrying% 20 Capacity&skin. Path=http: //www. hippocampus. org/hippoca mpus. skins/default
Demographics of Countries Demography Study of population statistics Develop. ED countries Low birth rates, low infant mortality, high life expectancy, high mean GNI & PPP Infant mortality - # infant deaths under age 1 per 1000 live births Develop. ING countriesd Moderately - medium birth rates & GNI/PPP Less developed – high birth & death rates, shortest life expectancy, & low GNI/PPP
Demographics of Countries Most Populous Countries Insert Table 8. 1
Demographics of Countries Developed vs. Developing Countries Demographics Insert Table 8. 2 (note reconstruction)
Demographics of Countries Developed vs. Developing Countries Demographics Insert Table 8. 2 (note reconstruction)
Demographics of Countries Doubling time Amount of time it would take for a population to double. “Rule of 70” Doubling time = 70 / growth rate td = 70/r Greater doubling time, more developed.
Demographics of Countries Replacement-Level Fertility Number of offspring needed for a couple to replace themselves. RLF = 2. 1 Total Fertility Rate Average number of children born to each woman. Worldwide TFR = 2. 8
Demographics of Countries Demographic Transition Model Stages through which a population progresses as the country becomes more industrialized.
Demographics of Countries Demographic Stages Preindustrial High birth and death rate; moderate growth Transitional High birth rate; lowered death rate; rapid growth Industrial Lower birth and death rate; slow growth Postindustrial Very low birth and death rate; slow or zero growth
Demographics of Countries Age Structure Number of males and females at each age in a population Indicates if a population is growing, stable, or shrinking
Demographics of Countries Ex. Nigeria High fertility rate = large base Population growth momentum Explains how the future population is affected by its present age distribution.
Demographics of Countries Ex. United States Tapered bases = less offspring in next generation
Demographics of Countries Ex. Germany Narrow base = shrinking population
Demographics of Countries Population Under Age 15:
Demographics of the U. S. Case-in-Point: US Immigration