
Understanding performance optimisation activities in WLCG Andrea Sciab
Understanding performance: optimisation activities in WLCG Andrea Sciabà on behalf of the WLCG UP team HEPi. X Spring 2017 Workshop 24 -28 April 1
Motivation • So far LHC computing was able to match requirements to resources – An increase of 20%/year possible with “flat” budgets – Only difficulties came from a better than expected machine performance • Experiments could live with some degree of “inefficiency” – – – Inefficiencies in job scheduling Inefficiencies in data access Inefficiencies in storage utilization Inefficiencies in memory and CPU usage Inefficiencies in planning (pre conference peaks) • However, there is an increasing pressure to achieve more with less – Plus the knowledge that Run 4 (aka HL-LHC) will not fit into the current computing model by a large factor (~10 x) 2
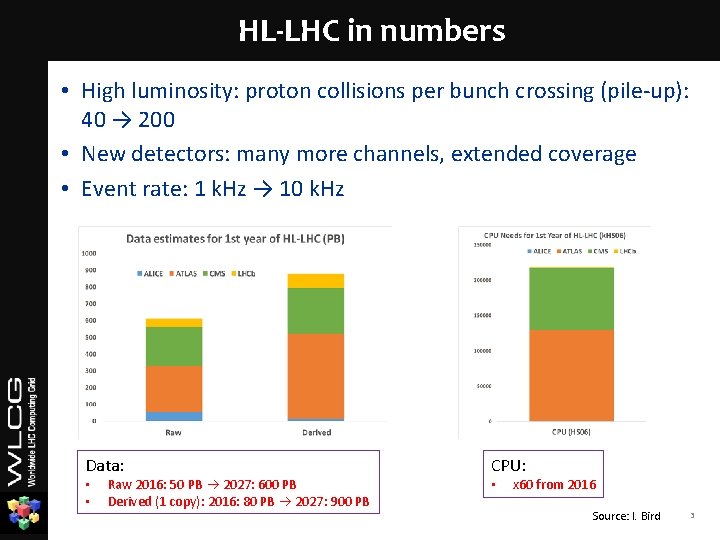
HL-LHC in numbers • High luminosity: proton collisions per bunch crossing (pile-up): 40 → 200 • New detectors: many more channels, extended coverage • Event rate: 1 k. Hz → 10 k. Hz Data: • • Raw 2016: 50 PB 2027: 600 PB Derived (1 copy): 2016: 80 PB 2027: 900 PB CPU: • x 60 from 2016 Source: I. Bird 3
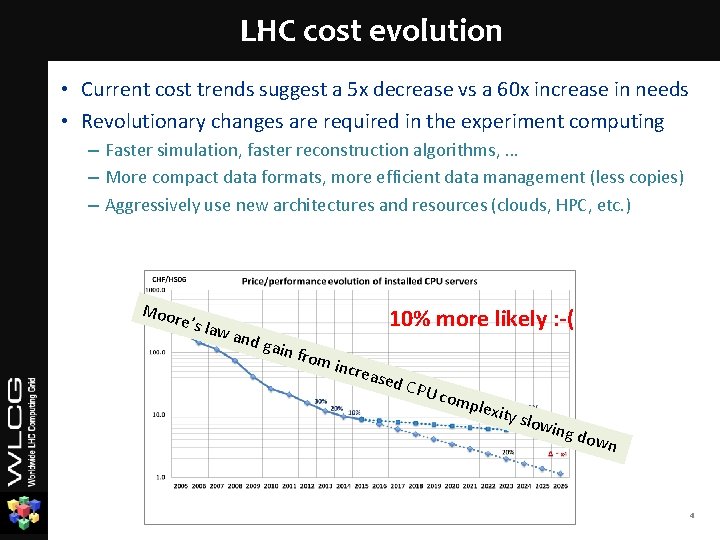
LHC cost evolution • Current cost trends suggest a 5 x decrease vs a 60 x increase in needs • Revolutionary changes are required in the experiment computing – Faster simulation, faster reconstruction algorithms, … – More compact data formats, more efficient data management (less copies) – Aggressively use new architectures and resources (clouds, HPC, etc. ) Moo re’s l a w an d gai 10% more likely : -( n fro m inc rease d CP U co mple xity s l owin g dow n 4
WLCG role in optimisation • Although the biggest reductions in resource needs have to come from changes in the experiment software, WLCG can play an important role • Develop and support optimisation / performance tools – CERN IT contribution to the HEP Software Foundation – Help improving software performance • Investigate the overall computing system efficiency – Identify leading causes of inefficiency in using computing resources – Quantify achievable gains and prioritise effort – Best done using analytics tools • Develop cost models – Understand calculate cost of computing – Find out where the most savings can be achieved • Propose and coordinate projects or prototypes to test new ideas – Important also for the WLCG planning • The UP team (Understanding Performance) contributes to this effort from 2016 – 2. 5 FTEs 5
Overview of current activities • Tracking existing activities – In CERN IT, experiments, HSF, … • Developing memory profiling tools – E. g. FOM tools to detect inefficiencies in memory allocation • Studying experiment workflows – Using jobs meta/logging data from Elastic. Search repositories – Several analyses performed and planned • Leading role in several activities – Organised performance session at the HSF workshop – Started regular meetings in ATLAS on workflow performance – Performance sessions at the WLCG workshops 6
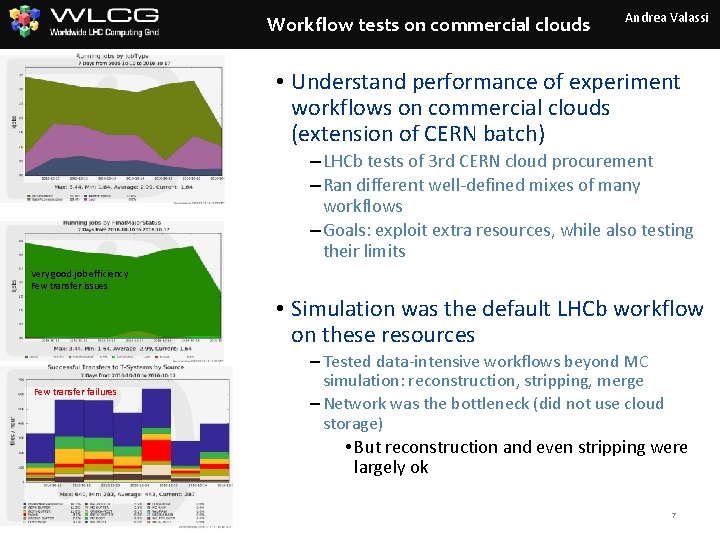
Workflow tests on commercial clouds Andrea Valassi • Understand performance of experiment workflows on commercial clouds (extension of CERN batch) – LHCb tests of 3 rd CERN cloud procurement – Ran different well-defined mixes of many workflows – Goals: exploit extra resources, while also testing their limits Very good job efficiency Few transfer issues • Simulation was the default LHCb workflow on these resources Few transfer failures – Tested data-intensive workflows beyond MC simulation: reconstruction, stripping, merge – Network was the bottleneck (did not use cloud storage) • But reconstruction and even stripping were largely ok 7
Software optimizations/tools – LHCb Andrea Valassi • Contributions to LHCb software activities – Software quality – Validation, regression – Debugging (Valgrind, Helgrind) – Timing and profiling of the code • Main focus in LHCb is the Gaudi. Hive multi-threaded framework – Based on Intel TBB (Threading Building Blocks) – ATLAS undergoing a similar process for Athena (based on Gaudi. Hive) – Challenge specific to LHCb is improving the HLT throughput for Run 3 • Plan to also work on these LHCb software activities with Intel tools – Collaboration with CERN Openlab (Intel VTune Amplifier, icc compiler) • Most of the work with LHCb described here can be applied elsewhere – Tools, compilers and even bits of the software used by others too – It is important to work on real examples and liaise with existing teams 8
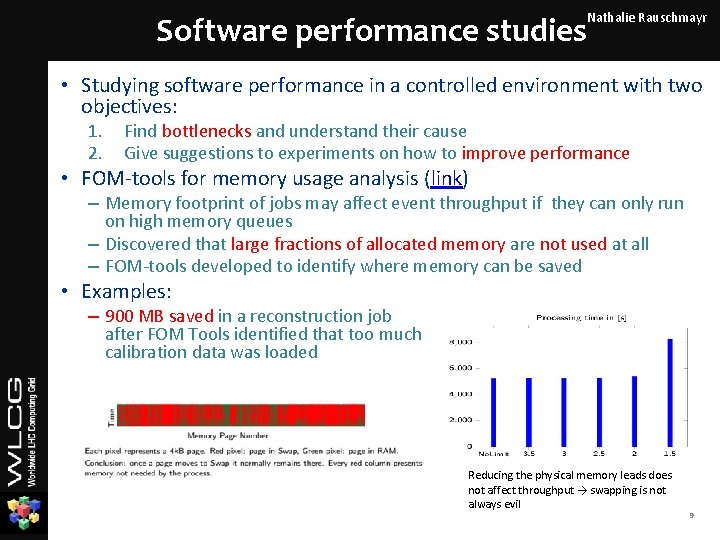
Nathalie Rauschmayr Software performance studies • Studying software performance in a controlled environment with two objectives: 1. 2. Find bottlenecks and understand their cause Give suggestions to experiments on how to improve performance • FOM-tools for memory usage analysis (link) – Memory footprint of jobs may affect event throughput if they can only run on high memory queues – Discovered that large fractions of allocated memory are not used at all – FOM-tools developed to identify where memory can be saved • Examples: – 900 MB saved in a reconstruction job after FOM Tools identified that too much calibration data was loaded Reducing the physical memory leads does not affect throughput → swapping is not always evil 9
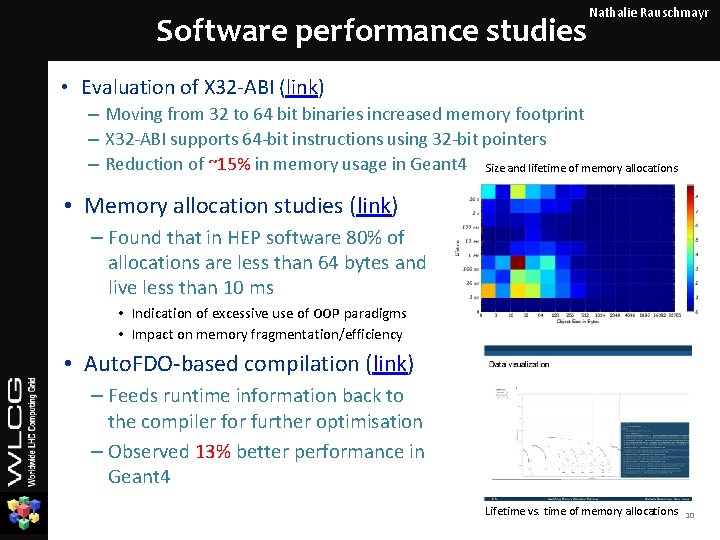
Software performance studies Nathalie Rauschmayr • Evaluation of X 32 -ABI (link) – Moving from 32 to 64 bit binaries increased memory footprint – X 32 -ABI supports 64 -bit instructions using 32 -bit pointers – Reduction of ~15% in memory usage in Geant 4 Size and lifetime of memory allocations • Memory allocation studies (link) – Found that in HEP software 80% of allocations are less than 64 bytes and live less than 10 ms • Indication of excessive use of OOP paradigms • Impact on memory fragmentation/efficiency • Auto. FDO-based compilation (link) – Feeds runtime information back to the compiler for further optimisation – Observed 13% better performance in Geant 4 Lifetime vs. time of memory allocations 10
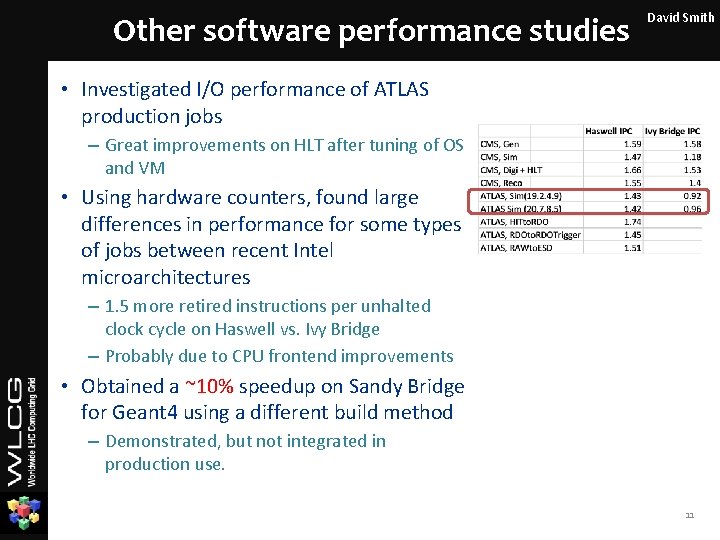
Other software performance studies David Smith • Investigated I/O performance of ATLAS production jobs – Great improvements on HLT after tuning of OS and VM • Using hardware counters, found large differences in performance for some types of jobs between recent Intel microarchitectures – 1. 5 more retired instructions per unhalted clock cycle on Haswell vs. Ivy Bridge – Probably due to CPU frontend improvements • Obtained a ~10% speedup on Sandy Bridge for Geant 4 using a different build method – Demonstrated, but not integrated in production use. 11
Workflow optimisation Andrea Sciabà • Understand how experiments use their CPU resources – What types of jobs are (primarily) run? – How many resources do they require? – How do they behave, signatures, success rates. . ? – Are they “efficient” (i. e. do they waste wall-clock time)? • Understand the behavior of the infrastructure – Can we measure the “speed” of CPUs, or sites, by looking at different types of jobs? Are the results compatible? Can we validate commonly used benchmarks using “real” jobs? • Lead to a metric that is related to what we actually want to do (Process physics data!) 12
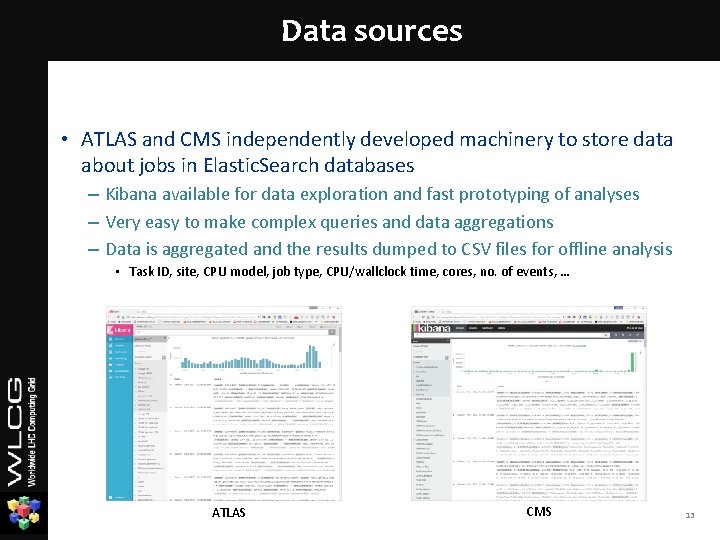
Data sources • ATLAS and CMS independently developed machinery to store data about jobs in Elastic. Search databases – Kibana available for data exploration and fast prototyping of analyses – Very easy to make complex queries and data aggregations – Data is aggregated and the results dumped to CSV files for offline analysis • Task ID, site, CPU model, job type, CPU/wallclock time, cores, no. of events, … ATLAS CMS 13
Passive benchmarking Andrea Sciabà • Goal: explore the possibility to measure the “speed” of CPUs (or the average “speed” of a site) using CPU time consumption of real production jobs • Basic assumptions – The CPU “speed” and the average CPU time/event of a given job are inversely proportional – All jobs in the same Task are comparable • Limitations – Limited information about the worker node: e. g. the CPU model is known, but the SMT status is not, as the nature (virtual vs. physical) of the machine or any overprovisioning, etc. – There is no “absolute scale” for the CPU speed 14
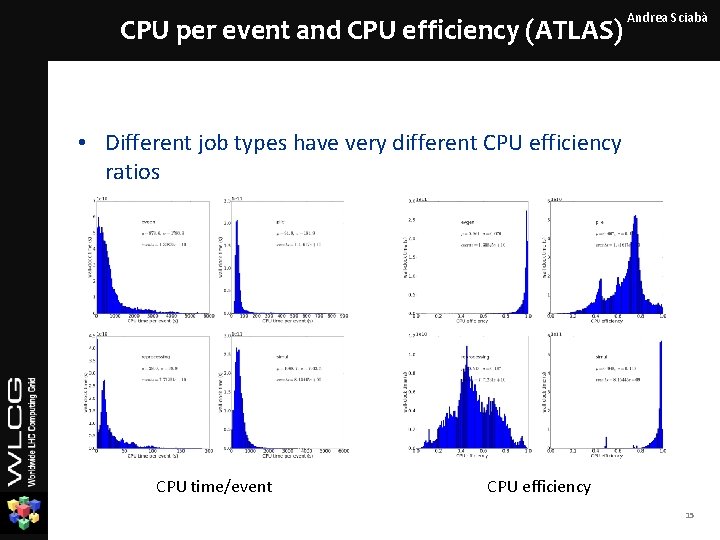
CPU per event and CPU efficiency (ATLAS) Andrea Sciabà • Different job types have very different CPU efficiency ratios CPU time/event CPU efficiency 15
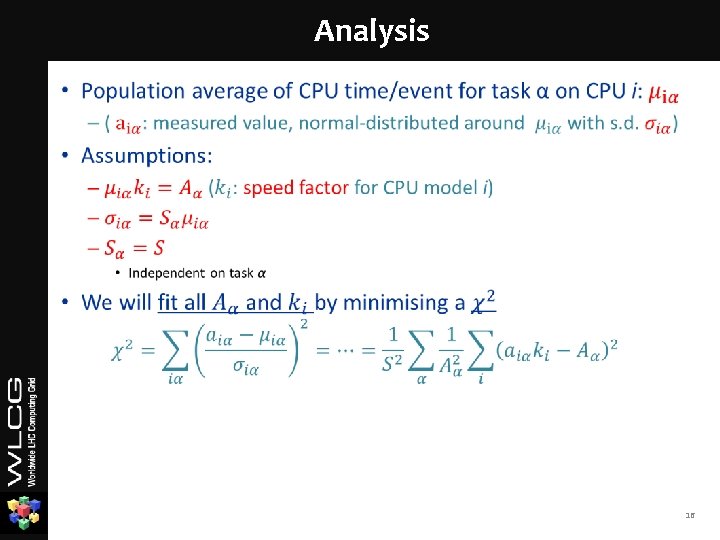
Analysis • 16
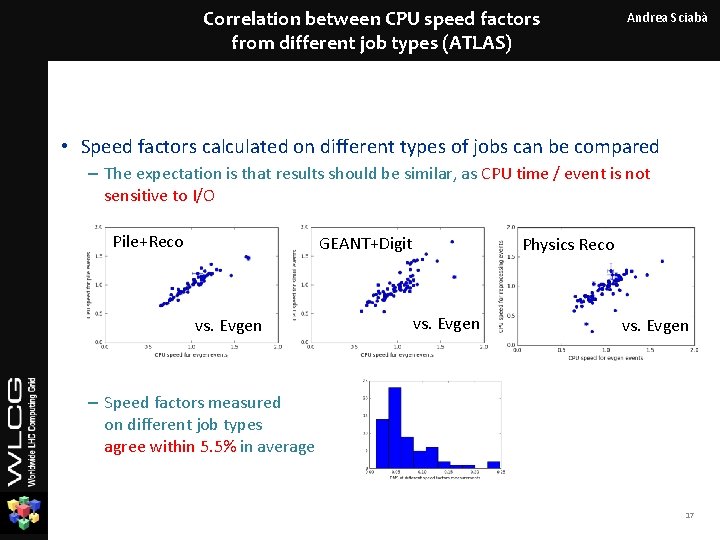
Correlation between CPU speed factors from different job types (ATLAS) Andrea Sciabà • Speed factors calculated on different types of jobs can be compared – The expectation is that results should be similar, as CPU time / event is not sensitive to I/O Pile+Reco GEANT+Digit vs. Evgen Physics Reco vs. Evgen – Speed factors measured on different job types agree within 5. 5% in average 17
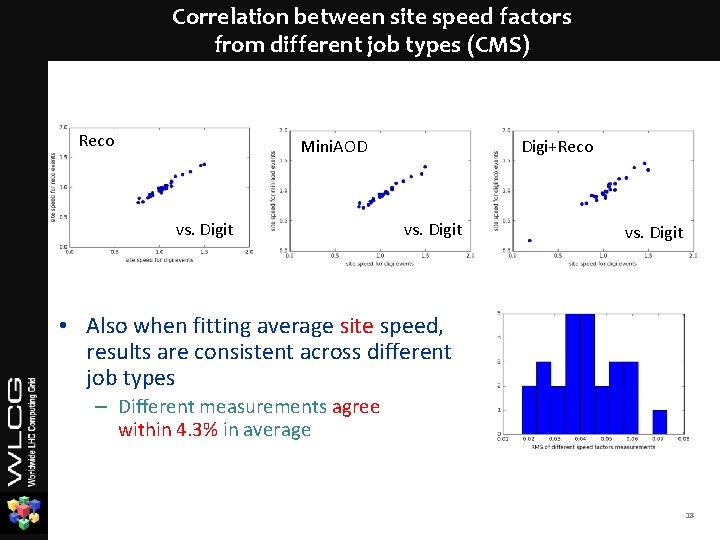
Correlation between site speed factors from different job types (CMS) Reco Mini. AOD vs. Digit Digi+Reco vs. Digit • Also when fitting average site speed, results are consistent across different job types – Different measurements agree within 4. 3% in average 18
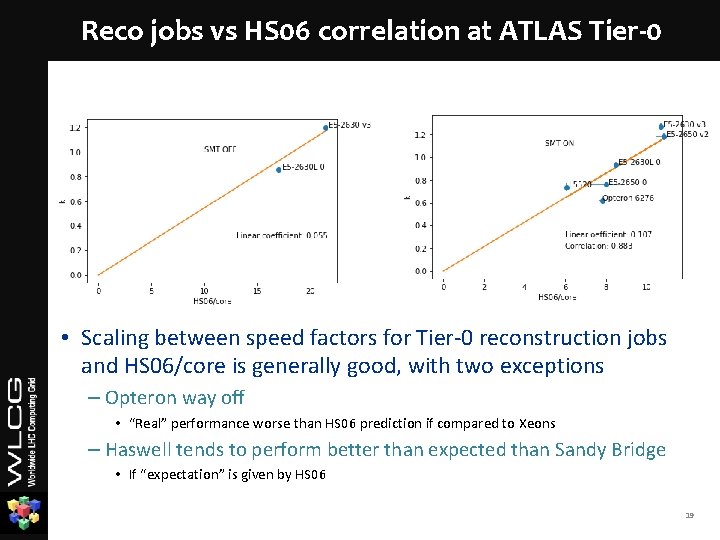
Reco jobs vs HS 06 correlation at ATLAS Tier-0 • Scaling between speed factors for Tier-0 reconstruction jobs and HS 06/core is generally good, with two exceptions – Opteron way off • “Real” performance worse than HS 06 prediction if compared to Xeons – Haswell tends to perform better than expected than Sandy Bridge • If “expectation” is given by HS 06 19
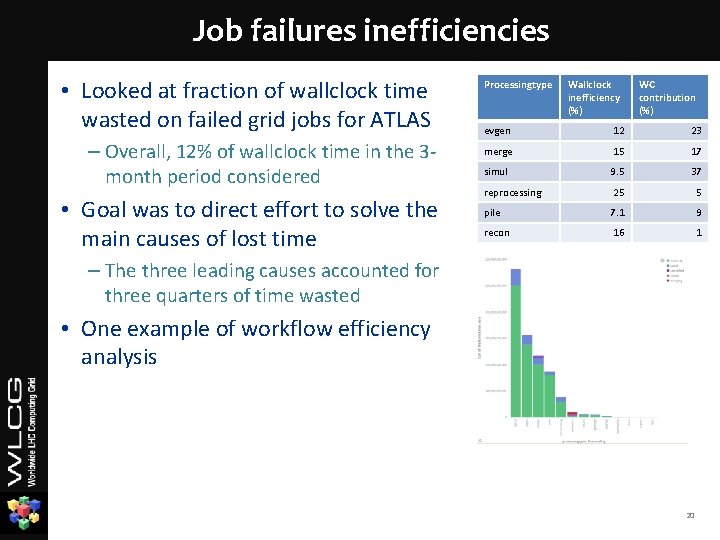
Job failures inefficiencies • Looked at fraction of wallclock time wasted on failed grid jobs for ATLAS – Overall, 12% of wallclock time in the 3 month period considered • Goal was to direct effort to solve the main causes of lost time Processingtype Wallclock inefficiency (%) WC contribution (%) evgen 12 23 merge 15 17 simul 9. 5 37 reprocessing 25 5 pile 7. 1 9 recon 16 1 – The three leading causes accounted for three quarters of time wasted • One example of workflow efficiency analysis 20
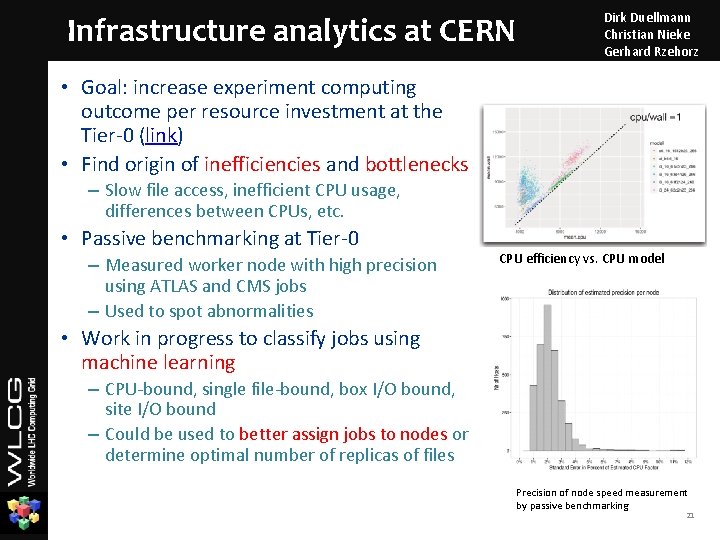
Infrastructure analytics at CERN Dirk Duellmann Christian Nieke Gerhard Rzehorz • Goal: increase experiment computing outcome per resource investment at the Tier-0 (link) • Find origin of inefficiencies and bottlenecks – Slow file access, inefficient CPU usage, differences between CPUs, etc. • Passive benchmarking at Tier-0 – Measured worker node with high precision using ATLAS and CMS jobs – Used to spot abnormalities CPU efficiency vs. CPU model • Work in progress to classify jobs using machine learning – CPU-bound, single file-bound, box I/O bound, site I/O bound – Could be used to better assign jobs to nodes or determine optimal number of replicas of files Precision of node speed measurement by passive benchmarking 21
Conclusions • A much stronger focus in WLCG on increasing the efficiency in using computing resources • Contribute with tools and expertise – Auto. FDO, FOM, Intel compilers, … • Understand how different workflows behave – Improve their classification and generalise across experiments – Getting a lot of momentum inside the experiments • Fully exploit and optimise existing resources – Using infrastructure monitoring, using idle CPU cycles – At the early stages but it can be applied in many places • Prototype new ideas and concepts – Experiments can/should implement what has been shown to work 22
- Slides: 22