Understanding Gel Electrophoresis 182022 1 Overview of topics


 • The 100 bp ladder is")
 4000 3000 2000 1600 2000 bp 1000")


 • The reference (bright) band is 1. 6")


 1500 1200 1000")

 5000 4000 3000")


")


- Slides: 33
Understanding Gel Electrophoresis 1/8/2022 1
Overview of topics covered • Basic Principles • Demonstration of a gel • Ladders as references • Optimizing the separation 1/8/2022 2
Purpose of Gel Electrophoresis Gel electrophoresis separates a mixture of DNA fragments according to size This is accomplished by drawing the DNA fragments through a gel 1/8/2022 3
Basic Principle of Electrophoresis A mixture of DNA molecules becomes organized by size 1/8/2022 4
How does gel electrophoresis separate DNA fragments? • The gel acts as a sieve to filter the DNA fragments • The DNA fragments are naturally negatively charged due to the phosphate backbone • DNA fragments of differing sizes will move though the gel at differing rates • Smaller fragments move faster through the 1/8/2022 gel and larger fragments move slower 5
The Need for an Electric Field • The electrostatic charges set up in the gel act as the “force” • The anode has a relative lack of electrons and has a net positive charge • The cathode is rich in electrons and has a net negative charge • The DNA is loaded in wells near the cathode • The DNA is pulled towards the anode by electric attraction 1/8/2022 6
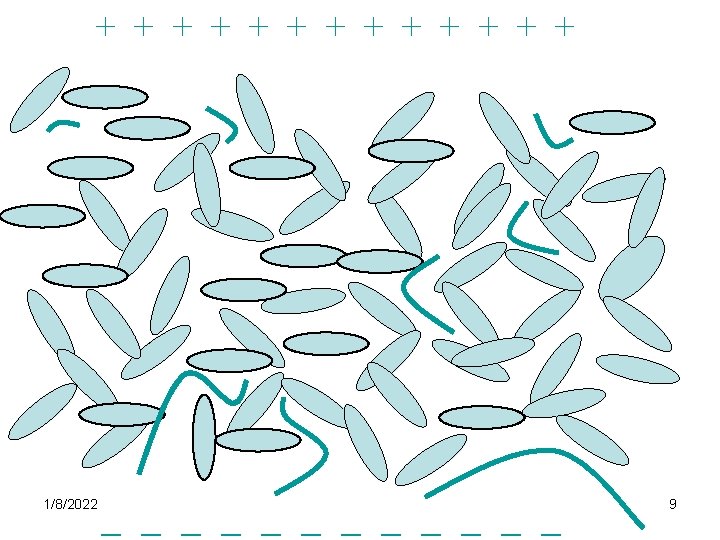
+ + + + + + ++ + + + + DNA is negatively charged and therefore repelled from the negative pole and attracted towards the positive pole 1/8/2022 7 -------- --- ---- -
Size selection in an Agarose Gel • The agarose gel is full of tiny pores which the DNA can slide through. The smaller pieces can easily find a route to the positive terminal. • The larger fragments cannot slide through the pores as easily. • This results in the smaller fragments moving quickly to the positive end of the gel and the larger fragments move much slower and remain close to the negative end of the gel. 1/8/2022 8
A Typical Electrophoresis Gel Setup Negative end - ------ Direction of DNA movement 1/8/2022 Positive end + + + + + 10
A Typical Image of an Agarose Gel Under UV Light Decreasing DNA Size Largest DNA fragments Smallest DNA fragments • The DNA fragments can be visualized using a special dye that specifically binds DNA and fluoresces under illumination with UV light 1/8/2022 11
The Intensity of the Band is Proportional to the Concentration Of DNA • An important point to remember is that the intensity of the band is proportional to the amount of DNA found in the band The upper band has far less DNA when compared to the lower band. The intensity of the bands are proportional to the amount of DNA at that position in the gel 1/8/2022 12
Sizing The Fragments of DNA • The sizes of the various fragments can be identified by including a “ladder” in the gel – A ladder is a mixture of DNA fragments of known size – A ladder is usually run beside the unknown sample so that the sizes of the various DNA fragments in the sample can be identified 1/8/2022 13
Ladder • A ladder is a mixture of DNA fragments of selected sizes • When run in a gel electrophoresis, these fragments will separate into distinct bands that can be used as references • The size of a fragment is always stated as [X] base pairs (bp) • Two common ladders are the 100 bp and the 1 kbp (1000 bp) ladders • Ladders are commercially available and purchased from suppliers 1/8/2022 14
Typical Ladders-100 bp & 1 kbp (1000 bp) • The 100 bp ladder is composed of a mixture of small fragments (100 to 2000 bp) • The 1000 bp ladder is composed of a mixture of larger fragments (500 to 12000 bp) 1/8/2022 15
Sizing a Gel Product Base Pairs (bp) 4000 3000 2000 1600 2000 bp 1000 500 1 Kbp Sample ladder 1/8/2022 16
What is the Size of this Fragment? 4000 3000 2000 1600 1000 500 Sample 1 Kbp ladder 1/8/2022 17
The size of this fragment is… 4000 3000 2000 1600 1000 500 Sample 1 Kbp ladder The fragment is between the 2000 bp and 3000 bp band (in red) 1/8/2022 It is approximately 2500 bp in size 18
Reference Bands in Ladders • Ladder scales are not written on a gel but one is given certain characteristic bands to use as landmarks and are easily identifiable For Example: – In the 100 bp ladder, the 500 bp and the 1000 bp bands are made to stand out – In the 1 kbp (1000 bp) ladder, the 1600 bp band stands out 1/8/2022 19
The 100 bp Ladder • In the 100 bp ladder the reference bands are the 500 and 1000 bp (0. 5 and 1. 0 kbp) • Every band above and below increase by 100 bp 1/8/2022 20
The 1 kbp ladder (1000 bp) • The reference (bright) band is 1. 6 kbp • The band directly above is 2. 0 kbp and increases by 1. 0 kbp as you go up • Below the reference band lies the 1. 0 kbp and the 0. 5 kbp bands 1/8/2022 1. 6 kbp reference band 21
Using A Ladder • To use a ladder for size estimation, one must locate the reference band(s). This is usually one band that is particularly bright. • Once you have found this band know the distribution of fragment sizes of the ladder, one can start estimating the sizes of the samples. 1/8/2022 22
What is the Size of this Fragment? The 100 bp ladder was used Reference 1/8/2022 Ladder 23
The size of the fragment is… Size In Base Pair (bp) 1500 1200 1000 600 500 400 300 200 ≈175 bp 100 1/8/2022 24
What is the Size of these Fragments? The 1 kbp ladder was used 4000 3000 2000 1600 1000 500 1/8/2022 25
The size of the fragments are… Sizes in Base Pairs (bp) 5000 4000 3000 2000 1600 ≈1800 bp 1000 ≈1100 bp 500 1/8/2022 26
What is the Size of these Fragments? The 1 kbp ladder was used 4000 3000 2000 1600 1000 500 1/8/2022 27
The Size of the fragments are… 6000 bp 5000 4000 3000 ≈1800 bp ≈1100 bp ≈800 bp 2000 1600 1000 500 1/8/2022 28
Optimizing Your Gel Electrophoresis One parameter that can be altered to optimize a gel electrophoresis is the agarose concentration in the gel 1/8/2022 29
Background About Agarose • Agarose is a mixture of long chains of saccharides (sugar) • It is extracted from a seaweed and is used in oriental cuisine as a gelling agent for deserts, much like gelatin is used in European cuisine • The greater the agarose concentration, the smaller the pores within the gel • This changes the ease with which the DNA can travel through the gel 1/8/2022 30
Effects of Changing Gel Concentration • By increasing the agarose concentration the smaller DNA fragments will give a clearer separation • By lowering the agarose concentration the larger fragments of DNA will give a clearer separation • By optimizing the % agarose one can clearly separate a mixture of similar DNA fragments 1/8/2022 31
Effect of Percent Agarose on Fragment Separation As stated, the % agarose in the gel affects the size of the pores in a gel, which affects the speed to which DNA can travel through the gel. Higher percent agarose gels resolving smaller base pair fragments better than low percent agarose gels High base pair fragments resolve better in low percent agarose gels 1/8/2022 32
Effect of Percent Agarose on Fragment Separation An example The 1 kbp ladder and the 100 bp ladder were run with 0. 8 and 1. 6 % agarose gels under the same conditions 1/8/2022 1600 bp 1000 bp 500 bp 1600 1000 500 400 bp 300 bp 200 bp 0. 8% Agarose 1. 6% Agarose 80 V – 2 hours Note how the bands have moved further in the low % agarose gel and the higher bp fragment are better defined. The low bp fragments are better defined in the high % agarose gel and are unresolved in the low % agarose gel 33