Understanding Decentralization Findings from East Africa and Latin


 CIFOR IFPRI U. of Colorado CERES")


 Country")


 p Latin America n n p Predominantly male groups, who seem more")


 or Ownershi l(s) or")
 Max (ha) Mean (ha) Std. Dev. Uganda 40 9073 1950")
 Produc t If Harvested or Obtained")


 Predominantl Mixed")
 Predominantly")
- Slides: 30
Understanding Decentralization: Findings from East Africa and Latin America Funded by: USAID, Sustainable Agriculture and Natural Resource Management Program
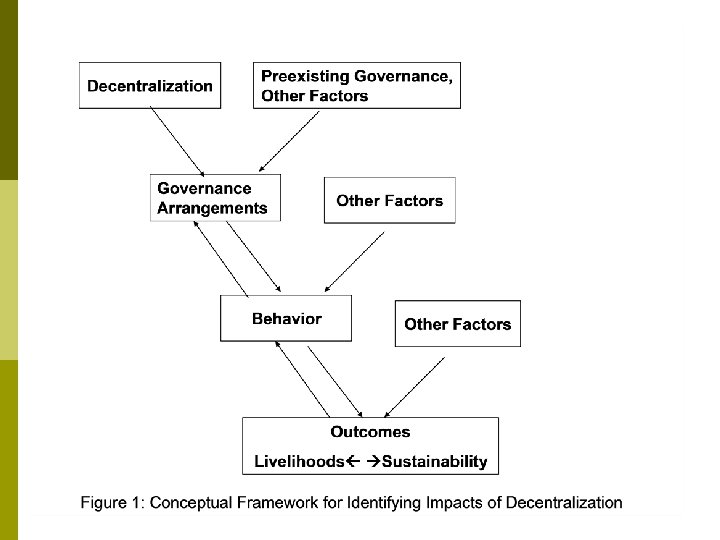
Purpose of the study p Study impact of decentralization reforms on forest sustainability and livelihoods in Uganda, Mexico, Kenya, and Bolivia n p p p All forests studied have elements of common ownership or management Lots of policy advice to “de” centralize to gain the benefits shown to occur in many “self-governed” forests What we call “decentralization” in fact includes a huge range of different policies Need to ask what is being decentralized and to whom?
Partners p p p p Indiana University (lead) CIFOR IFPRI U. of Colorado CERES (Bolivia) KEFRI (Kenya) UNAM (Mexico) UFRIC (Uganda)
Methods p IFRI method n p p p Study commonly managed forests at household and usergroup levels 6 -8 forests in each country Community-level rules and incentives Socio-economic Demographic Behavior Forest ecology
Comparing Local Government Mandates and Attributes: Bolivia p p 1996 – Major forestry decentralization reforms, but national government continued formal ownership Small holders allowed to acquire formal rights, but the process is difficult By 2005, 10% of Bolivia’s managed forests controlled by rural smallholder & indigenous communities – other 90% government & private ownership Municipalities linked to smaller villages & NGOs AND to larger government bureaus, among the few to adopt effective forest policies
Comparing Local Government Mandates and Attributes: Uganda p Some National Forest Reserves were in long-term stable conditions before multiple policy changes n n n 1993 decentralization: forest management decentralized to district governments, with new authority but little money 1995 recentralization: authority recentralized to the Forest Department 2003 decentralization: abolished centralized Forest Department to create the National Forest Authority and the District Forest Service
Uganda continued… p p p Analysis of over-time data shows considerable forest loss in areas affected by decentralization Comparison of forest mensuration data also show steady decline in these forests In contrast, condition of forests unaffected by decentralization has improved due to new rules n Collaborative resource management committee helps make harvesting rules and monitors them
Comparing Local Government Mandates and Attributes: Mexico p p Since 1910 agricultural communities have formal common-property rights 60 -80% of Mexican forested area is community owned National & state governments have policies related to commercial sale from communal lands System that has evolved – more one of comanagement even though communities have formal rights
Differences: p In Mexico the early property rights reforms were the result of a revolution n p In Bolivia, 1996 reform was top down & after much donor pressure and short-term funding n p Over time, states and communities have acquired more authority – some pressure from World Bank but lots of bottom-up demands Bolivian municipalities have limited powers In Uganda, reforms were also top down n Revenue sharing is required but does not reach lowest levels of local government
What can we conclude? p p When looking at rural people’s formal rights to benefit from forest use, Bolivia, Uganda, & Mexico are very different even though all policies are “decentralized” Existing governance arrangements, behavior, and many other factors make a difference!
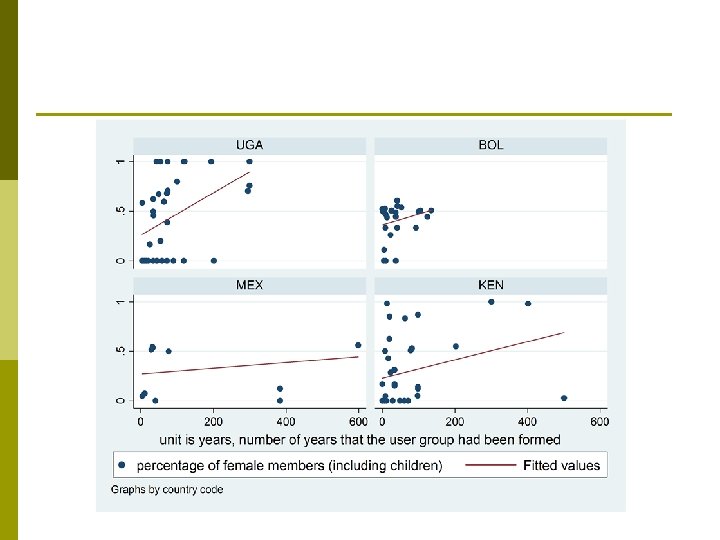
A look at user groups: Gender analysis p p p Split group data into n male dominated (female n<=0. 33) n gender balanced (0. 33<proportion<=0. 66) n female dominated (>0. 66) Assessed relationships between group type and behavior User groups from 56 different sites analyzed
Gender Composition of User Group (unit is % of # of User Groups) Country All Male Group Male Dominate d Female Dominate d All Female Group Uganda 35% 15% 34% 16% Kenya Bolivia 35% 37% 22% 6% Bolivia Kenya 9% 47% 44% 0% Mexico 10% 37% 53% 0%
Can reforms ever make a positive difference? YES! p But not simple panaceas imposed by government and/or donors based on presumed “optimal” models p What kind of policy analysis do we need? p First, a respect for complexity and redundancy p
The challenge of complexity Biological Sciences have accepted the study of complex, nested systems ranging from within a single organism, to a niche, to an ecological system, to a ecological zone, to the globe p Social Sciences & public officials have tended to reject complexity rather than developing scientific language & theories to cope with it. p
Future directions Need better analytical and diagnostic tools of complex, multi-tier systems that need to adapt to change over time p Ask core questions about existing governance structure, property rights, incentives, and behavior before making ANY reform recommendations p n Need to consider indigenous forms of ownership and management, including common ownership
Thank you! Your thoughts and questions are welcome. p Contact information: p Jacqui Bauer Workshop in Political Theory and Policy Analysis Indiana University jacmbaue@indiana. edu
Some results p Property rights n East Africa: Mixed and predominantly female more likely to have harvest rights to trees, bushes, ground leaves p No difference in rights to other products for all three groups p n Latin America No difference among mixed and predominantly males groups for rights to all products p High levels of reporting by user groups for all products p
Governance p East Africa n n n Mixed groups and predominantly male groups seem more likely to undertake monitoring than predominantly female (Labor/time constraint? ) Generally low levels for most management activities, but seems even lower for predominantly female groups (Labor, access to tech) Conflict seems generally lower among predominantly female than mixed and predominantly male groups (okay)
Governance (2) p Latin America n n p Predominantly male groups, who seem more likely to engage in rule making and management than mixed groups. They seem more likely to have conflicts. No female groups B/w EA & LA n n Predominantly female groups: none in LA, some in EA Rule making: higher in LA (central govt vs local vs community)
About user groups p p p Duration: 1400, 2000 35%: 0 -1 Km 55%: 1 -5 Km 5%: 5 -10 Km 5%>10 Size: 10 or less (in Uganda, Kenya or Bolivia) to more than 200 individuals (in both Kenya and Mexico).
The data Country Sites Forests Years revisits Uganda 22 24 1993 -2002 10 Kenya 12 12 1997 -2003 3 Bolivia 18 24 1994 -2001 Mexico 4 7 1997 -2000 56 67
Legal status Other Private Multiple Settleme Types of Individua nt(s) or Ownershi l(s) or Village(s) p Family Country National Govt. Local Govt. Uganda 87% 0% 0% 0% 13% Kenya 100% 0% 0% Bolivia 30% 12% 31% 27% 0% Mexico 0% 43% 14% 43% 0% Average of Four Countries 69% 8% 7% 11% 5%
Forests Country Min. (ha) Max (ha) Mean (ha) Std. Dev. Uganda 40 9073 1950 2632 Kenya 20. 8 14895 4209 5011 Bolivia 46 44900 8756 11600 Mexico 155. 8 1500 515 516 Statistics for all countries 20. 8 44900 3848 6576
User Rights for Forest Products (% of user-groups) Produc t If Harvested or Obtained Does not have right to Has right to harvest this product If Not Harvested or Obtained Has right to harvest this product Does not have right to harvest this product Trees 59% 33% 0% 8% Bushes 45% 28% 18% 9% Grasses 53% 27% 9% 11% 27% 18% 41% 14% 28% 20% 38% 14% Water 86% 1% 10% 3% Wildlife 30% 34% 6% 30% On ground leaves Climbin g leaves
Property rights—East Africa (percentage of groups in each category reporting they have a right to harvest) Rights to harvest Predominantly Mixed Male Predominantly Total Female Trees 37. 50 50. 00* 64. 29* 47. 06 Bushes 39. 58 70. 59* 64. 00* 52. 22 Grass 47. 92 61. 11 52. 17 51. 69 Ground leaves 48. 84 75. 00* 76. 19* 61. 25 Climbing leaves Water 52. 17 62. 50 69. 57 58. 82 98. 08 100. 00 95. 65 97. 73 Wildlife 23. 08 33. 33 0. 00 19. 54 *=significantly higher than other group(s)
Property rights—Latin America (percentage of groups in each category reporting they have a right to harvest) Right to harvest Predominantly Male Mixed Total Trees 85. 71 92. 59 91. 18 Bushes 100. 00 95. 45 96. 30 Grass 100. 00 88. 00 90. 32 Ground leaves 100. 00 94. 12 96. 45 Climbing leaves 100. 00 94. 44 95. 65 Water 100. 00 91. 67 93. 33 Wildlife 83. 33 87. 50 86. 67
Governance--Africa (percentage of groups in each category reporting they have certain practices) Predominantl Mixed y Male Predominantl Total y Female Rule making 12. 07 19. 05 6. 67 11. 93 Monitoring & Sanctioning 15. 52* 28. 57* 0. 00 13. 89 Leadership 16. 95 9. 52 17. 86 15. 74 Management 13. 33 9. 52 13. 33 12. 61 Other 25. 00 improvement s Technologies 23. 33 28. 58 10. 00 21. 62 23. 81 6. 67 18. 92 Conflicts 30. 00 17. 24 30. 84 37. 93
Governance—Latin America (percentage of groups in each category reporting they have certain practices) Predominantly Male Mixed Total Rule making 100. 00* 60. 00 70. 83 Monitoring & Sanctioning 53. 85 34. 29 39. 58 Leadership 38. 46 25. 00 28. 57 Management 84. 62* 52. 63 60. 78 Other improvements 23. 08 28. 95 27. 45 Technologies 38. 46 31. 58 33. 33 Conflicts 70. 00* 37. 84 44. 68