Understanding and mapping the changing social geography of


- Slides: 34
Understanding and mapping the changing social geography of our cities Dr Dan Vickers, Social and Spatial Inequalities Group, Department of Geography, University of Sheffield shef. ac. uk/sasi
Contents • Social Geography of the City: Examining the facts • Bringing the facts to life • Understanding the city 1/9/2022 © The University of Sheffield
Social Geography of the City: Examining the facts
1/9/2022 © The University of Sheffield
1/9/2022 © The University of Sheffield
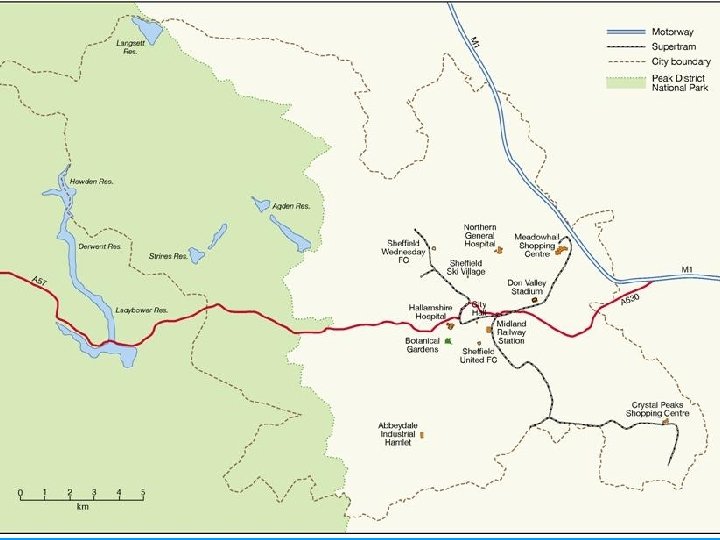
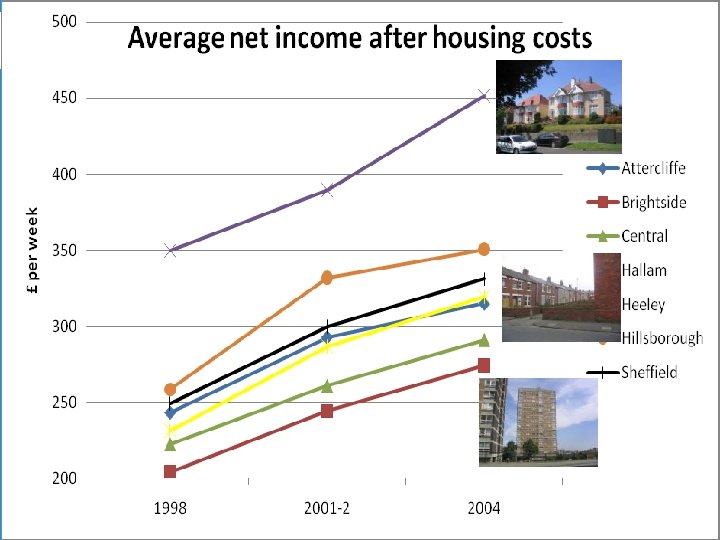
Maps and graphs taken from: A Tale of Two Cities: The Sheffield Project Available Online: shef. ac. uk/sasi 1/9/2022 © The University of Sheffield
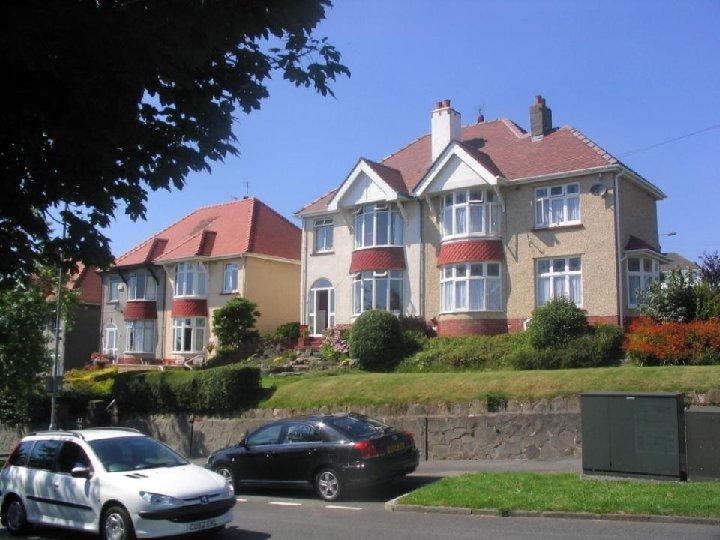
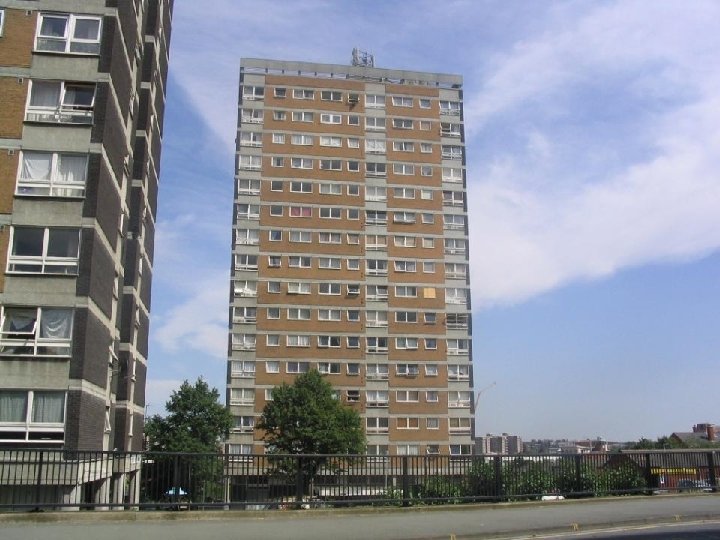
Breadline poverty in Sheffield Neighbourhoods in 2001 Poverty and Wealth
Index of Multiple Deprivation 2007
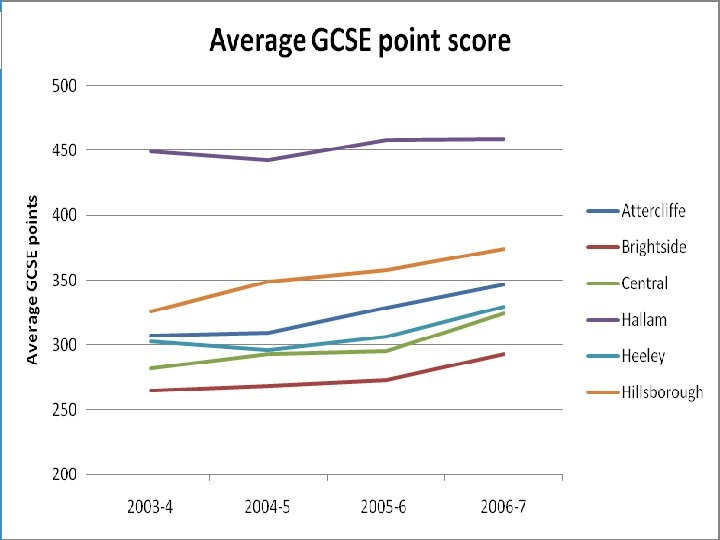
Average KS 1 score 2006– 2007
Life expectancy 1997– 2001, all people
Low birth weight per 1, 000 live births 2002– 2006
Average number of decayed, missing or filled teeth in children aged 5 yrs 2003– 2004
Bringing the facts to life
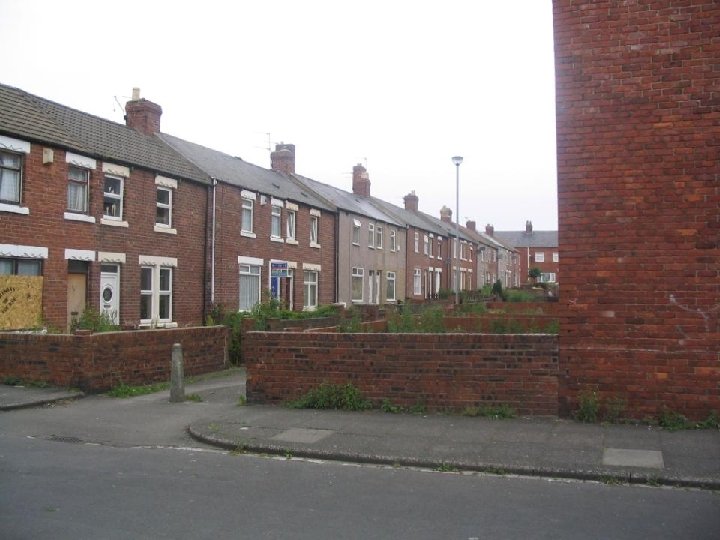
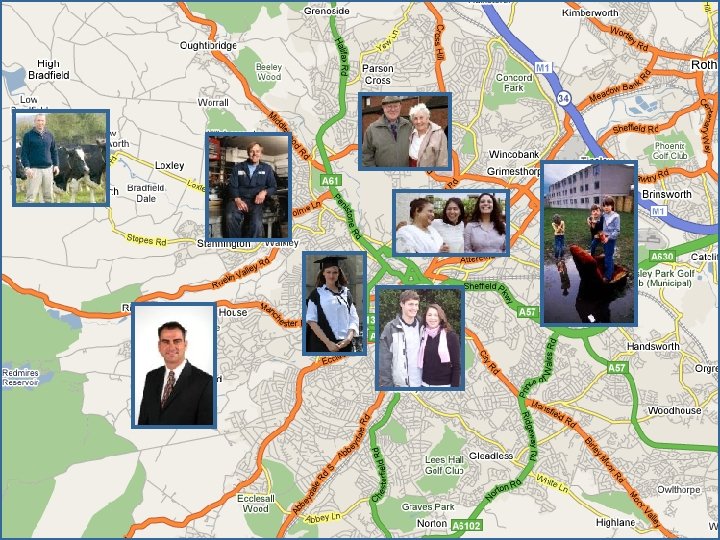
Sheffield: Who Lives Where?
Breadline poverty in Sheffield Neighbourhoods in 2001 Poverty and Wealth
Understanding the city
1/9/2022 © The University of Sheffield
National Statistics Output Area Classification: areaclassification. org. uk
1: Blue Collar Communities 1/9/2022 © The University of Sheffield
2: City Living 1/9/2022 © The University of Sheffield
3: Countryside 1/9/2022 © The University of Sheffield
4: Prospering Suburbs 1/9/2022 © The University of Sheffield
5: Constrained by Circumstances 1/9/2022 © The University of Sheffield
6: Typical Traits 1/9/2022 © The University of Sheffield
7: Multicultural 1/9/2022 © The University of Sheffield