
Uncertainty Limits for an AircraftBased Runway Friction Assessment
Uncertainty Limits for an Aircraft-Based Runway Friction Assessment Method by Angela Campbell, Ph. D. and Andrew Cheng, Ph. D. Presented to: ICRAT By: Angela Campbell, Ph. D. Date: June 21, 2016 The findings and conclusions in this paper are those of the author(s) and do not necessarily represent the views of the FAA Federal Aviation Administration
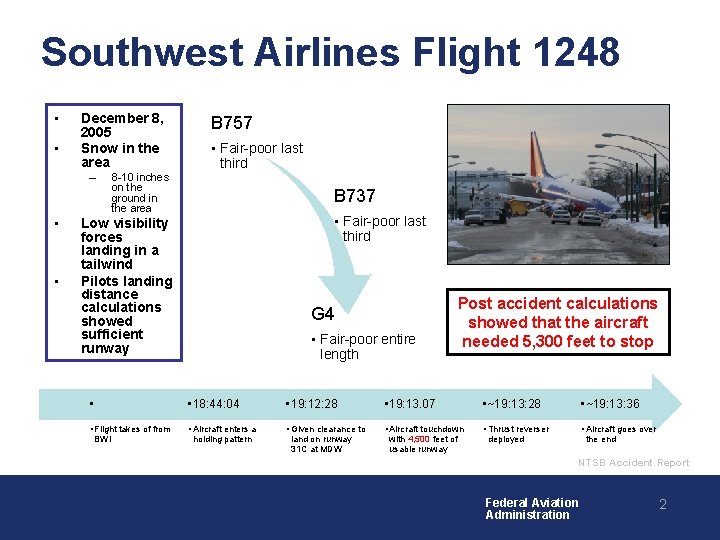
Southwest Airlines Flight 1248 • • December 8, 2005 Snow in the area – • • 8 -10 inches on the ground in the area B 757 • Fair-poor last third B 737 • Fair-poor last third Low visibility forces landing in a tailwind Pilots landing distance calculations showed sufficient runway • • Flight takes of from BWI G 4 • Fair-poor entire length Post accident calculations showed that the aircraft needed 5, 300 feet to stop • 18: 44: 04 • 19: 12: 28 • 19: 13. 07 • ~19: 13: 28 • ~19: 13: 36 • Aircraft enters a • Given clearance to • Aircraft touchdown • Thrust reverser • Aircraft goes over holding pattern land on runway 31 C at MDW with 4, 500 feet of usable runway deployed the end NTSB Accident Report Federal Aviation Administration 2
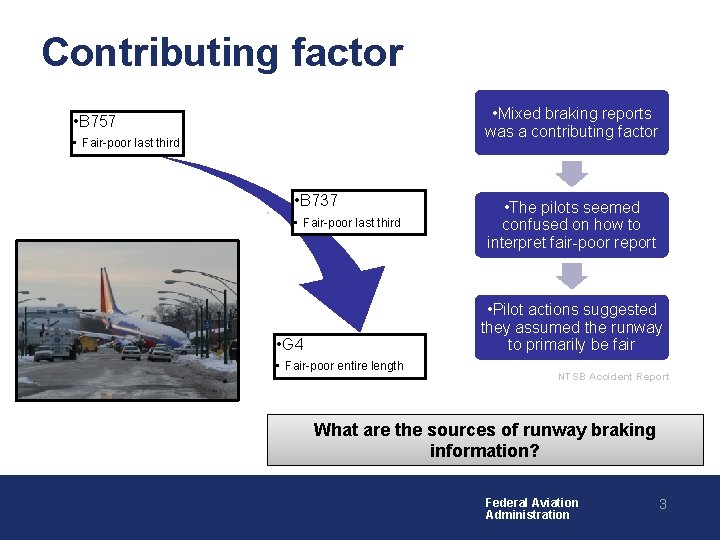
Contributing factor • Mixed braking reports was a contributing factor • B 757 • Fair-poor last third • B 737 • Fair-poor last third • The pilots seemed confused on how to interpret fair-poor report • Pilot actions suggested they assumed the runway to primarily be fair • G 4 • Fair-poor entire length NTSB Accident Report What are the sources of runway braking information? Federal Aviation Administration 3
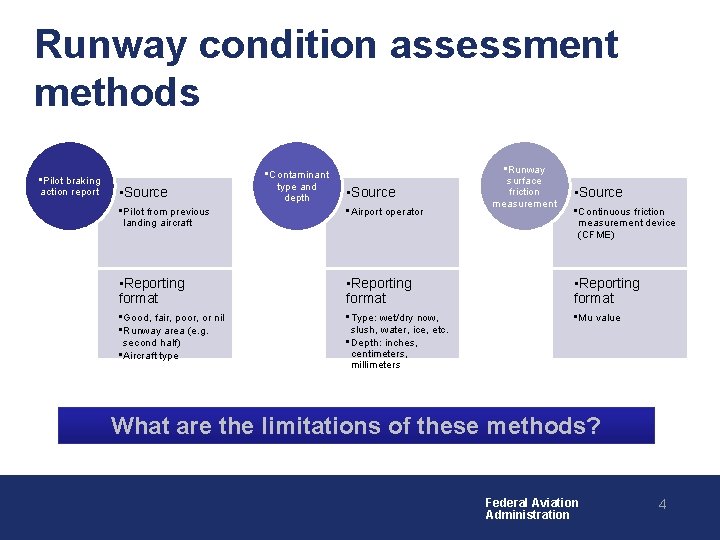
Runway condition assessment methods • Pilot braking action report • Source • Contaminant type and depth • Source • Runway surface friction measurement • Source • Pilot from previous landing aircraft • Airport operator • Continuous friction measurement device (CFME) • Reporting format • Good, fair, poor, or nil • Runway area (e. g. second half) • Aircraft type • Type: wet/dry now, slush, water, ice, etc. • Depth: inches, centimeters, millimeters • Mu value What are the limitations of these methods? Federal Aviation Administration 4
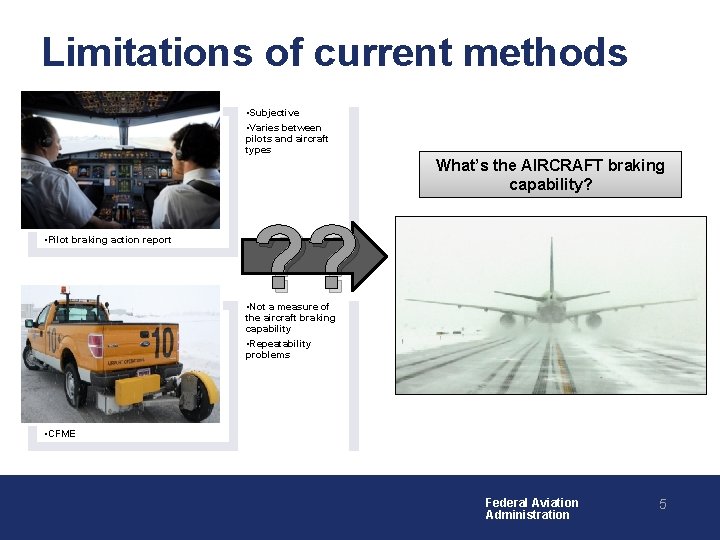
Limitations of current methods • Subjective • Varies between pilots and aircraft types What’s the AIRCRAFT braking capability? • Pilot braking action report ? ? • Not a measure of the aircraft braking capability • Repeatability problems • CFME Federal Aviation Administration 5
Are the limitations of current runway condition reporting methods a continuing problem? YES! • Runway excursions, abnormal runway contact, and runway undershoot/overshoot are the 3 rd leading cause of fatal commercial aviation accidents • FSF showed that ineffective braking caused by runway contamination is the third leading cause of runway excursion events – A contributing factor is a lack of timely, accurate information on runway friction conditions • NTSB has made recommendations for addressing this issue Federal Aviation Administration 6
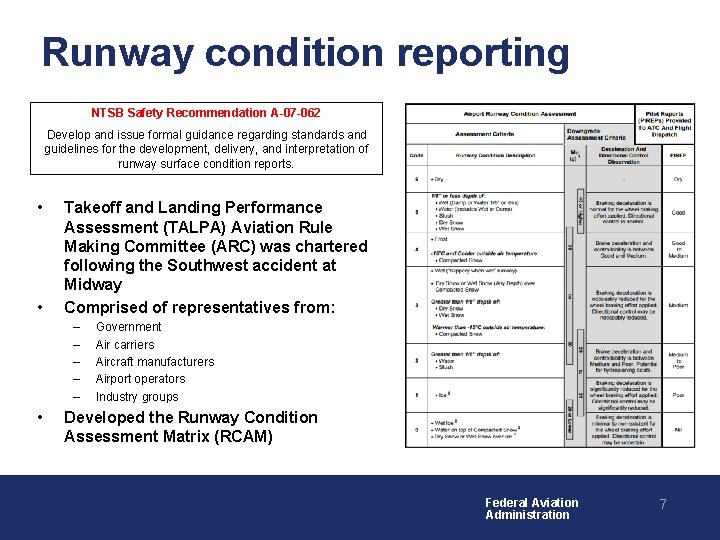
Runway condition reporting NTSB Safety Recommendation A-07 -062 Develop and issue formal guidance regarding standards and guidelines for the development, delivery, and interpretation of runway surface condition reports. • • Takeoff and Landing Performance Assessment (TALPA) Aviation Rule Making Committee (ARC) was chartered following the Southwest accident at Midway Comprised of representatives from: – – – • Government Air carriers Aircraft manufacturers Airport operators Industry groups Developed the Runway Condition Assessment Matrix (RCAM) Federal Aviation Administration 7
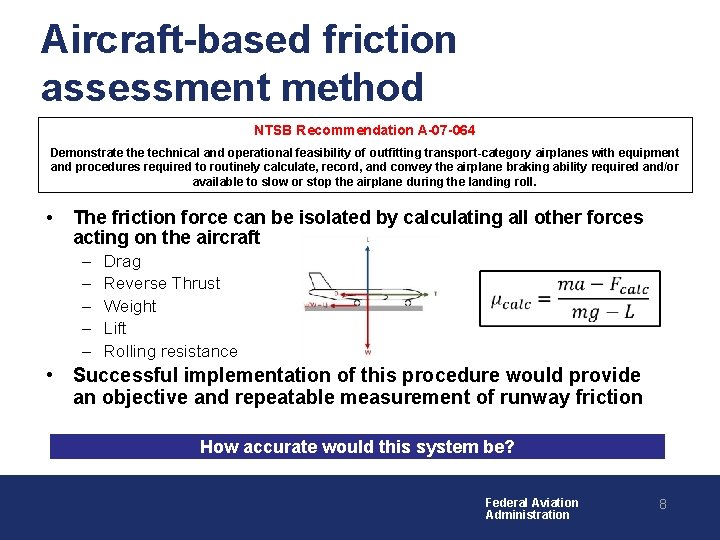
Aircraft-based friction assessment method NTSB Recommendation A-07 -064 Demonstrate the technical and operational feasibility of outfitting transport-category airplanes with equipment and procedures required to routinely calculate, record, and convey the airplane braking ability required and/or available to slow or stop the airplane during the landing roll. • The friction force can be isolated by calculating all other forces acting on the aircraft – – – Drag Reverse Thrust Weight Lift Rolling resistance • • Successful implementation of this procedure would provide an objective and repeatable measurement of runway friction How accurate would this system be? Federal Aviation Administration 8
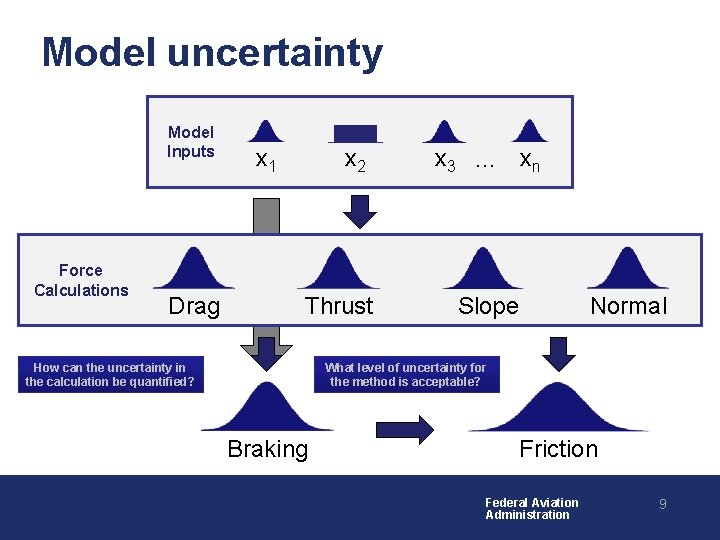
Model uncertainty Model Inputs Force Calculations Drag x 1 x 2 Thrust How can the uncertainty in the calculation be quantified? x 3 … xn Slope Normal What level of uncertainty for the method is acceptable? Braking Friction Federal Aviation Administration 9
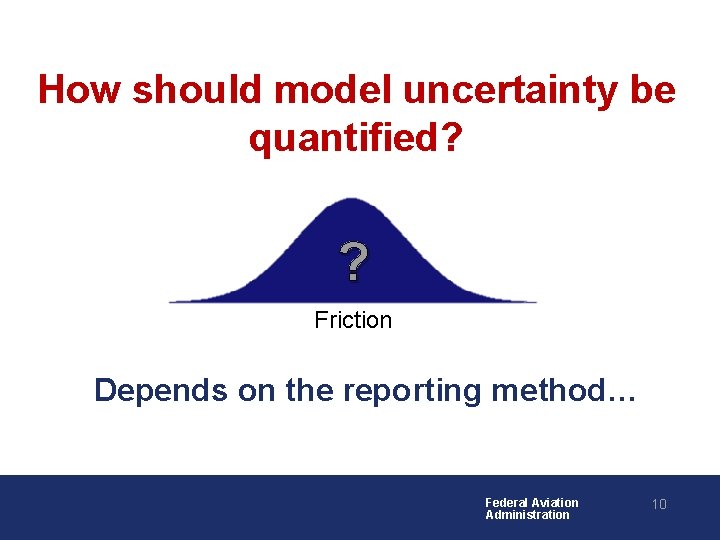
How should model uncertainty be quantified? ? Friction Depends on the reporting method… Federal Aviation Administration 10
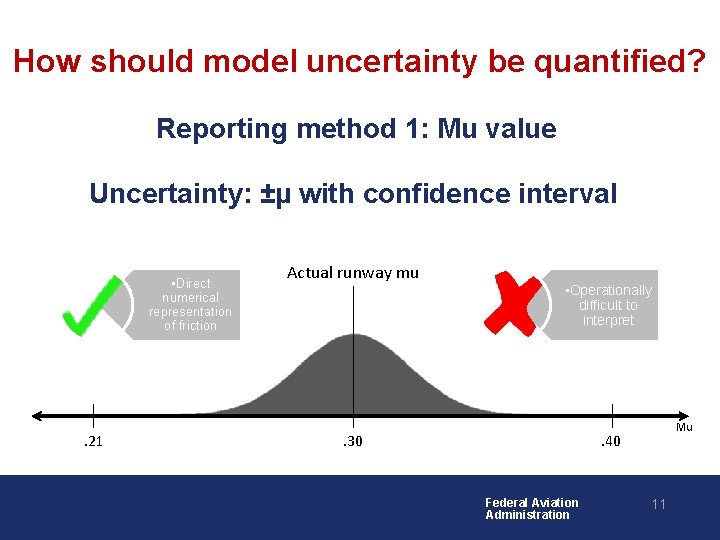
How should model uncertainty be quantified? Reporting method 1: Mu value Uncertainty: ±µ with confidence interval • Direct numerical representation of friction . 21 Actual runway mu • Operationally difficult to interpret Mu . 40 . 30 Federal Aviation Administration 11
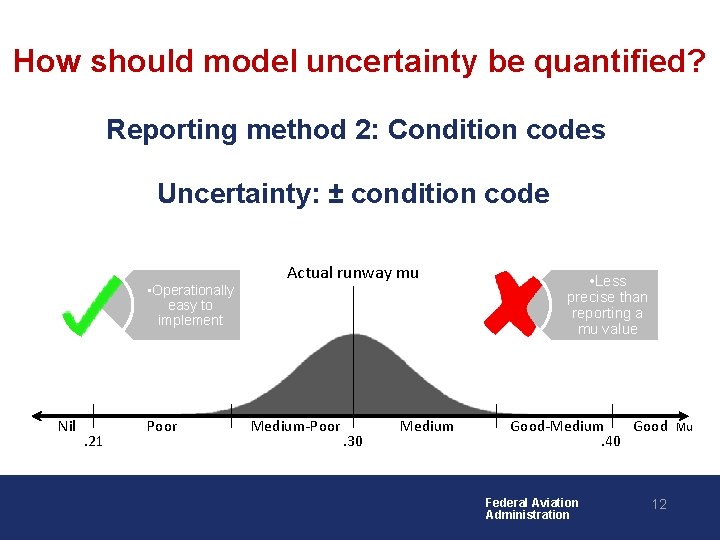
How should model uncertainty be quantified? Reporting method 2: Condition codes Uncertainty: ± condition code • Operationally easy to implement Nil . 21 Poor Actual runway mu Medium-Poor . 30 Medium • Less precise than reporting a mu value Good-Medium Good. 40 Federal Aviation Administration 12 Mu
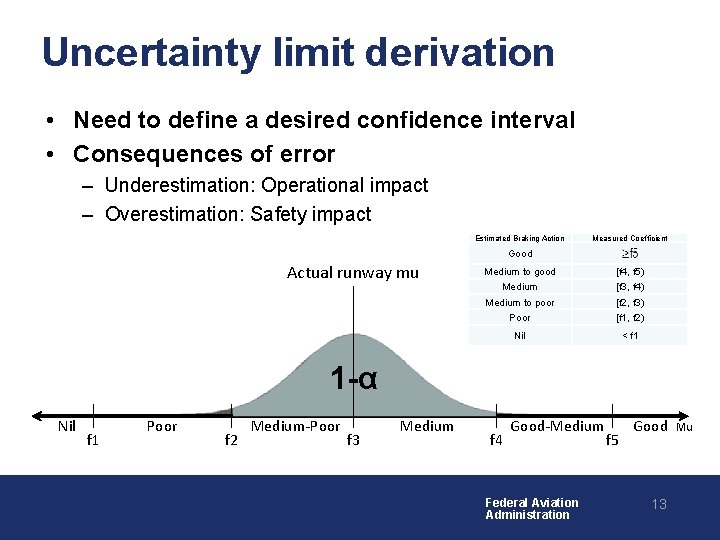
Uncertainty limit derivation • Need to define a desired confidence interval • Consequences of error – Underestimation: Operational impact – Overestimation: Safety impact Estimated Braking Action Measured Coefficient Good Actual runway mu Medium to good [f 4, f 5) Medium [f 3, f 4) Medium to poor [f 2, f 3) Poor [f 1, f 2) Nil < f 1 1 -α Nil f 1 Poor f 2 Medium-Poor f 3 Medium f 4 Good-Medium Federal Aviation Administration f 5 Good 13 Mu
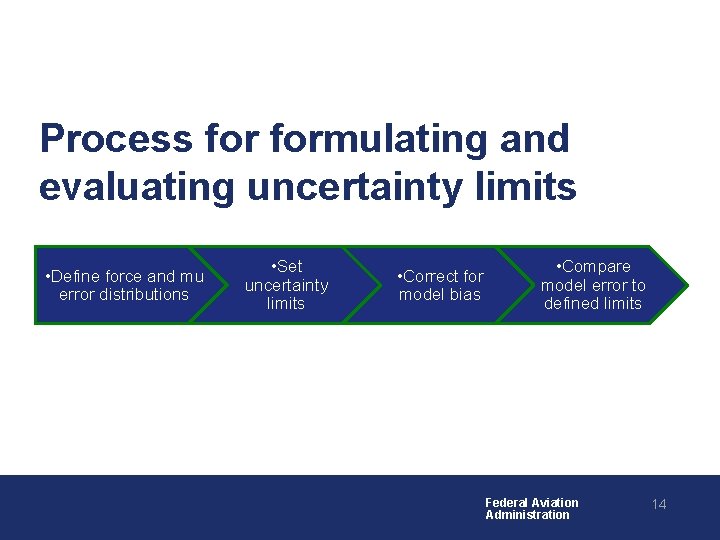
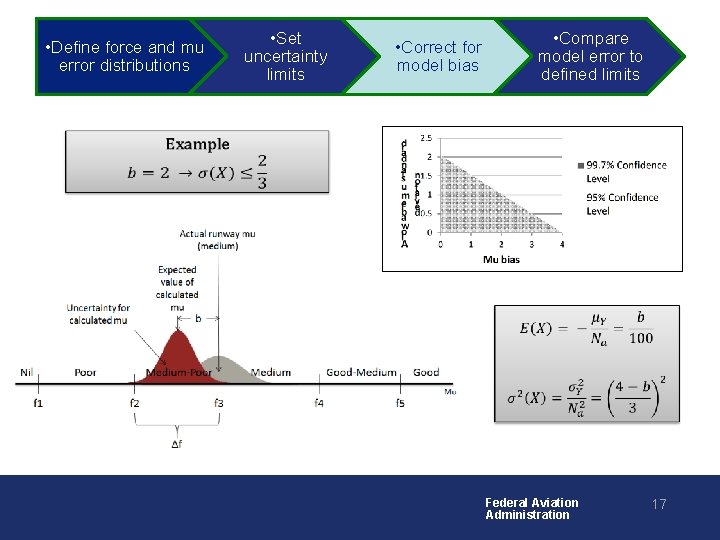
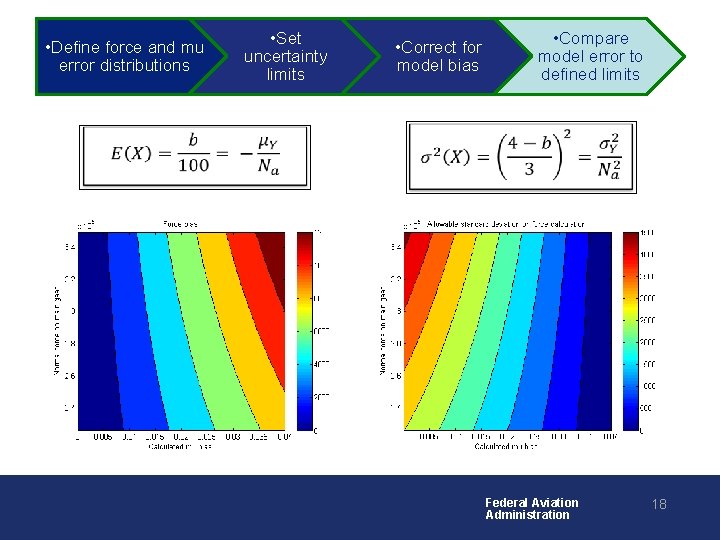
Process formulating and evaluating uncertainty limits • Define force and mu error distributions • Set uncertainty limits • Correct for model bias • Compare model error to defined limits Federal Aviation Administration 14
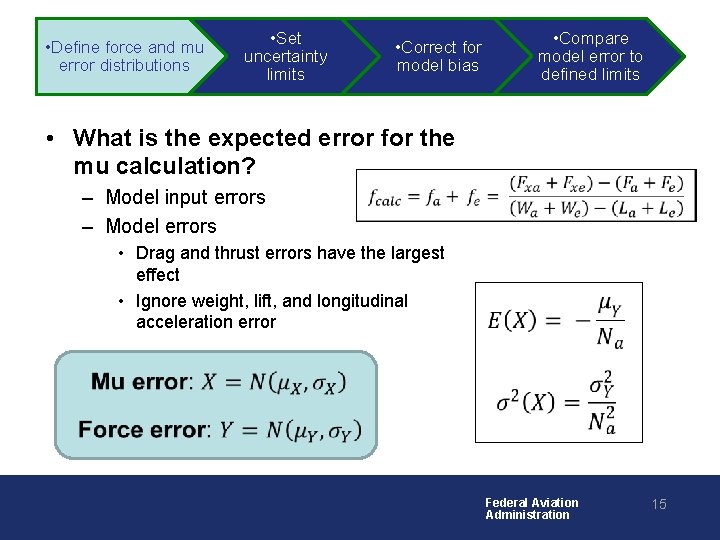
• Define force and mu error distributions • Set uncertainty limits • Compare model error to defined limits • Correct for model bias • What is the expected error for the mu calculation? • – Model input errors – Model errors • Drag and thrust errors have the largest effect • Ignore weight, lift, and longitudinal acceleration error • • Federal Aviation Administration 15
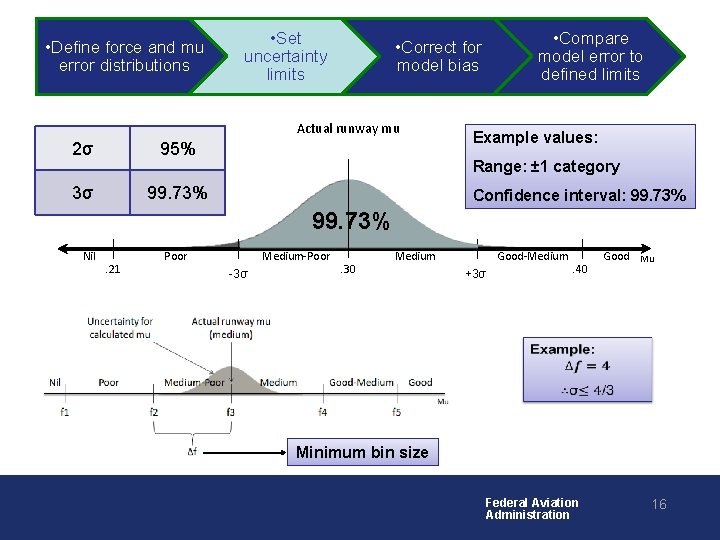
• Define force and mu error distributions • Set uncertainty limits Actual runway mu 2σ 95% 3σ 99. 73% • Compare model error to defined limits • Correct for model bias Example values: Range: ± 1 category Confidence interval: 99. 73% Nil . 21 Poor Medium-Poor -3σ . 30 Medium Good-Medium +3σ . 40 Good Mu • Minimum bin size Federal Aviation Administration 16
• Define force and mu error distributions • Set uncertainty limits • Compare model error to defined limits • Correct for model bias • • Federal Aviation Administration 17
• Define force and mu error distributions • • Set uncertainty limits • Correct for model bias • Compare model error to defined limits • Federal Aviation Administration 18
Example Analysis • Develop model • Validate model • Define the uncertainty limits • Satisfy the uncertainty limits Federal Aviation Administration 19
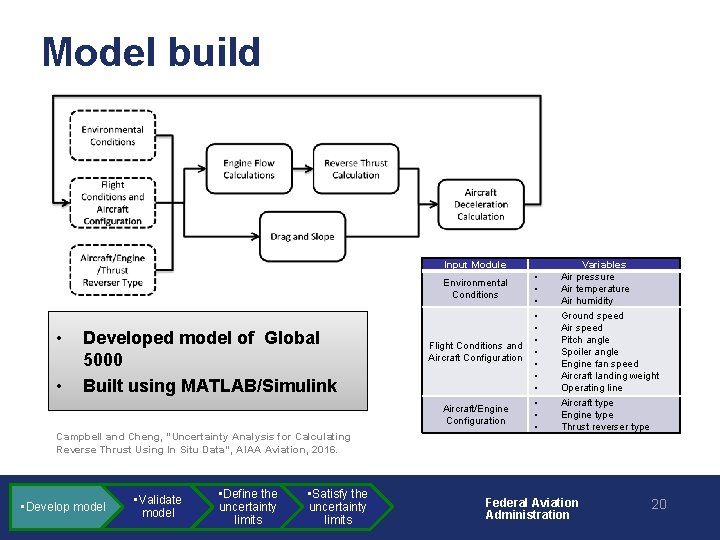
Model build Input Module Environmental Conditions • • Developed model of Global 5000 Built using MATLAB/Simulink Flight Conditions and Aircraft Configuration Aircraft/Engine Configuration Campbell and Cheng, “Uncertainty Analysis for Calculating Reverse Thrust Using In Situ Data”, AIAA Aviation, 2016. • Develop model • Validate model • Define the uncertainty limits • Satisfy the uncertainty limits • • • • Variables Air pressure Air temperature Air humidity Ground speed Air speed Pitch angle Spoiler angle Engine fan speed Aircraft landing weight Operating line Aircraft type Engine type Thrust reverser type Federal Aviation Administration 20
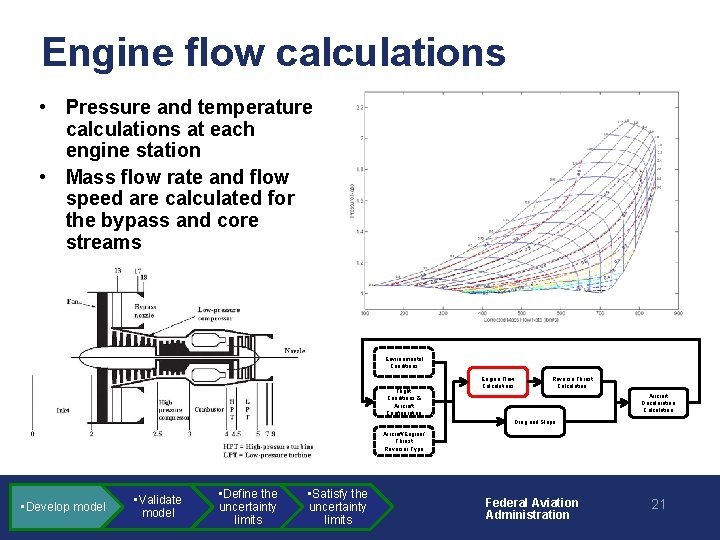
Engine flow calculations • Pressure and temperature calculations at each engine station • Mass flow rate and flow speed are calculated for the bypass and core streams Environmental Conditions Flight Conditions & Aircraft Configuration Engine Flow Calculations Reverse Thrust Calculation Aircraft Deceleration Calculation Drag and Slope Aircraft/Engine/ Thrust Reverser Type • Develop model • Validate model • Define the uncertainty limits • Satisfy the uncertainty limits Federal Aviation Administration 21
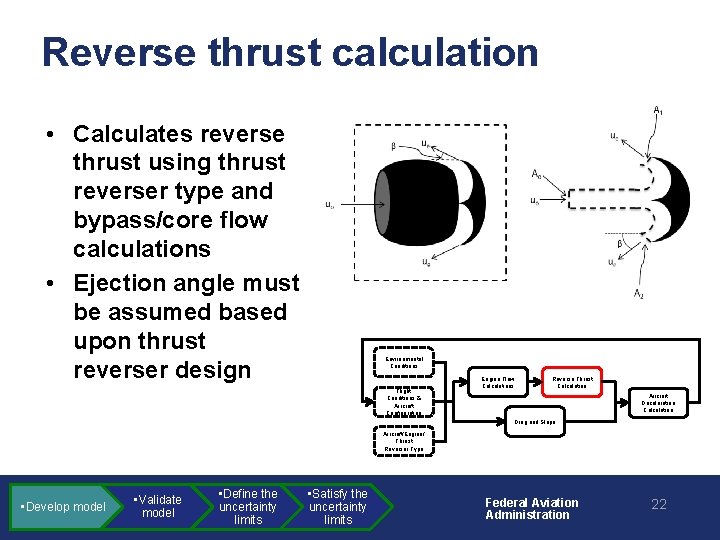
Reverse thrust calculation • Calculates reverse thrust using thrust reverser type and bypass/core flow calculations • Ejection angle must be assumed based upon thrust reverser design Environmental Conditions Flight Conditions & Aircraft Configuration Engine Flow Calculations Reverse Thrust Calculation Aircraft Deceleration Calculation Drag and Slope Aircraft/Engine/ Thrust Reverser Type • Develop model • Validate model • Define the uncertainty limits • Satisfy the uncertainty limits Federal Aviation Administration 22
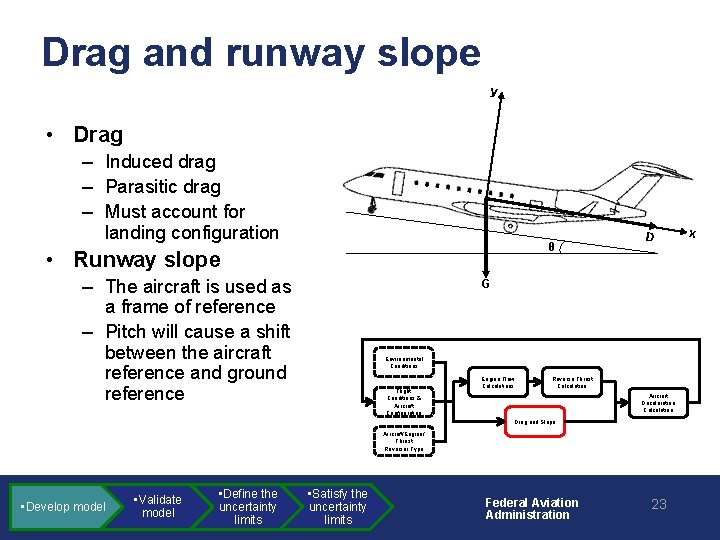
Drag and runway slope y • Drag – Induced drag – Parasitic drag – Must account for landing configuration θ • Runway slope – The aircraft is used as a frame of reference – Pitch will cause a shift between the aircraft reference and ground reference D G Environmental Conditions Flight Conditions & Aircraft Configuration Engine Flow Calculations Reverse Thrust Calculation Aircraft Deceleration Calculation Drag and Slope Aircraft/Engine/ Thrust Reverser Type • Develop model • Validate model • Define the uncertainty limits • Satisfy the uncertainty limits Federal Aviation Administration 23 x
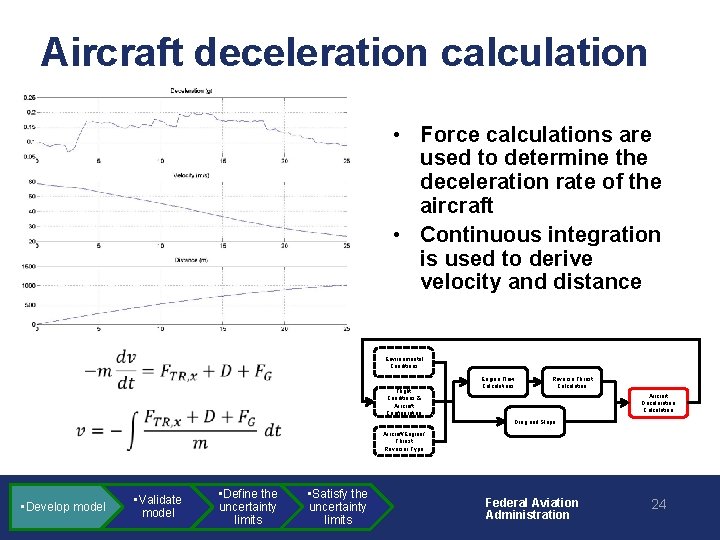
Aircraft deceleration calculation • Force calculations are used to determine the deceleration rate of the aircraft • Continuous integration is used to derive velocity and distance • Environmental Conditions Flight Conditions & Aircraft Configuration • • Develop model Engine Flow Calculations Reverse Thrust Calculation Aircraft Deceleration Calculation Drag and Slope Aircraft/Engine/ Thrust Reverser Type • Validate model • Define the uncertainty limits • Satisfy the uncertainty limits Federal Aviation Administration 24
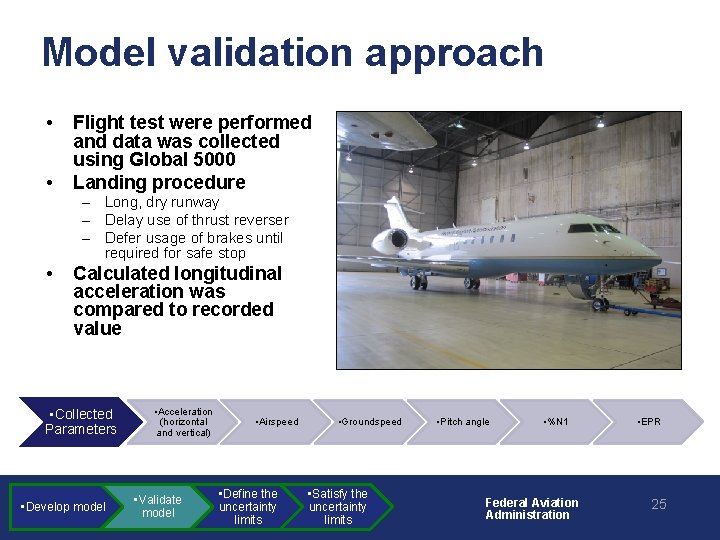
Model validation approach • • Flight test were performed and data was collected using Global 5000 Landing procedure – Long, dry runway – Delay use of thrust reverser – Defer usage of brakes until required for safe stop • Calculated longitudinal acceleration was compared to recorded value • Collected Parameters • Develop model • Acceleration (horizontal and vertical) • Validate model • Airspeed • Define the uncertainty limits • Groundspeed • Satisfy the uncertainty limits • Pitch angle • %N 1 Federal Aviation Administration • EPR 25
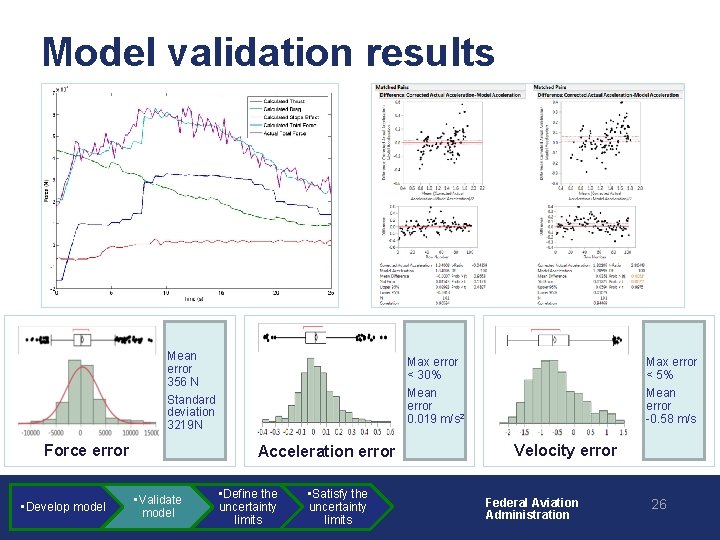
Model validation results Mean error 356 N Standard deviation 3219 N Force error • Develop model Max error < 30% Mean error 0. 019 m/s 2 Acceleration error • Validate model • Define the uncertainty limits • Satisfy the uncertainty limits Max error < 5% Mean error -0. 58 m/s Velocity error Federal Aviation Administration 26
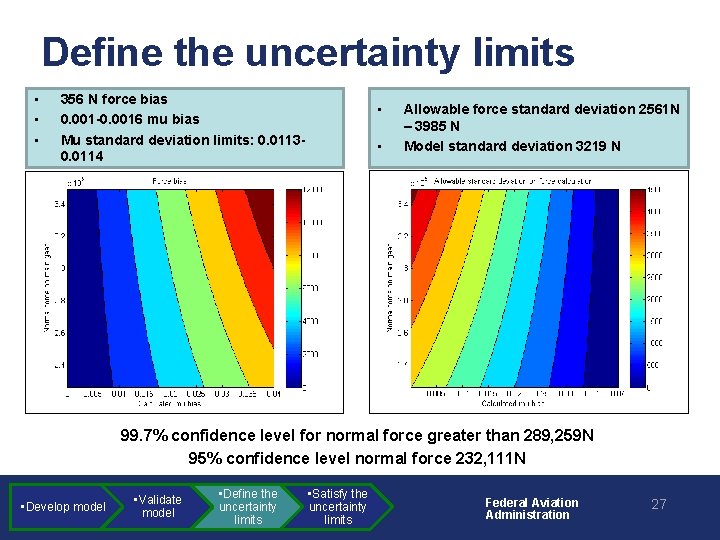
Define the uncertainty limits • • • 356 N force bias 0. 001 -0. 0016 mu bias Mu standard deviation limits: 0. 01130. 0114 • • Allowable force standard deviation 2561 N – 3985 N Model standard deviation 3219 N 99. 7% confidence level for normal force greater than 289, 259 N 95% confidence level normal force 232, 111 N • Develop model • Validate model • Define the uncertainty limits • Satisfy the uncertainty limits Federal Aviation Administration 27
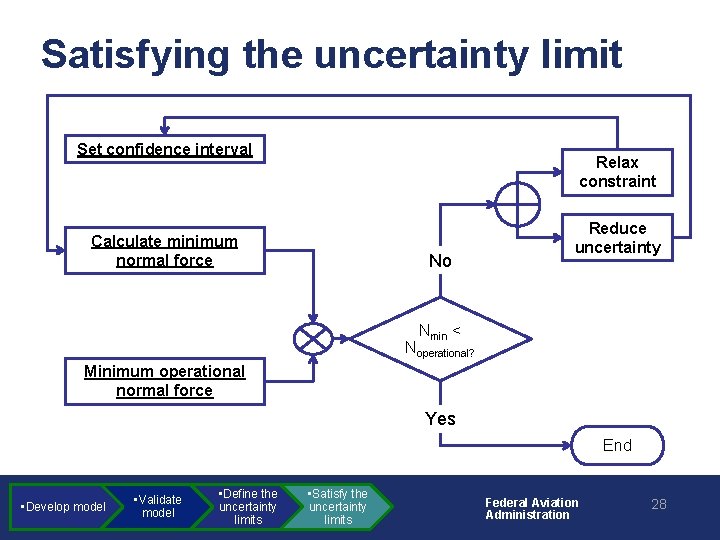
Satisfying the uncertainty limit Set confidence interval Relax constraint Calculate minimum normal force No Reduce uncertainty Nmin < Noperational? Minimum operational normal force Yes End • Develop model • Validate model • Define the uncertainty limits • Satisfy the uncertainty limits Federal Aviation Administration 28
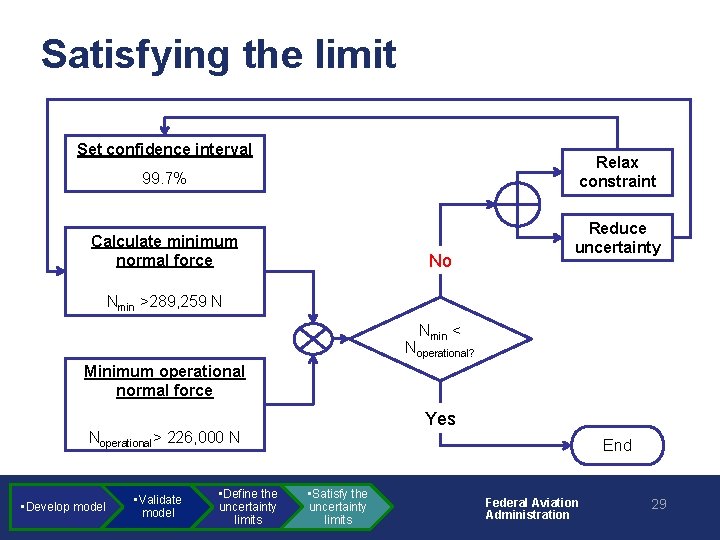
Satisfying the limit Set confidence interval Relax constraint 99. 7% Calculate minimum normal force No Reduce uncertainty Nmin >289, 259 N Nmin < Noperational? Minimum operational normal force Yes Noperational> 226, 000 N • Develop model • Validate model • Define the uncertainty limits End • Satisfy the uncertainty limits Federal Aviation Administration 29
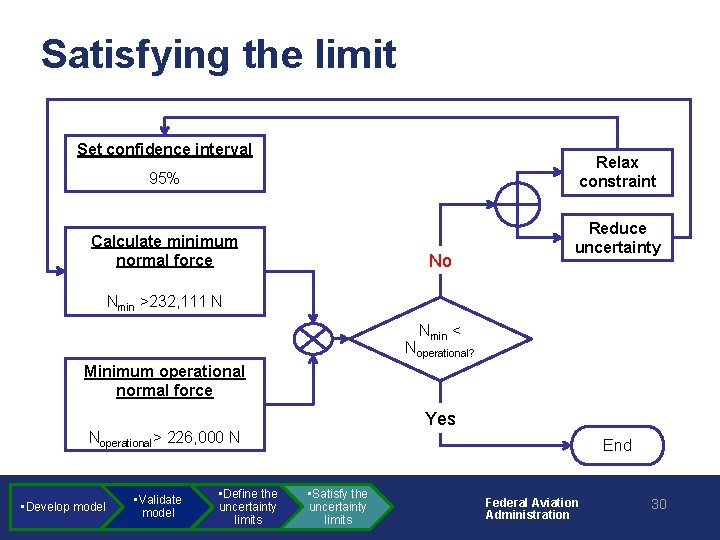
Satisfying the limit Set confidence interval Relax constraint 95% Calculate minimum normal force No Reduce uncertainty Nmin >232, 111 N Nmin < Noperational? Minimum operational normal force Yes Noperational> 226, 000 N • Develop model • Validate model • Define the uncertainty limits End • Satisfy the uncertainty limits Federal Aviation Administration 30
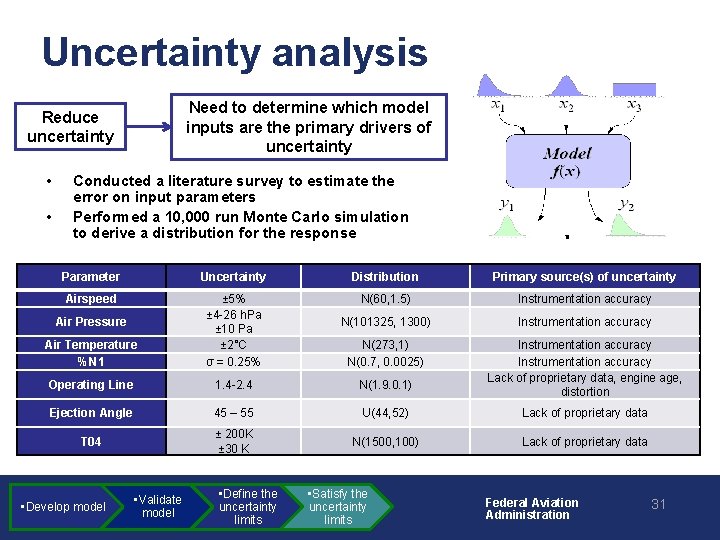
Uncertainty analysis Need to determine which model inputs are the primary drivers of uncertainty Reduce uncertainty • • Conducted a literature survey to estimate the error on input parameters Performed a 10, 000 run Monte Carlo simulation to derive a distribution for the response Parameter Uncertainty Distribution Primary source(s) of uncertainty Airspeed N(60, 1. 5) Instrumentation accuracy N(101325, 1300) Instrumentation accuracy Air Temperature %N 1 ± 5% ± 4 -26 h. Pa ± 10 Pa ± 2°C σ = 0. 25% N(273, 1) N(0. 7, 0. 0025) Operating Line 1. 4 -2. 4 N(1. 9. 0. 1) Instrumentation accuracy Lack of proprietary data, engine age, distortion Ejection Angle 45 – 55 U(44, 52) Lack of proprietary data T 04 ± 200 K ± 30 K N(1500, 100) Lack of proprietary data Air Pressure • Develop model • Validate model • Define the uncertainty limits • Satisfy the uncertainty limits Federal Aviation Administration 31
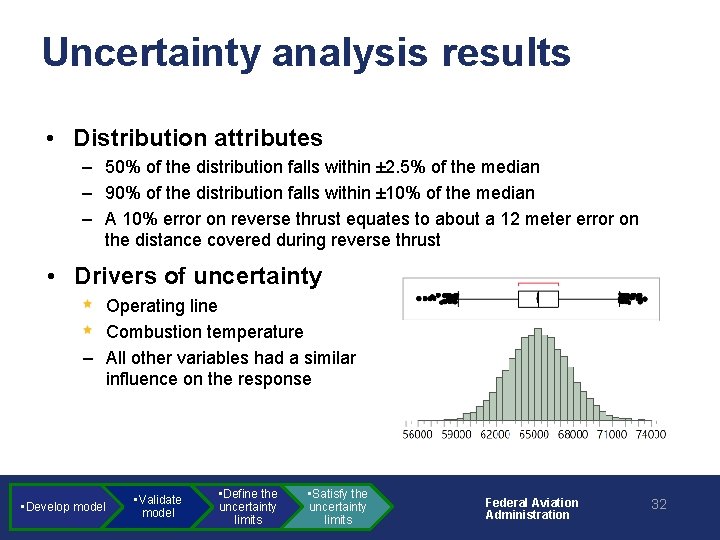
Uncertainty analysis results • Distribution attributes – 50% of the distribution falls within ± 2. 5% of the median – 90% of the distribution falls within ± 10% of the median – A 10% error on reverse thrust equates to about a 12 meter error on the distance covered during reverse thrust • Drivers of uncertainty Operating line Combustion temperature – All other variables had a similar influence on the response • Develop model • Validate model • Define the uncertainty limits • Satisfy the uncertainty limits Federal Aviation Administration 32
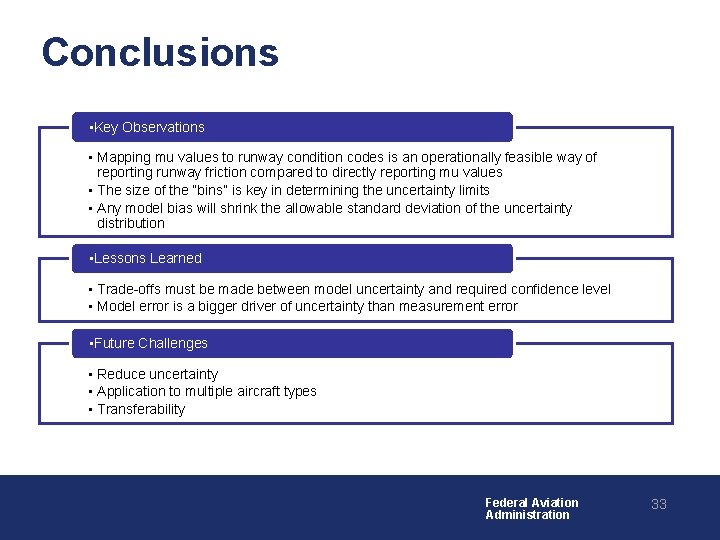
Conclusions • Key Observations • Mapping mu values to runway condition codes is an operationally feasible way of reporting runway friction compared to directly reporting mu values • The size of the “bins” is key in determining the uncertainty limits • Any model bias will shrink the allowable standard deviation of the uncertainty distribution • Lessons Learned • Trade-offs must be made between model uncertainty and required confidence level • Model error is a bigger driver of uncertainty than measurement error • Future Challenges • Reduce uncertainty • Application to multiple aircraft types • Transferability Federal Aviation Administration 33
- Slides: 33