
Unbalances in Tree Breeding Dag Lindgren SLU Sweden
Unbalances in Tree Breeding Dag Lindgren, SLU, Sweden Let’s have the discussion on the net instead of oral, this show and a discussion site is available at: http: //www-genfys. slu. se/staff/dagl/Komi/Dag. Activity. Komi. htm An effort was done to discuss at a workplace but that is now abandoned https: //arbetsplats. genfys. slu. se/Tree. Breeding. Book/
“Genetic unbalances” are: • • The basis for evolution; Natural – balance is extremely unnatural; Unavoidable; Essence of breeding.
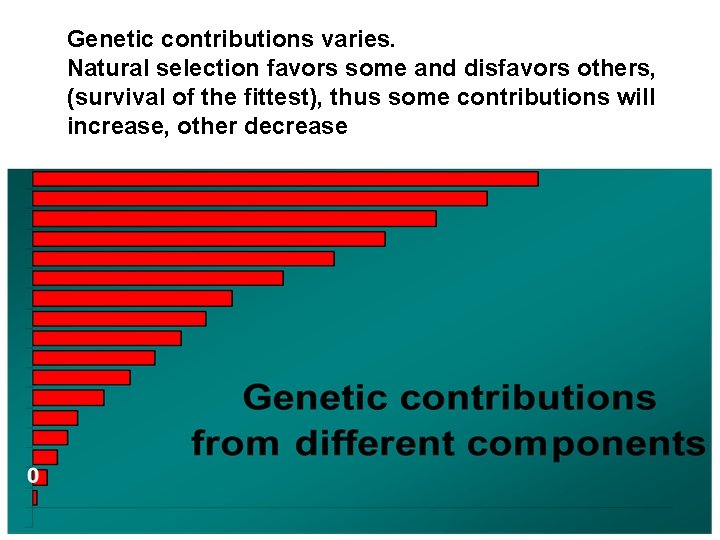
Genetic contributions varies. Natural selection favors some and disfavors others, (survival of the fittest), thus some contributions will increase, other decrease
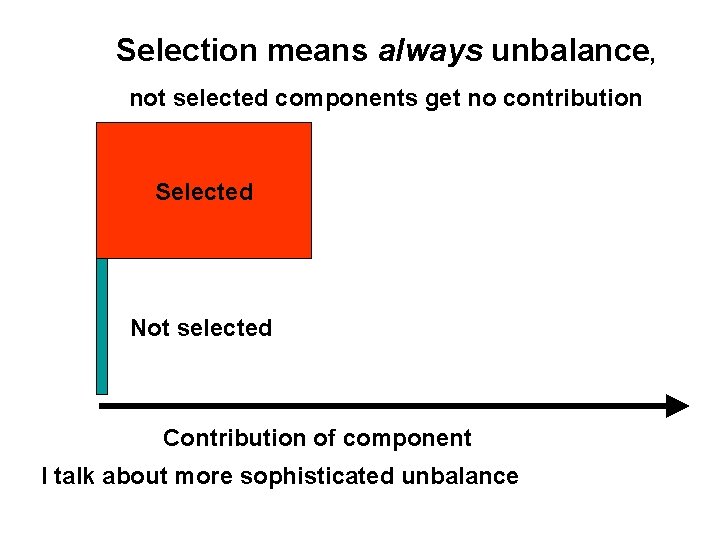
Selection means always unbalance, not selected components get no contribution Selected Not selected Contribution of component I talk about more sophisticated unbalance
Different types of unbalances… • Unbalance in genetic components (parents); • Unbalance in resources; • Structure of breeding population (e. g. mating probability, PAM) Often they come together, thus “Nucleus” (elite-main) has all three components of unbalance
Why unbalance? Breeding has to consider: • Gain; • Gene diversity; • Cost; • Time; • Interaction breeding → seed orchards. Unbalances may make the breeding system more optimal and efficient. Unbalances offer more degrees of freedom for optimization (balance is a form of simplification fundamentalism)
Reasons against unbalance? • Unbalance may just make things worse if not done wisely and skillfully; • It may overshoot and be too much unbalance! • Unbalance requires competence!; • Unbalance is more demanding on management skills; • Often the tools for handling unbalance are badly developed! • Seldom transparent; • Sometimes the advantage is small, usually limited (3 -8%) and seldom drastic (20%); • Advantages are often calculated for an ideal situation, and are usually somewhat less in the real world! • Historically unbalances were difficult to manage, thus all traditional wisdom is against, now computers can do everything!!!? • It requires calculations to be done.
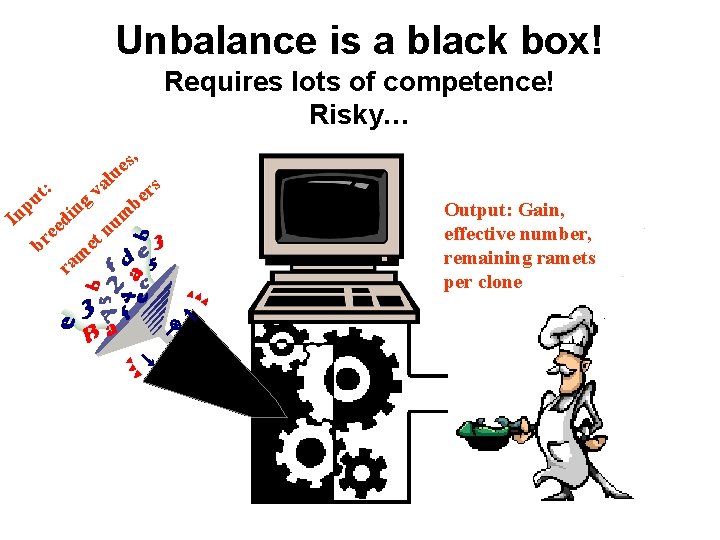
Unbalance is a black box! Requires lots of competence! Risky… , : t pu l a v s e u g b n i n m I ed nu e et br m a r s er Output: Gain, effective number, remaining ramets per clone
Why balance? • • • Simpler; More transparent; Less demanding on competence; Less demanding on skilful management; More fail-safe.
More reasons for unbalance • Even a limited extra gain (e. g. 5% increase in gain) means enormous economic returns for some extra thinking; • Although all extra gain predicted may not be reached, it is unlikely it will not give an extra gain (using some common sense); • Unbalance may offer fast gain. That is more worth than options some centuries ahead; • Competence can be increased by education and research! • Complete balance is an extreme alternative, that makes it unlikely to be optimal; • Complete balance is practically unrealistic! Unbalance must anyway be managed, so why not do it efficient!
Quantitative evaluation of unbalance often overestimates the practical benefit! • Genetic parameters (genetic correlations) change over time and environment; • Environment changes; • Unreliable parameter estimations; • Breeding goals change and are not exactly predictable; • Planned unbalances are influenced by unplanned; • This is likely to lead to overestimates of the practical benefits of unbalances and that optimum is missed.
Suggestion: Apply unbalance, but with moderation! • I suggest to often apply unbalances; • But do it with moderation and not too drastic; • It might often be a good idea to try compromising between balance and the predicted optimal unbalance; • After gaining experience of unbalance, a larger share of predicted advantages may be utilized.
Unbalances in production population • Simplest case, only unbalances in different contributions (e. g. clones, parents) matter.
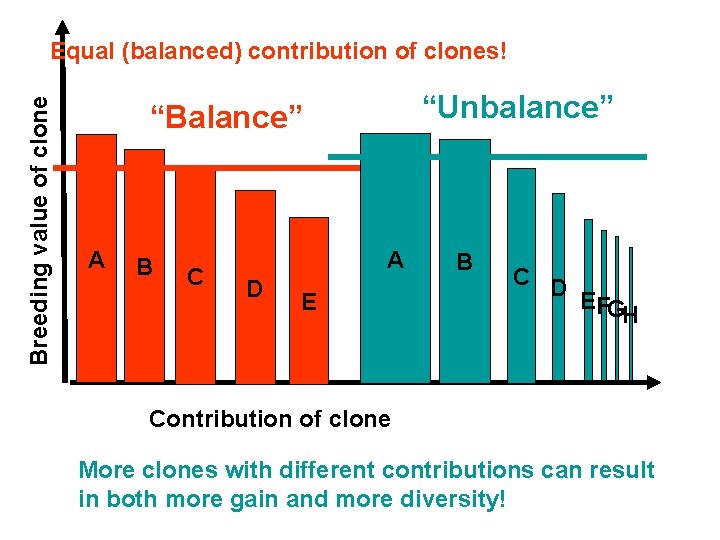
Breeding value of clone Equal (balanced) contribution of clones! “Unbalance” “Balance” A B C A D E B C D EFG H Contribution of clone More clones with different contributions can result in both more gain and more diversity!
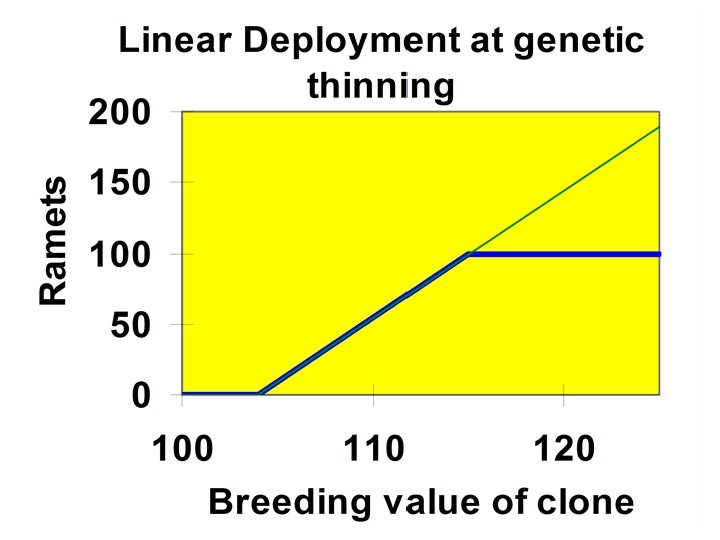
Linear deployment is optimal for establishment! • Relate contribution linearly to breeding value; • No other deployment combines higher gain with higher effective number.
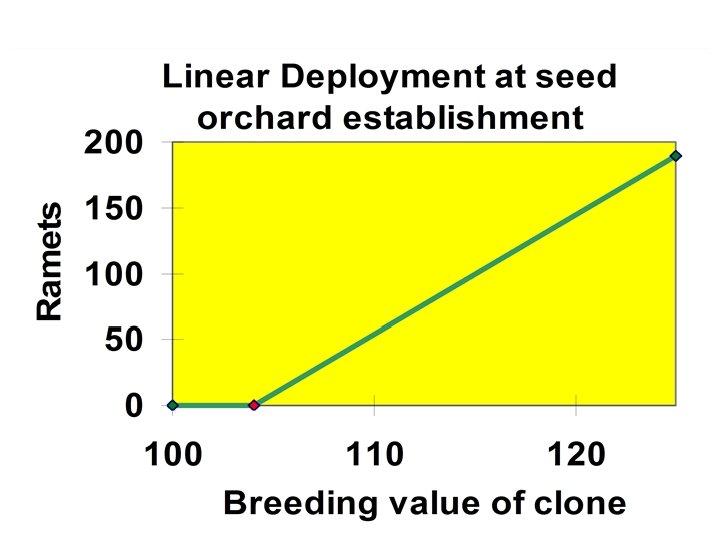
Linear deployment works with constraints also At thinning ramets cannot be added, just withdrawn. Thus there is a highest number of ramets!
The “Swedish” model • In the following, many of presented figures intend to be relevant for Sweden or the Swedish breeding strategy; • Heading for a number of long term “breeding populations”, each of size 50; • Heading for balance: Within family selection; Each parent get two full sib families; One selection per family. • Start with tested plus trees (typical 200 per breeding population); • Test recruitment population (clone-testing or progenytesting); • Genetic parameters, costs and time estimates should be relevant.
Unbalanced contributions at the initiation of a tree improvement program Closing the breeding population is irreciprocal and can not be undone! Argument to play on the safe side!
Generalizations from Wei Ph. D thesis (Wei 1995) Method developed for “optimal selection” in a population with family structure (can be visualized as unrelated full sibs with plus tree parents); • Optimal selection among individuals with a family structure is close to linear deployment from parent offspring; • Seems reasonable to start with crosses from about 150 plus trees to start up a breeding population; • Differences from current Swedish program: no testing (“phenotypic selection”), thus heritability not high; no initial knowledge of plus tree breeding values.
Unbalances in setting up the first recruitment population • Generalized from Ruotsalainen (2002) Ph. D thesis; • An approximation to linear deployment (3, 2, 1).
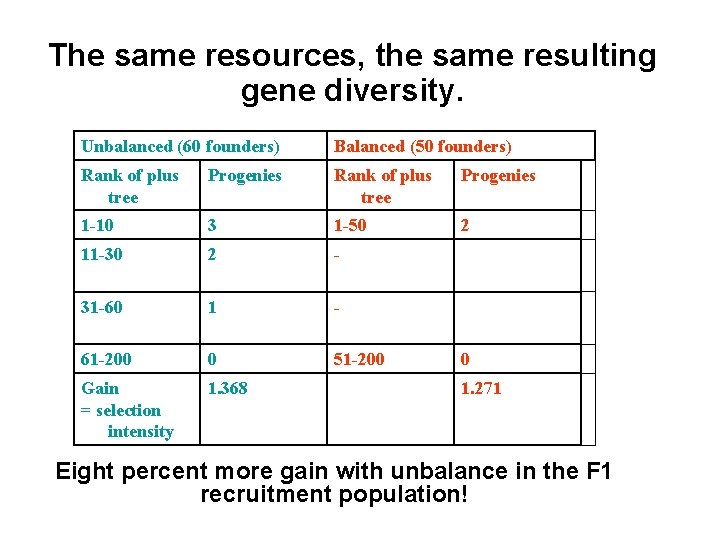
The same resources, the same resulting gene diversity. Unbalanced (60 founders) Balanced (50 founders) Rank of plus tree Progenies 1 -10 3 1 -50 2 11 -30 2 - 31 -60 1 - 61 -200 0 51 -200 Gain = selection intensity 1. 368 0 1. 271 Eight percent more gain with unbalance in the F 1 recruitment population!
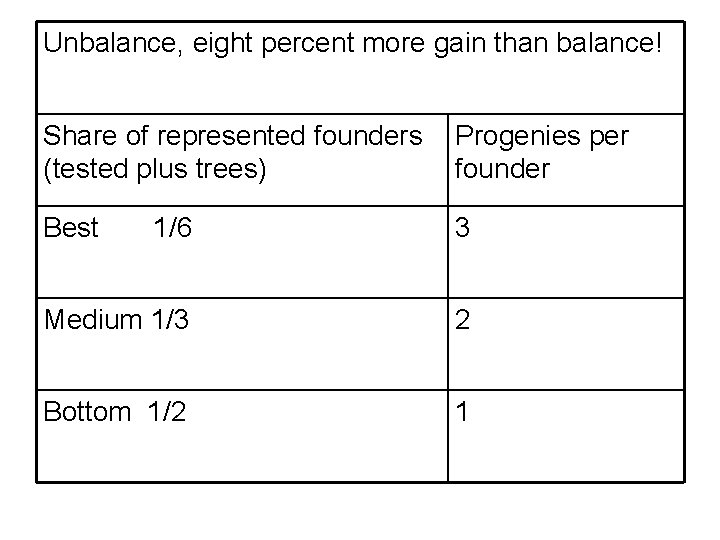
Unbalance, eight percent more gain than balance! Share of represented founders (tested plus trees) Progenies per founder Best 1/6 3 Medium 1/3 2 Bottom 1/2 1
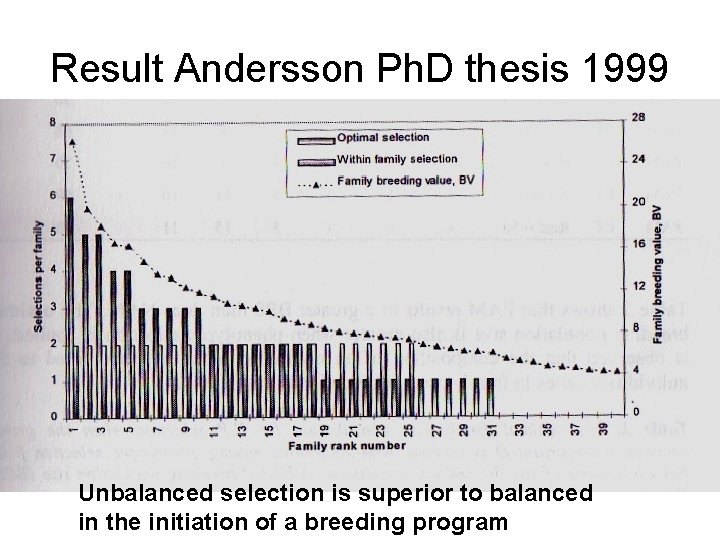
Result Andersson Ph. D thesis 1999 Unbalanced selection is superior to balanced in the initiation of a breeding program
Unbalance by refreshing in F 1 Inspired from Andersson Ph. D thesis (1999) Unbalance could perhaps be introduced in F 1 by refreshing: • In model-calculations it was favorable to replace 5 -10% of founders at F 1 with new plus trees; • That indicates that it may sometimes be beneficial to replace one or a few of bottom ranking BP members with new founders in the Swedish breeding; • The introduced founders may have slightly lower BV, but the Group merit of the BP could increase. That would mean that a few F 1 BP would be crossed with new founders to form the next BP generation; • The bottom ranking selected founders are only slightly superior to the best non-selected candidates.
Unbalances in long term breeding
Unbalances in long term breeding • Wei (1995) demonstrated the possible disastrous effects to use the strongly unbalanced selection resulting from maximizing breeding value in each generation; • When gene diversity is exhausted, genetic gain drops; • Sanchez (2000) studied the effect of a slight unbalance with quantitative simulation and small populations. It was noted that a slight unbalance often was more favorable in breeding than complete balance.
Results generalized from Ph. D thesis Rosvall (1999) • Used POPSIM (tree improvement simulator) to study different aspects of long term breeding with simulation of a program similar to Swedish Norway spruce breeding. • The capacity of the breeding population to support a seed orchard was used as a criterion.
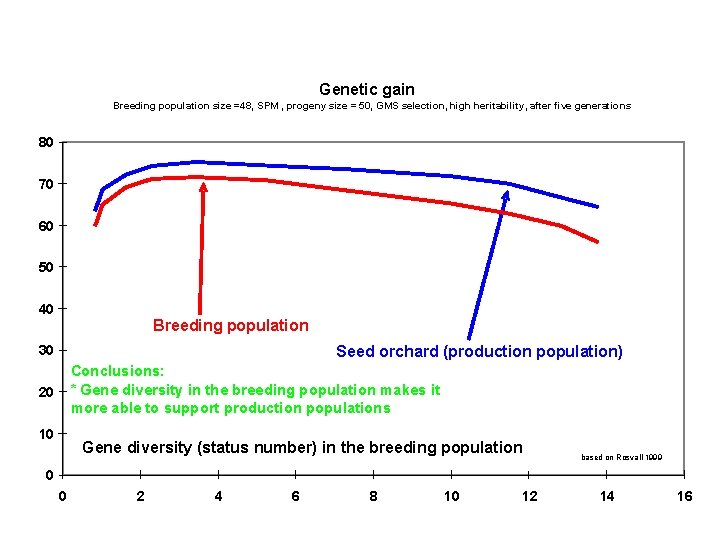
Genetic gain Breeding population size =48, SPM , progeny size = 50, GMS selection, high heritability, after five generations 80 70 60 50 40 Breeding population Seed orchard (production population) 30 Conclusions: * Gene diversity in the breeding population makes it more able to support production populations 20 10 Gene diversity (status number) in the breeding population based on Rosvall 1999 0 0 2 4 6 8 10 12 14 16
Unbalances in long term breeding? • Some advantage of unbalance is found, but so marginal and uncertain (Rosvall 1999) that it seems doubtful applying unbalance in the Swedish long term breeding.
Some reasons Rosvall (1999) found little advantage of unbalance • The benefit of the breeding is measured as its ability of supporting seed orchards; • Less sophisticated selection for advanced generation seed orchards than will be used in practice; • Testing of the recruitment population (clonal or progeny), thus high heritability (Swedish pine breeding may turn to phenotypic selection next cycle, when unbalance may appear more favorable); • Not exactly optimal unbalance, constraints in the simulator makes it hard to use optimum; • Intensively selected breeding populations (Bulmer effect); • Distinct generations, that will not be so!; • Breeding population size is small, that makes conservation of diversity relatively important; • Mainly a closed breeding population. I guess the advantage of unbalance is slightly greater in “real world”, and in particular in initiation!
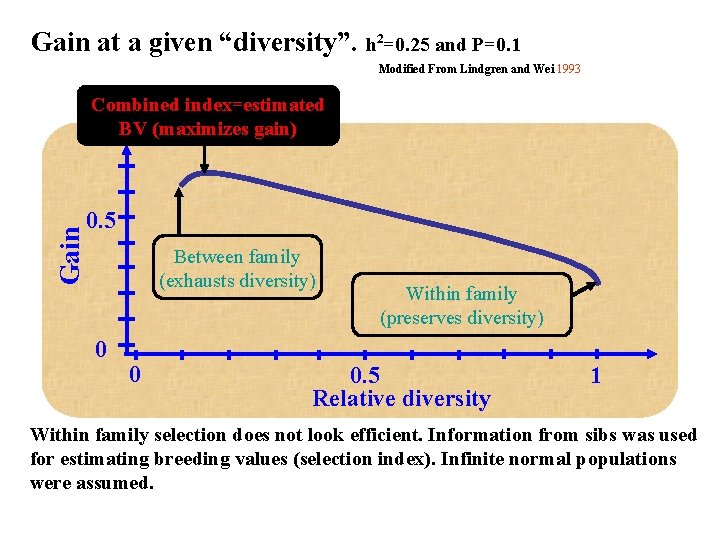
Gain at a given “diversity”. h 2=0. 25 and P=0. 1 Modified From Lindgren and Wei 1993 Gain Combined index=estimated BV (maximizes gain) 0. 5 Between family (exhausts diversity) 0 0 Within family (preserves diversity) 0. 5 Relative diversity 1 Within family selection does not look efficient. Information from sibs was used for estimating breeding values (selection index). Infinite normal populations were assumed.
Distinct generations rolling synchronously will not work! Rolling front breeding is more operational, and must be unbalanced! • Of the Swedish breeding populations, which reached F 1 in field, 75% are not synchronized in time. In spite of time lost in efforts! • Mates can be selected in several ways. Trees in field trials can probably only function as pollen parents, while grafts may first be available as seed parents. Optimal use of such factors will force unbalances. • It will be found optimal to utilize genotypes technically in different generations; • Some materials will be remeasured at higher age, some not; • The management of rolling front will be unbalanced anyway, so that balance is simple will be irrelevant.
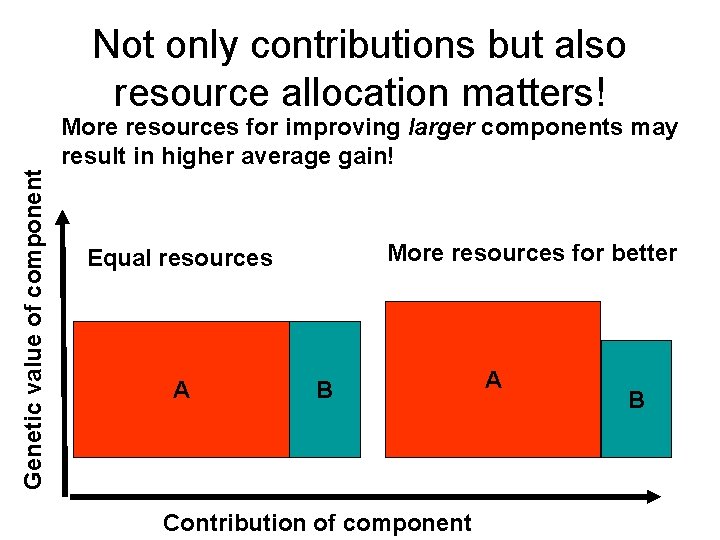
Genetic value of component Not only contributions but also resource allocation matters! More resources for improving larger components may result in higher average gain! More resources for better Equal resources A B Contribution of component A B
More attention on the better may improve efficiency • If the predicted best contributions get more attention (larger test families, more mating partners etc) the best contributions benefit more from breeding.
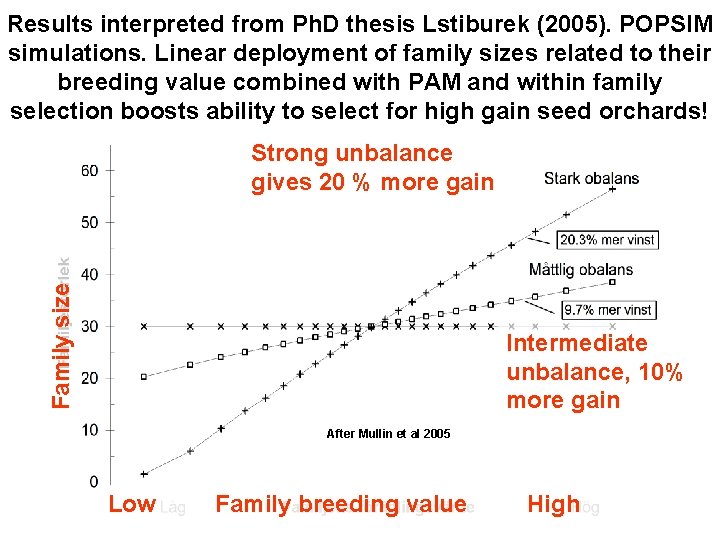
Results interpreted from Ph. D thesis Lstiburek (2005). POPSIM simulations. Linear deployment of family sizes related to their breeding value combined with PAM and within family selection boosts ability to select for high gain seed orchards! Family size Strong unbalance gives 20 % more gain Intermediate unbalance, 10% more gain After Mullin et al 2005 Low Family breeding value High
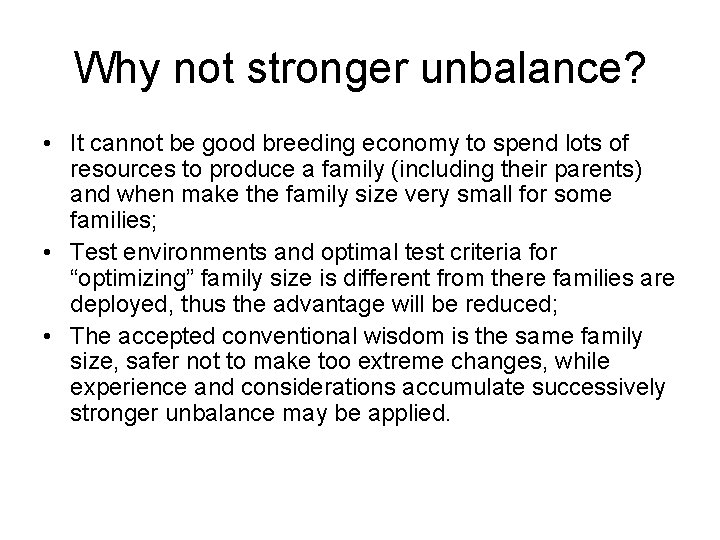
Why not stronger unbalance? • It cannot be good breeding economy to spend lots of resources to produce a family (including their parents) and when make the family size very small for some families; • Test environments and optimal test criteria for “optimizing” family size is different from there families are deployed, thus the advantage will be reduced; • The accepted conventional wisdom is the same family size, safer not to make too extreme changes, while experience and considerations accumulate successively stronger unbalance may be applied.
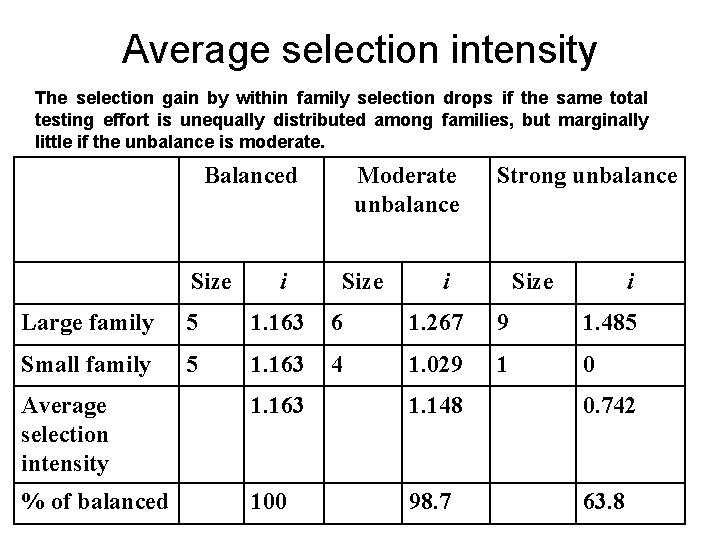
Average selection intensity The selection gain by within family selection drops if the same total testing effort is unequally distributed among families, but marginally little if the unbalance is moderate. Balanced Moderate unbalance Size Large family 5 1. 163 6 1. 267 9 1. 485 Small family 5 1. 163 4 1. 029 1 0 Average selection intensity 1. 163 1. 148 0. 742 100 98. 7 63. 8 % of balanced i Size Strong unbalance i Size i
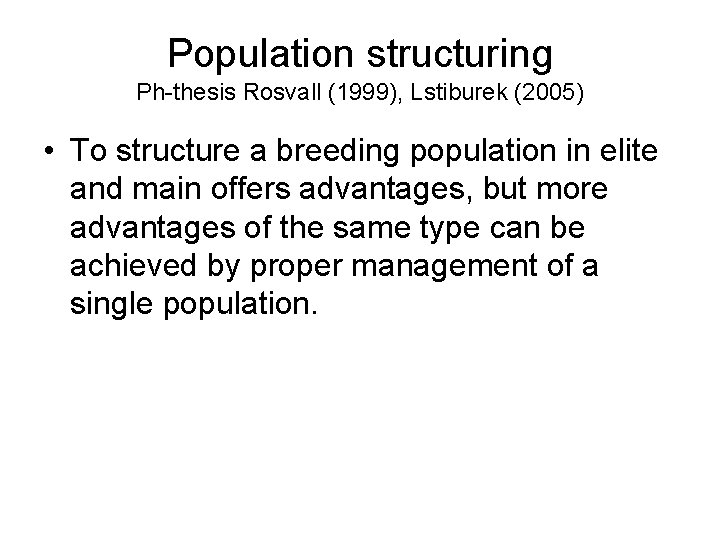
Population structuring Ph-thesis Rosvall (1999), Lstiburek (2005) • To structure a breeding population in elite and main offers advantages, but more advantages of the same type can be achieved by proper management of a single population.
Stratified sublining From Ruotsalainen Ph. Thesis (2001) • Extends the PAM concept to several generations; • A better alternative to elite – main is to use many strata.
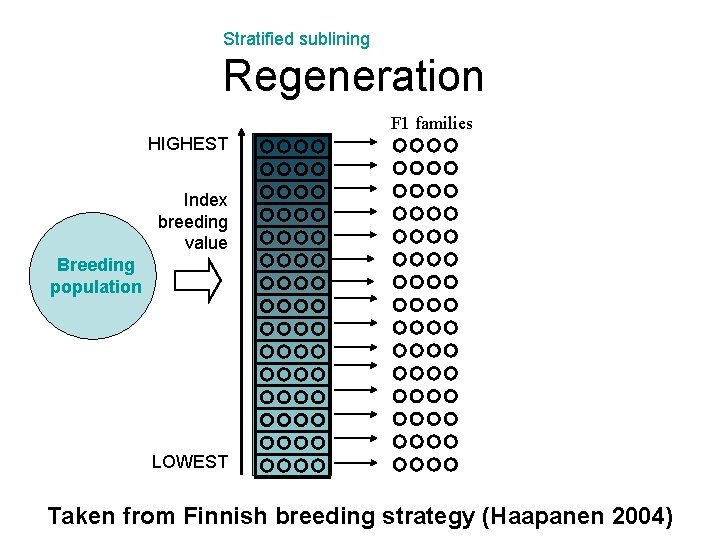
Stratified sublining Regeneration F 1 families HIGHEST Breeding 60 population Index breeding value (… 100) LOWEST Taken from Finnish breeding strategy (Haapanen 2004)
Stratified sublines – stratification allows prioritising testing and breeding efforts on the sublines which are most likely contribute trees to seed orchards • Complete control of inbreeding – enables enough unrelated selections to be deployed in seed orchards • Flexible – sublines can be merged or entirely abandoned if desired Taken from Finnish breeding strategy (Haapanen 2004)
Slight overestimate of advantages • Parents are paired for PAM or allocated to stratified sublines based on certain optimal indices, but the optimal indices will be different in the offspring (different environment, different genetic parameters, different desires), thus the positive effect of PAM and stratified sublines may be slightly overestimated.
End
- Slides: 45