
UNAUTHORIZED IMMIGRATION REGULATION AND LABOR PRODUCTIVITY EVIDENCE FROM

UNAUTHORIZED IMMIGRATION REGULATION AND LABOR PRODUCTIVITY: EVIDENCE FROM ESTABLISHMENTLEVEL DATA Iftekhar Hasan, Fordham University Incheol Kim, University of Texas Rio Grande Valley Xiaojing (Aggie) Yuan, University of Massachusetts Lowell

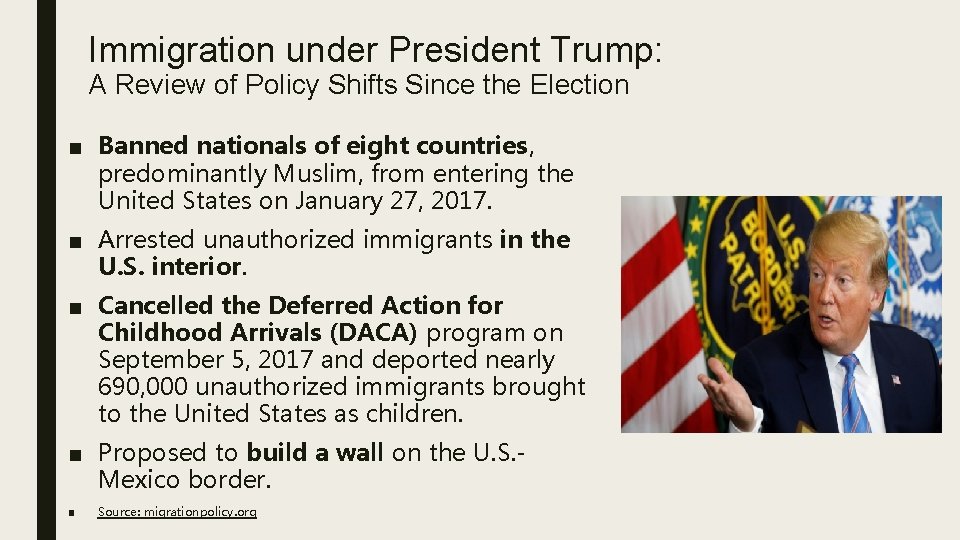
Immigration under President Trump: A Review of Policy Shifts Since the Election ■ Banned nationals of eight countries, predominantly Muslim, from entering the United States on January 27, 2017. ■ Arrested unauthorized immigrants in the U. S. interior. ■ Cancelled the Deferred Action for Childhood Arrivals (DACA) program on September 5, 2017 and deported nearly 690, 000 unauthorized immigrants brought to the United States as children. ■ Proposed to build a wall on the U. S. Mexico border. ■ Source: migrationpolicy. org
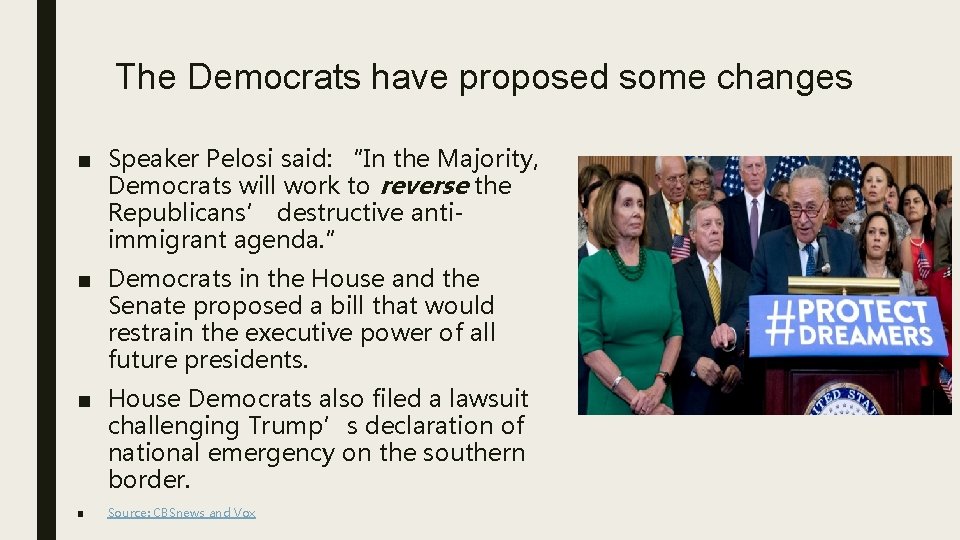
The Democrats have proposed some changes ■ Speaker Pelosi said: “In the Majority, Democrats will work to reverse the Republicans’ destructive antiimmigrant agenda. ” ■ Democrats in the House and the Senate proposed a bill that would restrain the executive power of all future presidents. ■ House Democrats also filed a lawsuit challenging Trump’s declaration of national emergency on the southern border. ■ Source: CBSnews and Vox
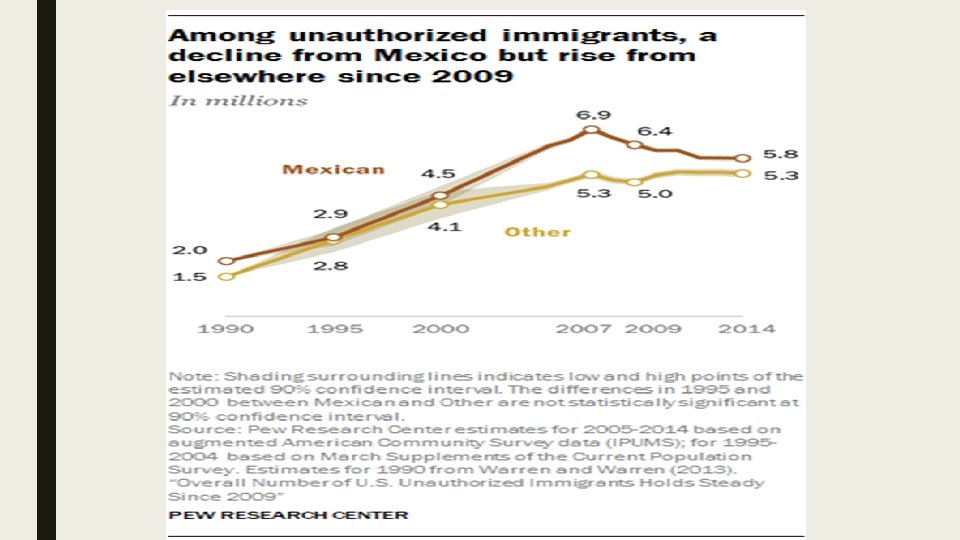
Foreign-Born Labor Share in the U. S. ■ The Bureau of Labor Statistics (BLS) reports that “in 2017, there were 27. 4 million foreign-born persons in the U. S. labor force, comprising 17. 1% of the total. ” ■ Pew Research Center reported in 2017 “… 7. 8 million immigrant workers are unauthorized immigrants, …. They alone account for 4. 8% of the civilian labor force, a dip from their peak of 5. 4% in 2007. ”
Research Question ■ The nonpartisan Congressional Budget Office projected that economic growth would be about 2% per year for the next 10 years assuming an influx of about 1 million immigrants per year (Minnpost, 2017). ■ Edwards and Ortega (2017) show a 3. 1% annual GDP contribution in the private sector by unauthorized immigrant workers. ■ Given the importance of immigrants to the U. S. economy, we ask Ø how anti-immigration laws affect labor productivity at the establishment level.

Literature Background ■ Most studies focus on general immigration issues, esp. authorized and skilled immigration. ü ü Kerr and Lincoln (2010): high-skilled immigrants and innovation at the firm level Hunt and Gauthier-Loiselle (2010): college-graduate immigrants and innovation Peri, Shih, and Sparber (2015): STEM immigrants and total factor productivity Sequeira, Nunn, and Qian (2019): European immigrants, income, productivity, and innovation ü Peri (2012): immigration in general and total factor productivity at the state level ■ Very little documentation on how local immigration policies affect the employment of unauthorized immigrants and labor productivity at the establishment/business level.
Challenge ■ There is a lack of accessible records on unauthorized workers at the establishment level. ■ We use local immigration regulation as a plausibly exogenous shock to the variation in the employment of unauthorized immigrants.
The 2007 Legal Arizona Workers Act ■ We exploit the 2007 Legal Arizona Workers Act (LAWA), which prohibits businesses from knowingly or intentionally hiring “unauthorized aliens. ” ■ We compare labor productivity between the state of Arizona and rest states at the establishment level before and after the LAWA. ■ Our difference-in-differences (DID) approach helps to mitigate endogeneity concerns by isolating the effect of confounding factors.
Hypotheses ■ The labor market friction hypothesis predicts that stringent local immigration laws reduce labor productivity if they reduce the employment and supply of unauthorized labor. ■ The human capital hypothesis suggests both employers and workers will be more willing to make human capital investments due to reduced agency problems, which will lead to increases in production efficiency and labor productivity. ■ The employee welfare hypothesis conjectures that employers can maintain or increase labor productivity at the expense of employee welfare.
Main Findings ■ We find a significant increase in labor productivity in Arizona establishments compared to establishments in other states after the passage of the LAWA. ■ Production-related waste per employee remains unchanged after the LAWA becomes effective, which suggests that restrictive immigration regulation does not increase production efficiency significantly. ■ Rather, establishments in Arizona incur more safety violations and penalties based on OSHA standards.
Data ■ Establishment-level data from the Walls & Associates National Establishment Time-Series (NETS) Database for 2003 to 2013. ■ The United States Environmental Protection Agency (EPA) provides data on the quantity of toxic and recycled wastes produced at the establishment level. – Section 313 of the Emergency Planning and Community Right-to. Know Act (EPCRA) includes a Toxics Release Inventory (TRI) program that records toxic chemical releases and pollution-prevention activities at industrial and federal facilities. ■ Workplace injuries and illnesses from the Occupational Safety and Health Administration (OSHA). – Citations and penalty data – Advantage: more likely to expose workplace safety issues incurred by unauthorized immigrants.
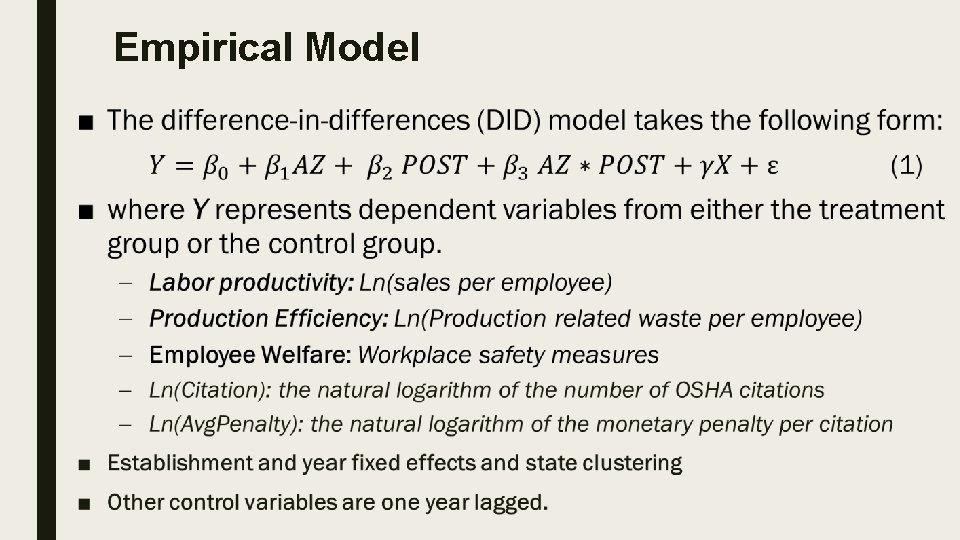
Empirical Model ■
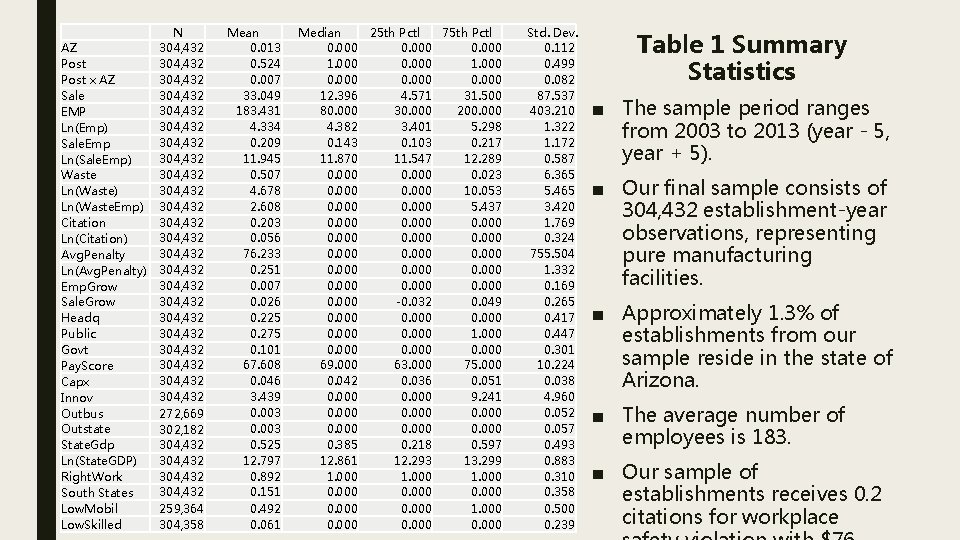
AZ Post x AZ Sale EMP Ln(Emp) Sale. Emp Ln(Sale. Emp) Waste Ln(Waste) Ln(Waste. Emp) Citation Ln(Citation) Avg. Penalty Ln(Avg. Penalty) Emp. Grow Sale. Grow Headq Public Govt Pay. Score Capx Innov Outbus Outstate State. Gdp Ln(State. GDP) Right. Work South States Low. Mobil Low. Skilled N 304, 432 304, 432 304, 432 304, 432 304, 432 304, 432 272, 669 302, 182 304, 432 259, 364 304, 358 Mean 0. 013 0. 524 0. 007 33. 049 183. 431 4. 334 0. 209 11. 945 0. 507 4. 678 2. 608 0. 203 0. 056 76. 233 0. 251 0. 007 0. 026 0. 225 0. 275 0. 101 67. 608 0. 046 3. 439 0. 003 0. 525 12. 797 0. 892 0. 151 0. 492 0. 061 Median 0. 000 1. 000 0. 000 12. 396 80. 000 4. 382 0. 143 11. 870 0. 000 0. 000 69. 000 0. 042 0. 000 0. 385 12. 861 1. 000 0. 000 25 th Pctl 75 th Pctl 0. 000 1. 000 0. 000 4. 571 31. 500 30. 000 200. 000 3. 401 5. 298 0. 103 0. 217 11. 547 12. 289 0. 000 0. 023 0. 000 10. 053 0. 000 5. 437 0. 000 0. 000 -0. 032 0. 049 0. 000 1. 000 0. 000 63. 000 75. 000 0. 036 0. 051 0. 000 9. 241 0. 000 0. 218 0. 597 12. 293 13. 299 1. 000 0. 000 Std. Dev. 0. 112 0. 499 0. 082 87. 537 403. 210 1. 322 1. 172 0. 587 6. 365 5. 465 3. 420 1. 769 0. 324 755. 504 1. 332 0. 169 0. 265 0. 417 0. 447 0. 301 10. 224 0. 038 4. 960 0. 052 0. 057 0. 493 0. 883 0. 310 0. 358 0. 500 0. 239 Table 1 Summary Statistics ■ The sample period ranges from 2003 to 2013 (year - 5, year + 5). ■ Our final sample consists of 304, 432 establishment-year observations, representing pure manufacturing facilities. ■ Approximately 1. 3% of establishments from our sample reside in the state of Arizona. ■ The average number of employees is 183. ■ Our sample of establishments receives 0. 2 citations for workplace
Figure 1 Time-Series Labor Productivity
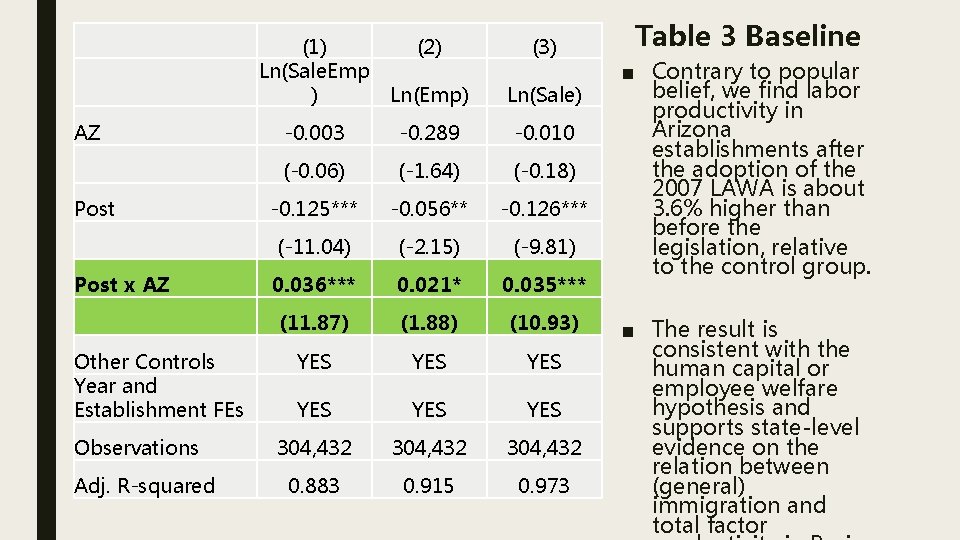
AZ Post x AZ Other Controls Year and Establishment FEs Observations Adj. R-squared (1) Ln(Sale. Emp ) (2) (3) Ln(Emp) Ln(Sale) -0. 003 -0. 289 -0. 010 (-0. 06) (-1. 64) (-0. 18) -0. 125*** -0. 056** -0. 126*** (-11. 04) (-2. 15) (-9. 81) 0. 036*** 0. 021* 0. 035*** (11. 87) (1. 88) (10. 93) YES YES YES 304, 432 0. 883 0. 915 0. 973 Table 3 Baseline ■ Contrary to popular belief, we find labor productivity in Arizona establishments after the adoption of the 2007 LAWA is about 3. 6% higher than before the legislation, relative to the control group. ■ The result is consistent with the human capital or employee welfare hypothesis and supports state-level evidence on the relation between (general) immigration and total factor
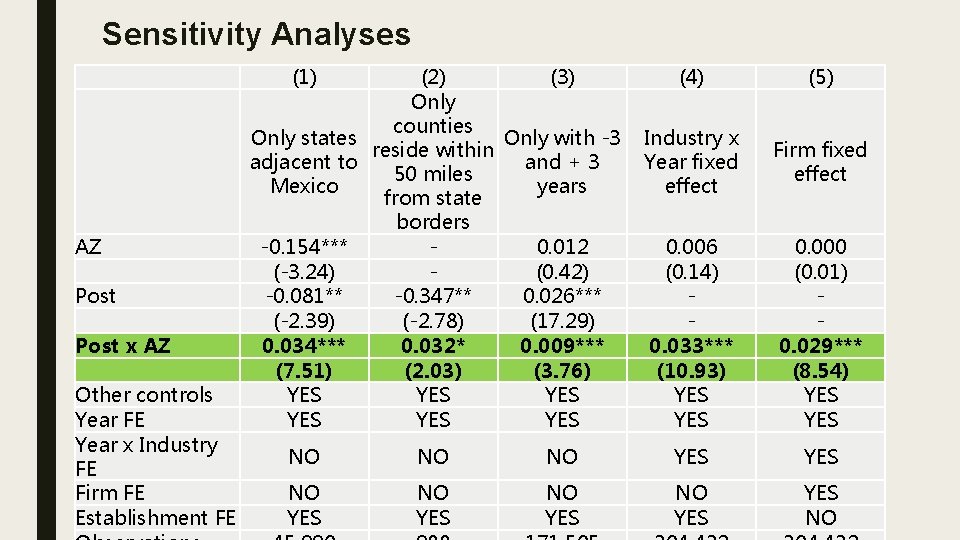
Sensitivity Analyses AZ Post x AZ Other controls Year FE Year x Industry FE Firm FE Establishment FE (1) (2) (3) (4) Only counties Only states Only with -3 Industry x reside within adjacent to and + 3 Year fixed 50 miles Mexico years effect from state borders -0. 154*** 0. 012 0. 006 (-3. 24) (0. 42) (0. 14) -0. 081** -0. 347** 0. 026*** (-2. 39) (-2. 78) (17. 29) 0. 034*** 0. 032* 0. 009*** 0. 033*** (7. 51) (2. 03) (3. 76) (10. 93) YES YES (5) Firm fixed effect 0. 000 (0. 01) 0. 029*** (8. 54) YES NO NO NO YES NO YES YES NO
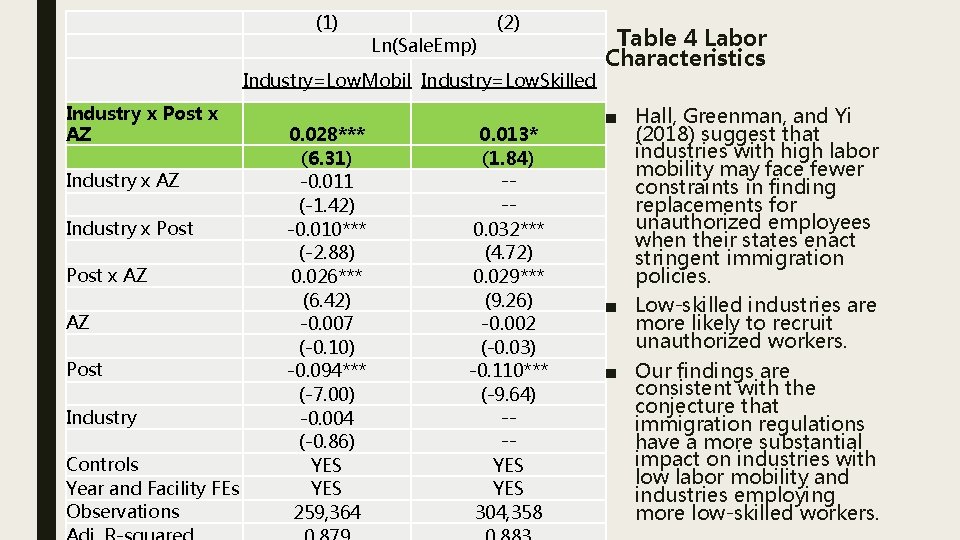
(1) Ln(Sale. Emp) (2) Industry=Low. Mobil Industry=Low. Skilled Industry x Post x AZ AZ Post Industry Controls Year and Facility FEs Observations 0. 028*** (6. 31) -0. 011 (-1. 42) -0. 010*** (-2. 88) 0. 026*** (6. 42) -0. 007 (-0. 10) -0. 094*** (-7. 00) -0. 004 (-0. 86) YES 259, 364 0. 013* (1. 84) --0. 032*** (4. 72) 0. 029*** (9. 26) -0. 002 (-0. 03) -0. 110*** (-9. 64) --YES 304, 358 Table 4 Labor Characteristics ■ Hall, Greenman, and Yi (2018) suggest that industries with high labor mobility may face fewer constraints in finding replacements for unauthorized employees when their states enact stringent immigration policies. ■ Low-skilled industries are more likely to recruit unauthorized workers. ■ Our findings are consistent with the conjecture that immigration regulations have a more substantial impact on industries with low labor mobility and industries employing more low-skilled workers.
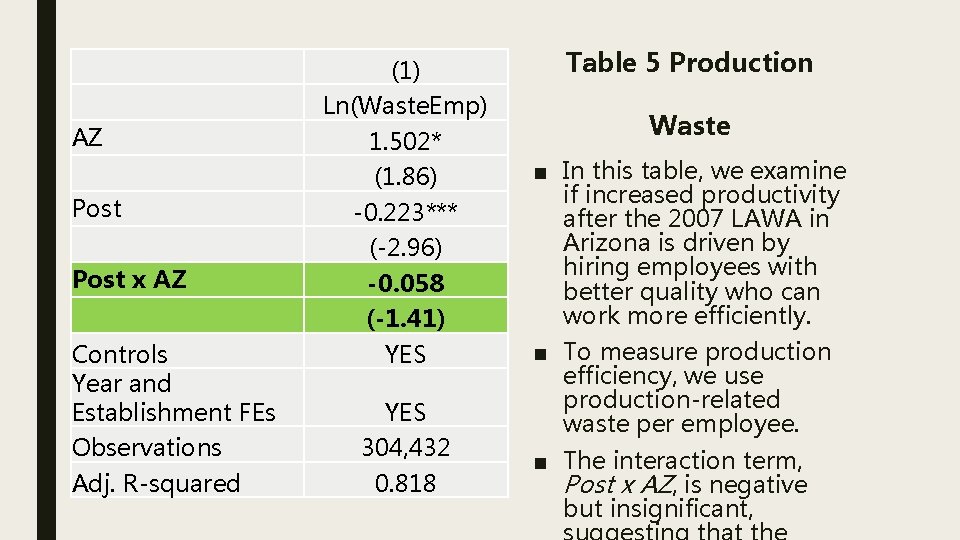
AZ Post x AZ Controls Year and Establishment FEs Observations Adj. R-squared (1) Ln(Waste. Emp) 1. 502* (1. 86) -0. 223*** (-2. 96) -0. 058 (-1. 41) YES 304, 432 0. 818 Table 5 Production Waste ■ In this table, we examine if increased productivity after the 2007 LAWA in Arizona is driven by hiring employees with better quality who can work more efficiently. ■ To measure production efficiency, we use production-related waste per employee. ■ The interaction term, Post x AZ, is negative but insignificant,
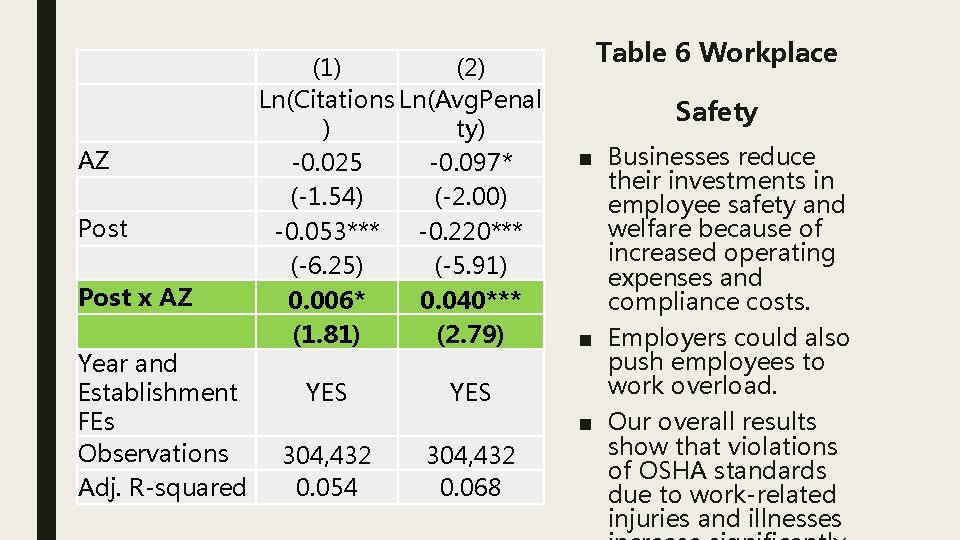
AZ Post x AZ Year and Establishment FEs Observations Adj. R-squared (1) (2) Ln(Citations Ln(Avg. Penal ) ty) -0. 025 -0. 097* (-1. 54) (-2. 00) -0. 053*** -0. 220*** (-6. 25) (-5. 91) 0. 006* 0. 040*** (1. 81) (2. 79) YES 304, 432 0. 054 304, 432 0. 068 Table 6 Workplace Safety ■ Businesses reduce their investments in employee safety and welfare because of increased operating expenses and compliance costs. ■ Employers could also push employees to work overload. ■ Our overall results show that violations of OSHA standards due to work-related injuries and illnesses
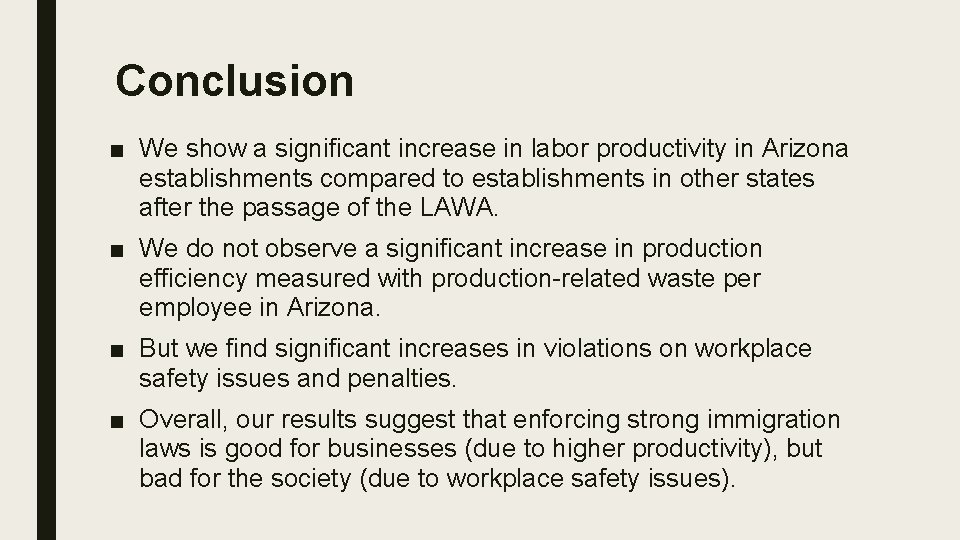
Conclusion ■ We show a significant increase in labor productivity in Arizona establishments compared to establishments in other states after the passage of the LAWA. ■ We do not observe a significant increase in production efficiency measured with production-related waste per employee in Arizona. ■ But we find significant increases in violations on workplace safety issues and penalties. ■ Overall, our results suggest that enforcing strong immigration laws is good for businesses (due to higher productivity), but bad for the society (due to workplace safety issues).
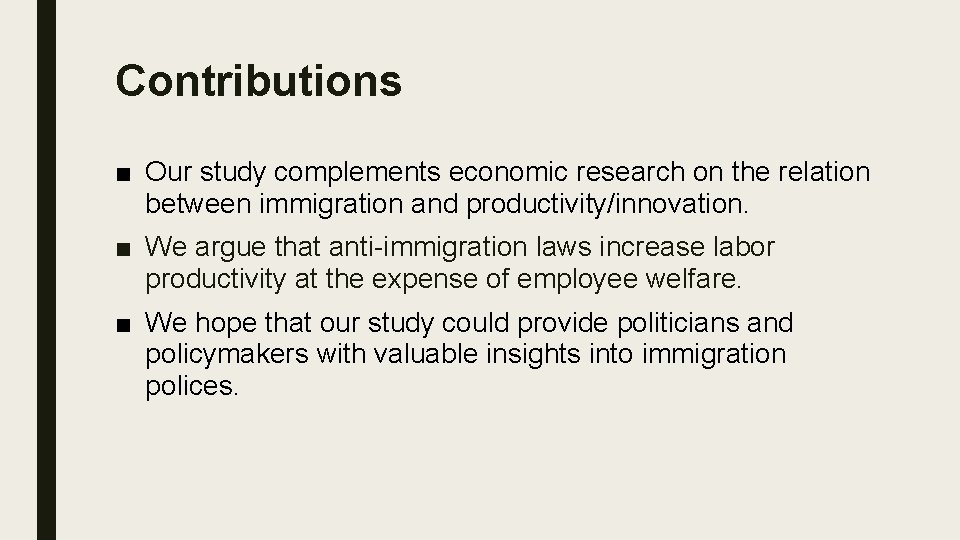
Contributions ■ Our study complements economic research on the relation between immigration and productivity/innovation. ■ We argue that anti-immigration laws increase labor productivity at the expense of employee welfare. ■ We hope that our study could provide politicians and policymakers with valuable insights into immigration polices.

Thank you!
- Slides: 24