UML DIAGRAMS USE CASE DIAGRAM The usecases represent


- Slides: 26
UML DIAGRAMS
USE CASE DIAGRAM • The usecases represent the behaviour of he system. • It consists of collection of usecases, actors and their relationships.
Use cases diagram
USE CASE DIAGRAM
UML CLASS DIAGRAMS • The class diagram represent the static design view of the system. • It contains the set of classes, interfaces, collaborations and their relationships • Classes are composed of three things: a name, attributes, and operations
UML Class Notation • A class is a rectangle divided into three parts – Class name – Class attributes (i. e. data members, variables) – Class operations (i. e. methods) • Modifiers – – Private: Public: + Protected: # Static: Underlined (i. e. shared among all members of the class) • Abstract class: Name in italics
UML Class Notation • Lines or arrows between classes indicate relationships – Association • A relationship between instances of two classes, where one class must know about the other to do its work, e. g. client communicates to server • indicated by a straight line or arrow – Aggregation • An association where one class belongs to a collection, e. g. instructor part of Faculty • Indicated by an empty diamond on the side of the collection – Composition • Strong form of Aggregation • Lifetime control; components cannot exist without the aggregate • Indicated by a solid diamond on the side of the collection – Inheritance • An inheritance link indicating one class a superclass relationship, e. g. bird is part of mammal • Indicated by triangle pointing to superclass
CLASS DIAGRAM
ACTIVITY DIAGRAM • Shows the workflow and business process. • It show the sequential and parallel activities in process. Notations: 1. Initial state 2. action node 3. Transition 4. fork 5. join 6. End of activity
ACTIVITY DIAGRAM
Activity Diagram Example
SEQUENCE DIAGRAM • Sequence diagram shows how objects communicate with each other in terms of sequence of messages. • They are specially useful for modelling the behavior of the system.
SEQUENCE DIAGRAM
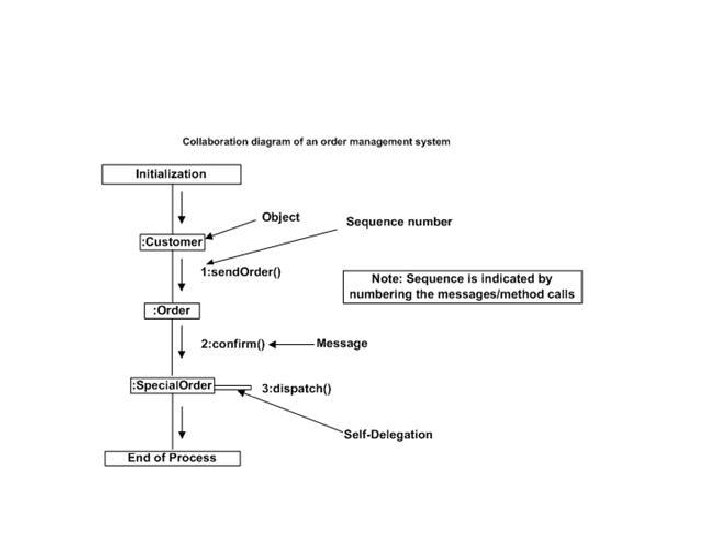
COLLABORATION DIAGRAM • Collaboration diagrams are used to describe the structural organizations of the objects taking part in the interaction.
Package diagram • Package diagrams simplify complex class diagrams, it can group classes into packages. • A package is a collection of logically related UML elements. • Packages are depicted as file folders and can be used on any of the UML diagrams.
Package Diagrams • To organize complex class diagrams, you can group classes into packages. A package is a collection of logically related UML elements • Notation – Packages appear as rectangles with small tabs at the top. – The package name is on the tab or inside the rectangle. – The dotted arrows are dependencies. One package depends on another if changes in the other could possibly force changes in the first. – Packages are the basic grouping construct with which you may organize UML models to increase their readability
Package Example Dispatcher. Interface Notification Incident. Management
Package diagram
STATE MACHINE DIAGRAM • It represent the events and states of object and behavior of object
DEPLOYMENT DIAGRAM • Represents the physical architecture of the system. For instance, a deployment diagram show, • hardware components called nodes. Eg: a web server, an application server, a database server. • software components called artifacts that run on that node. Eg: web application, database. • connection between various components. Eg: JDBC, RMI
Deployment Diagrams • Shows the physical architecture of the hardware and software of the deployed system • Nodes – Typically contain components or packages – Usually some kind of computational unit; e. g. machine or device (physical or logical) • Physical relationships among software and hardware in a delivered systems – Explains how a system interacts with the external environment
DEPLOYMENT DIAGRAM
COMPONENT DIAGRAM • Used to model the physical aspect of the system. (. exe, . doc) • Used during the implementation phase of system
Component Diagram Notation • Components are shown as rectangles with two tabs at the upper left • Dashed arrows indicate dependencies • Circle and solid line indicates an interface to the component
COMPONENT DIAGRAM