Ultrasonography in Management of Subfertility Dr Ernest Hung

Ultrasonography in Management of Subfertility Dr. Ernest Hung Yu NG Department of Obstetrics & Gynaecology The University of Hong Kong

Ultrasonography in subfertility 1. 2. 3. Workup for subfertility Assisted reproduction technique Early pregnancy scanning Ø Ø Ø Number of gestational sacs Viability Ectopic pregnancy

Subfertility workup l Uterus l Ovary l Fallopian l Others tubes

Uterus 1. Congenital uterine abnormalities 2. Fibroid and polyps

Congenital uterine abnormalities ASRM classification

Congenital uterine abnormalities

Normal uterus

Arcuate uterus

Septate uterus

Congenital uterine anomalies l l l Associated with a range of adverse reproductive outcomes Septate uterus had a higher proportion of 1 st trimester loss compared with women with a normal uterus. Women with an arcuate uterus had a greater proportion of 2 nd trimester loss and preterm labor. (Woelfer et al. , 2001)

Uterine fibroids The commonest tumor in women: 20 -25% in reproductive age women

Endometrial polyp

Endometrial polyp

Ovary 1. Ovarian cyst 2. Polycystic ovary

Ovarian cyst

Polycystic ovary

Polycystic ovary: international consensus definitions 1. 2. 12 follicles of 2 -9 mm in diameter in at least one ovary or Increased ovarian volume (>10 cm 3) (Balen et al. , 2003)

Fallopian tube 1. Tubal patency test 2. Hydrosalpinx

Tubal patency test

3 D Vs 2 D sonohysterography Advantages over 2 D sonohysterography l Better visualization of a spill from the distal end of the tube (91% Vs 46%) l Shorter duration of the procedure l Lower volume of contrast medium l (Sladkevicius et al. , 2000)

3 D sonohysterography Vs laparoscopy The sensitivity of 3 D sonohysterography for detecting tubal patency was 100% with a specificity of 67%. l The positive and negative predictive values were 89% and 100% respectively l The concordance rate was 91%. l (Chan et al. , 2005)

Hydrosalpinx l About 30% of infertile women seeking IVF treatment have hydrosalpinx

Ultrasound in reproduction 1. 2. Subfertility workup Assisted reproduction technique Ø Ø l Monitoring of ovarian response Timing of the procedure Oocyte retrieval / embryo transfer under ultrasound guidance Prediction of ovarian response and pregnancy Early pregnancy scanning

Ultrasound in ART Ovulation induction 1. Clomiphene citrate 2. Gonadotrophin Ovarian stimulation by gonadotrophin 1. insemination 2. IVF

Ultrasound in ART

Ultrasound in ART

Ultrasound in reproduction 1. 2. Subfertility workup Assisted reproduction technique Ø Ø l Monitoring of ovarian response Timing of the procedure Oocyte retrieval / embryo transfer under ultrasound guidance Prediction of ovarian response and pregnancy Early pregnancy scanning

Multiple follicular development

Concerns l Poor ovarian responses Ø cycle Ø poor l cancellation pregnancy rates Excessive ovarian responses Ø risk of ovarian hyperstimulation syndrome Ø high E 2 detrimental to the outcome (Ng et al. , 2000)

Ultrasound parameters 1. Ovarian volume (Syrop et al. , 1995; Lass et al. , 2. Antral follicle count (Tomas et al. , 1997; Chang 3. Ovarian stromal blood flow (Zaidi et al. , 1997) et al. , 1998 a & 1998 b; Ng et al. , 2000; Fratarelli et al. , 2000; Hsieh et al. , 2001; Nahum et al. , 2001; Kupesic and Kurjak, 2002; Popovic. Todorovic et al. , 2003 ) 1996; Engmann et al. , 1999; Kupesic and Kurjak, 2002; Kupesic et al. , 2003; Popovic-Todorovic et al. , 2003, Ng et al. , 2005 & 2006 )

Ovarian volume

Ovarian volume l Total ovarian volume and the volume of the smallest ovary predictive of peak E 2 levels, no. of oocytes and cycle cancellation (Syrop et al. , 1995) l Mean ovarian volume prior to stimulation predictive of poor ovarian response (Lass et al. , 1997)
")
Antral follicle number (AFC)

AFC l AFC achieved the best predictive value of the number of oocytes obtained; followed by basal FSH, body mass index and age of women. (Ng et al. , 2000) l The predictive performance of AFC toward poor response is significantly better than that of basal FSH. AFC might be considered the test of first choice in the assessment of ovarian reserve prior to IVF. (Hendriks et al. , 2005)

Summary ROC curves of AFC and FSH in prediction of poor response

Summary ROC curves of AFC and FSH in prediction of pregnancy Poor performance for both AFC and FSH

Ovarian stromal blood flow l Adequate vascular supply to provide endocrine and paracrine signals may play a key role in the regulation of follicle growth l Normal responders had higher peak systolic velocity of ovarian stromal vessels than poor responders (Zaidi et al. , 1996; Engmann et al. , 1999) l Women with RI >0. 56 had longer stimulation duration and lower number of oocytes. (Bassil et al. , 1997)

Ovarian stromal blood flow by 2 D power Doppler No difference in ovarian responses between those with unilateral/bilateral absent ovarian stromal flow and bilateral ovarian stromal flow l Ovarian stromal blood flow indices by 2 D power Doppler had no predictive value for the ovarian response. (Ng et al. , 2005) l

Ovarian stromal blood flow by 3 D power Doppler Number of oocytes obtained B (95% CI) Beta R 2 change P value AFC 0. 421 (0. 204, 0. 638) 0. 329 0. 170 <0. 001 Age -0. 516 (-0. 809, -0. 224) -0. 299 0. 084 0. 001 Body mass index -0. 388 (-0. 720, -0. 057) -0. 189 0. 036 0. 022 Basal FSH, mean ovarian volume, mean ovarian VI, FI and VFI were excluded in the equation. (Ng et al. , 2006)

Endometrial receptivity Endometrial thickness and volume Endometrial pattern Doppler study of uterine vessels Endometrial and subendometrial vessels 1. 2. 3. 4. • • 2 D Doppler flow indices 3 D Power Doppler indices: objective assessment of the blood flow towards endometrial and subendometrial regions

Endometrial thickness and pattern

Endometrial thickness and pattern l Endometrial thickness: cut-off values between 6 -10 mm to discriminate between pregnant and non-pregnant cycles l Low positive predictive value and specificity in the prediction of the IVF outcome (Turnbull et al. , 1995; Friedler et al. , 1996).

Endometrial thickness l Maximal value for endometrial thickness above which pregnancy is unlikely to occur ? >14 mm Ø Reduced pregnancy rates noted by Weissman et al. (1999), Kupesic et al. (2001) and Schild et al. (2001) Ø Dickey et al. (1992) and Dietterich et al. (2002) demonstrated no adverse effects

Endometrial volume l Endometrium must attain at least 2. 0 -2. 5 ml to achieve a pregnancy l Endometrial volume measured on day of h. CG (Yaman et al. , 2000), egg collection (Schild et al. , 2001) and embryo transfer (Raga et al. , 1999; Kupesic et al. , 2001) not predictive of pregnancy

Doppler study of uterine vessels l l Assessed by colour or power Doppler ultrasound and expressed as downstream impedance to flow Assumed to reflect the actual blood flow to the endometrium, although the major compartment of the uterus is the myometrium and there is collateral circulation between uterine and ovarian vessels.

Doppler study of uterine vessels
 was")
Doppler study of uterine vessels l Pregnancy decreased when uterine pulsatility index (PI) was 3. 3 -3. 5, and the uterine resistance index (RI) was 0. 95 (Dickey, 1997). l Uterine PI has a high negative predictive value and sensitivity (in the ranges of 88 -100% and 96 -100%, respectively) and a relatively higher range of positive predictive value and specificity (44 -56% and 13 -35%, respectively). (Friedler et al. , 1996)

Doppler study of spiral arteries l Not predictive of pregnancy (Zaidi et al. , 1995; Yuval et al. , 1999; Schild et al. , 2001), although Battaglia et al. (1997) and Kupesic et al. (2001) found significantly lower spiral artery PI in pregnant cycles than non-pregnant ones.

Endometrial blood flow l. A good blood supply towards the endometrium is essential for normal implantation.

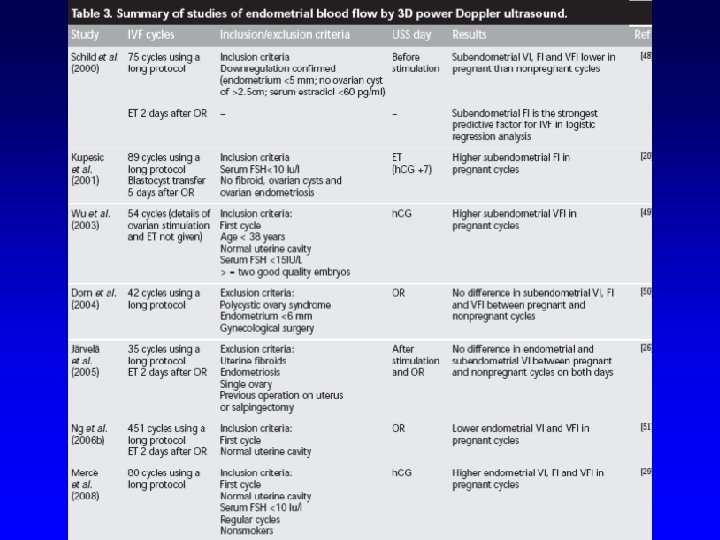
Endometrial volume and blood flow Subendometrial shell volume and blood flow
- Slides: 51