
UCSF Core Financial Plan Fall 2015 Update Mike

- Slides: 36
UCSF Core Financial Plan Fall 2015 Update Mike Clune Budget and Resource Management 10/30/2020
Presentation Overview § Contents: • Overview of the Core Financial Plan (CFP) • 2014 -15 Results • Revenues and allocations – 2015 -16 through 2024 -25 • Potential upside opportunities and downside risks 2 UCSF Core Financial Plan – Fall 2015 Update
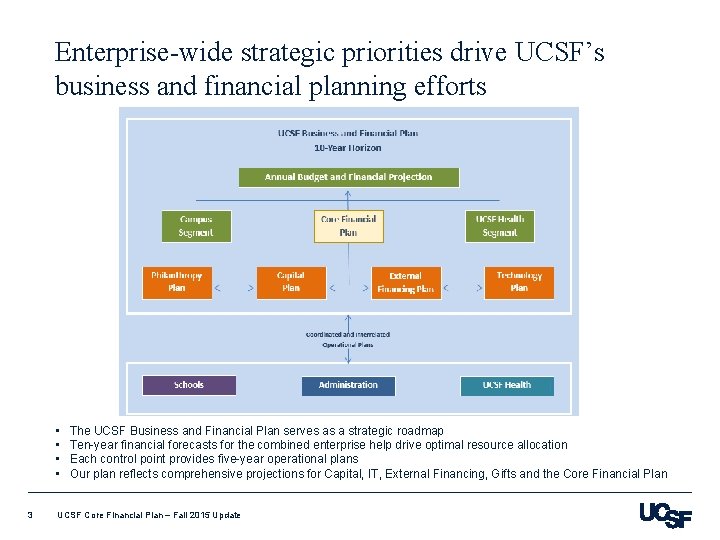
Enterprise-wide strategic priorities drive UCSF’s business and financial planning efforts • • 3 The UCSF Business and Financial Plan serves as a strategic roadmap Ten-year financial forecasts for the combined enterprise help drive optimal resource allocation Each control point provides five-year operational plans Our plan reflects comprehensive projections for Capital, IT, External Financing, Gifts and the Core Financial Plan UCSF Core Financial Plan – Fall 2015 Update
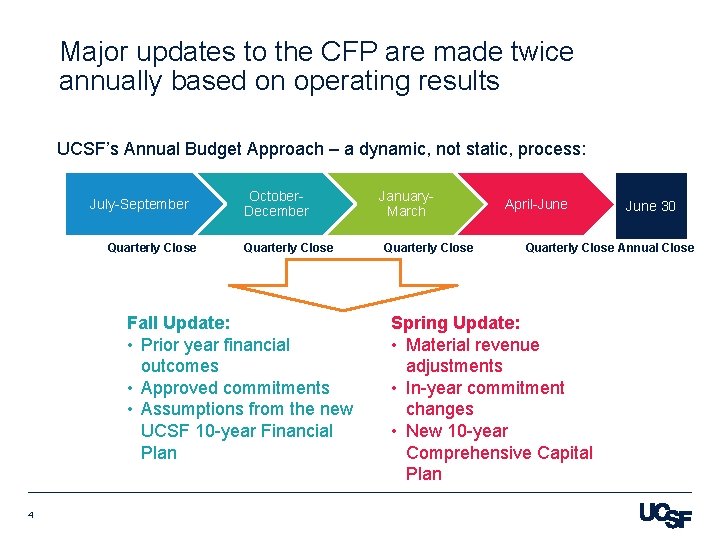
Major updates to the CFP are made twice annually based on operating results UCSF’s Annual Budget Approach – a dynamic, not static, process: July-September Quarterly Close October. December Quarterly Close Fall Update: • Prior year financial outcomes • Approved commitments • Assumptions from the new UCSF 10 -year Financial Plan 4 January. March Quarterly Close April-June 30 Quarterly Close Annual Close Spring Update: • Material revenue adjustments • In-year commitment changes • New 10 -year Comprehensive Capital Plan
Management of the CFP is governed by several key strategic principles § We must: • Provide timely, clear and comprehensive financial information • Collect the input of stakeholders • Shift from silo-based thinking to enterprise-wide thinking • Continue to move from short-term tactical actions to a long-term strategic approach • Continue to base projections on reasonable assumptions with alternate scenarios • Avoid fencing off fund sources • Provide management with the capability to choose from among competing demands • Maintain appropriate levels and types of reserves • Establish sound on-going baseline allocations • Keep an eye on UC system-imposed requirements 5 UCSF Core Financial Plan – Fall 2015 Update
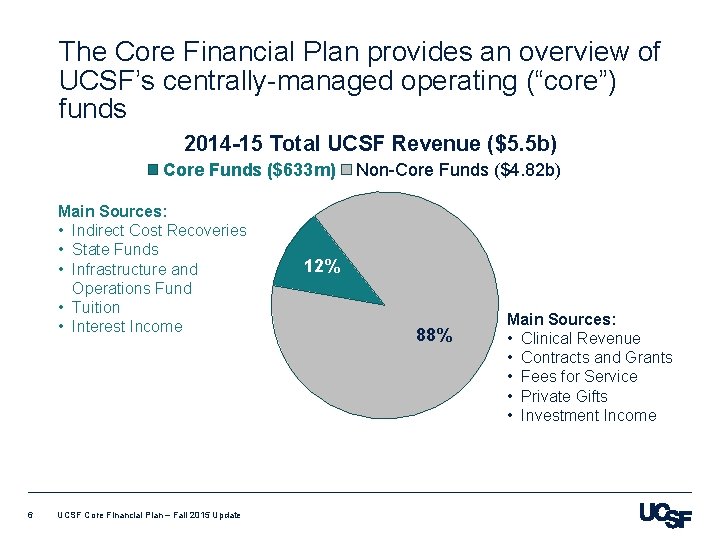
The Core Financial Plan provides an overview of UCSF’s centrally-managed operating (“core”) funds 2014 -15 Total UCSF Revenue ($5. 5 b) Core Funds ($633 m) Main Sources: • Indirect Cost Recoveries • State Funds • Infrastructure and Operations Fund • Tuition • Interest Income 6 UCSF Core Financial Plan – Fall 2015 Update Non-Core Funds ($4. 82 b) 12% 88% Main Sources: • Clinical Revenue • Contracts and Grants • Fees for Service • Private Gifts • Investment Income
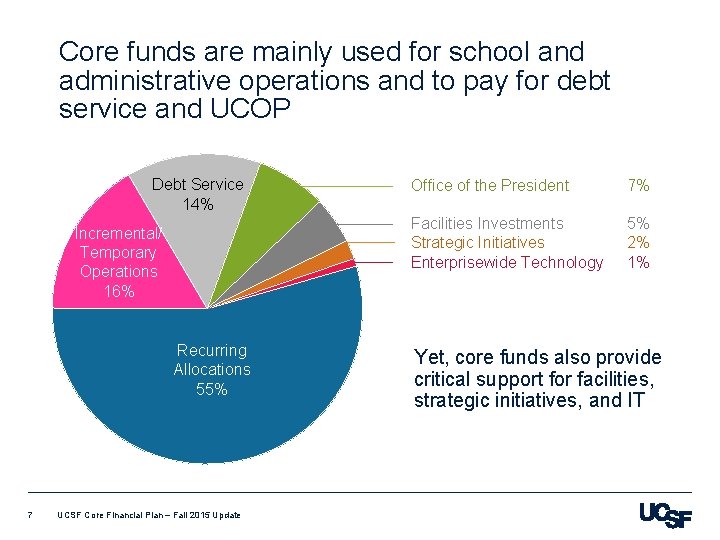
Core funds are mainly used for school and administrative operations and to pay for debt service and UCOP Debt Service 14% Incremental/ Temporary Operations 16% Recurring Allocations 55% 7 UCSF Core Financial Plan – Fall 2015 Update Office of the President 7% Facilities Investments Strategic Initiatives Enterprisewide Technology 5% 2% 1% Yet, core funds also provide critical support for facilities, strategic initiatives, and IT
2014 -15 Outcomes FALL 2015 UPDATE 8
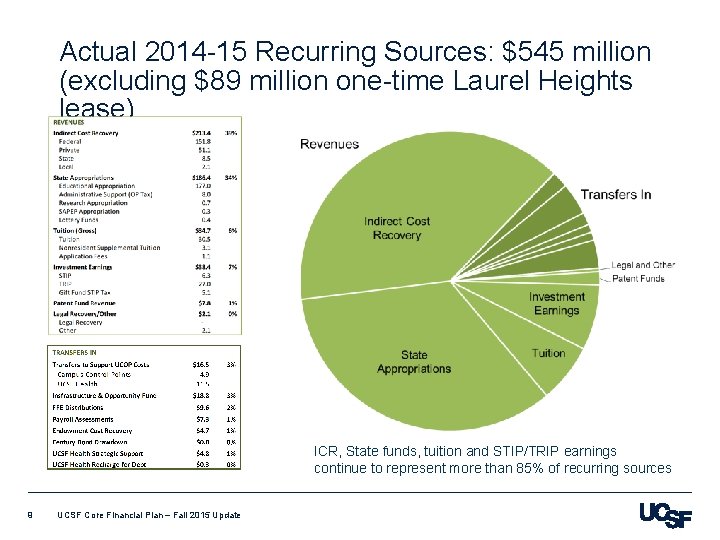
Actual 2014 -15 Recurring Sources: $545 million (excluding $89 million one-time Laurel Heights lease) ICR, State funds, tuition and STIP/TRIP earnings continue to represent more than 85% of recurring sources 9 UCSF Core Financial Plan – Fall 2015 Update
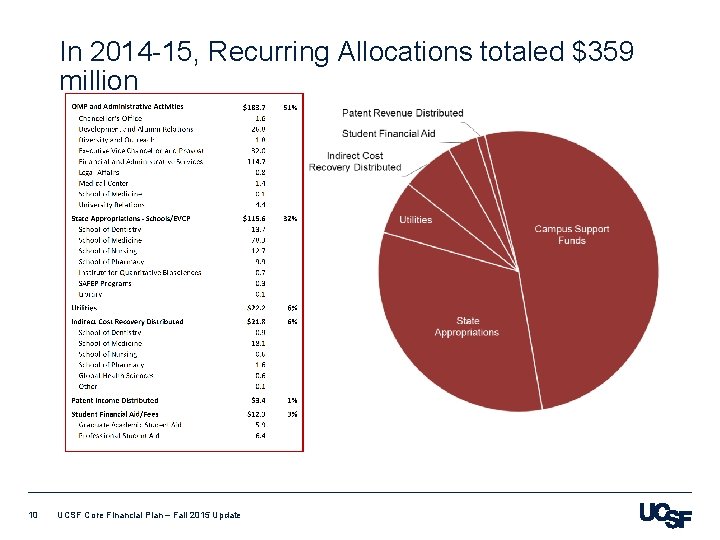
In 2014 -15, Recurring Allocations totaled $359 million 10 UCSF Core Financial Plan – Fall 2015 Update
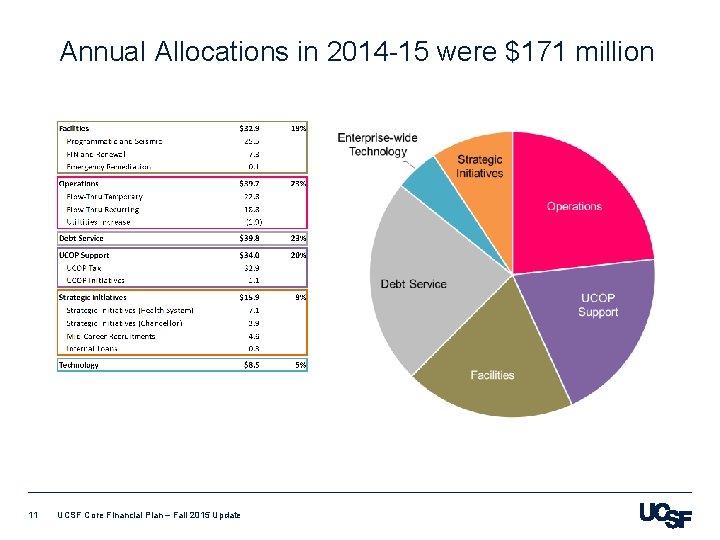
Annual Allocations in 2014 -15 were $171 million 11 UCSF Core Financial Plan – Fall 2015 Update
Core Financial Plan Changes 2015 -16 through 2024 -25 FALL 2015 UPDATE 12
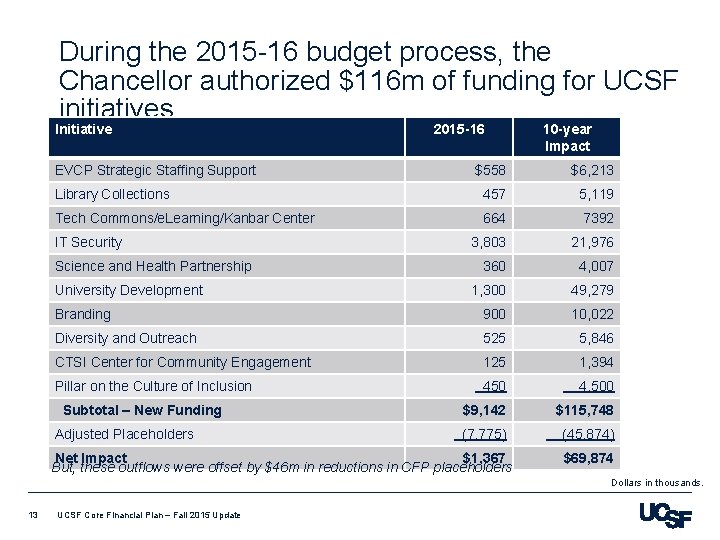
During the 2015 -16 budget process, the Chancellor authorized $116 m of funding for UCSF initiatives Initiative EVCP Strategic Staffing Support 2015 -16 10 -year Impact $558 $6, 213 Library Collections 457 5, 119 Tech Commons/e. Learning/Kanbar Center 664 7392 3, 803 21, 976 360 4, 007 1, 300 49, 279 Branding 900 10, 022 Diversity and Outreach 525 5, 846 CTSI Center for Community Engagement 125 1, 394 Pillar on the Culture of Inclusion 450 4, 500 $9, 142 $115, 748 (7, 775) (45, 874) IT Security Science and Health Partnership University Development Subtotal – New Funding Adjusted Placeholders Net Impact $1, 367 But, these outflows were offset by $46 m in reductions in CFP placeholders $69, 874 Dollars in thousands. 13 UCSF Core Financial Plan – Fall 2015 Update
Revenues and Allocations 2015 -16 through 2024 -25 FALL 2015 UPDATE 14 UCSF Core Financial Plan – Fall 2015 Update
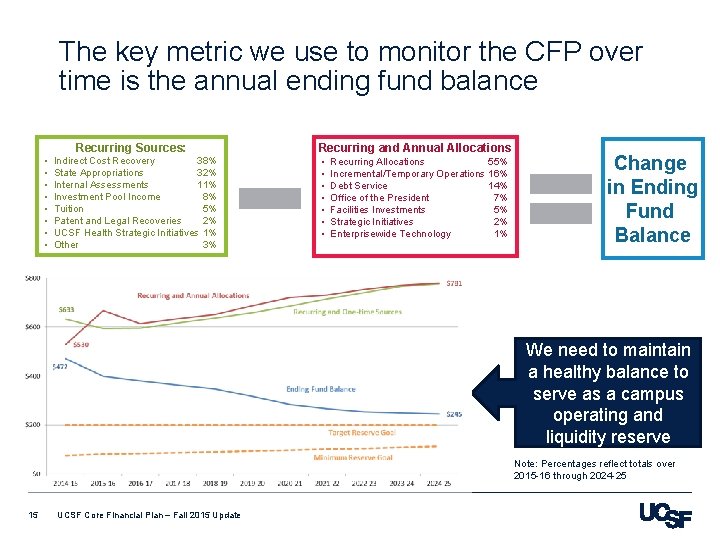
The key metric we use to monitor the CFP over time is the annual ending fund balance Recurring Sources: • • Indirect Cost Recovery 38% State Appropriations 32% Internal Assessments 11% Investment Pool Income 8% Tuition 5% Patent and Legal Recoveries 2% UCSF Health Strategic Initiatives 1% Other 3% Recurring and Annual Allocations • • Recurring Allocations 55% Incremental/Temporary Operations 16% Debt Service 14% Office of the President 7% Facilities Investments 5% Strategic Initiatives 2% Enterprisewide Technology 1% Change in Ending Fund Balance We need to maintain a healthy balance to serve as a campus operating and liquidity reserve Note: Percentages reflect totals over 2015 -16 through 2024 -25 15 UCSF Core Financial Plan – Fall 2015 Update
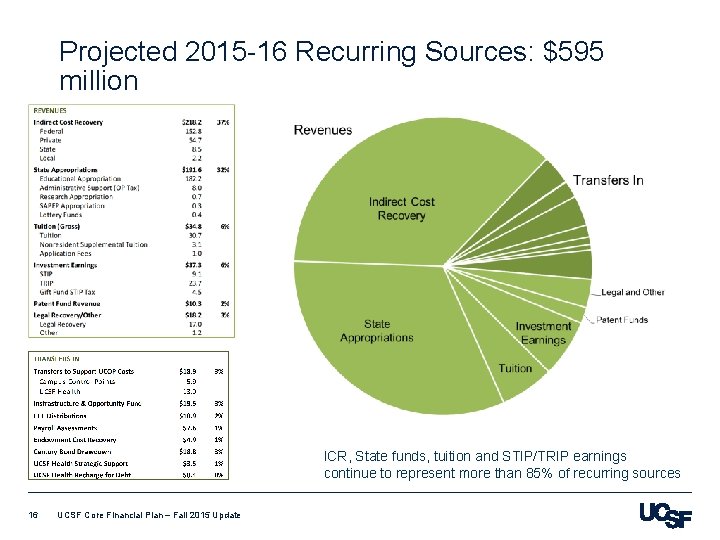
Projected 2015 -16 Recurring Sources: $595 million ICR, State funds, tuition and STIP/TRIP earnings continue to represent more than 85% of recurring sources 16 UCSF Core Financial Plan – Fall 2015 Update
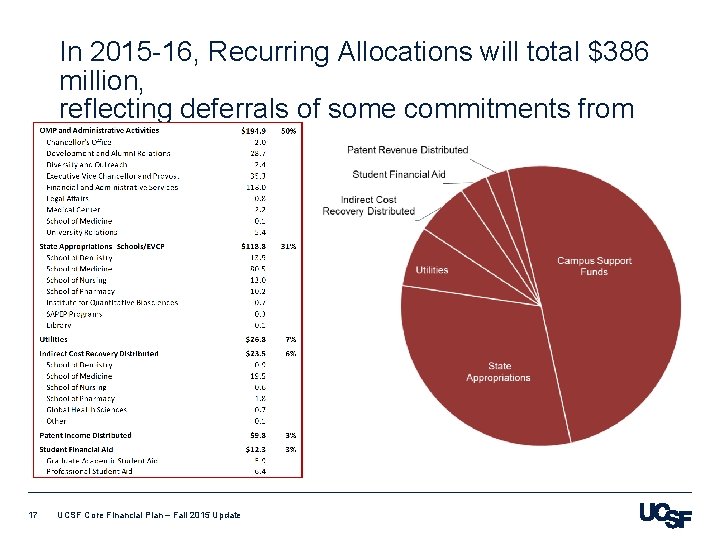
In 2015 -16, Recurring Allocations will total $386 million, reflecting deferrals of some commitments from 2014 -15 17 UCSF Core Financial Plan – Fall 2015 Update
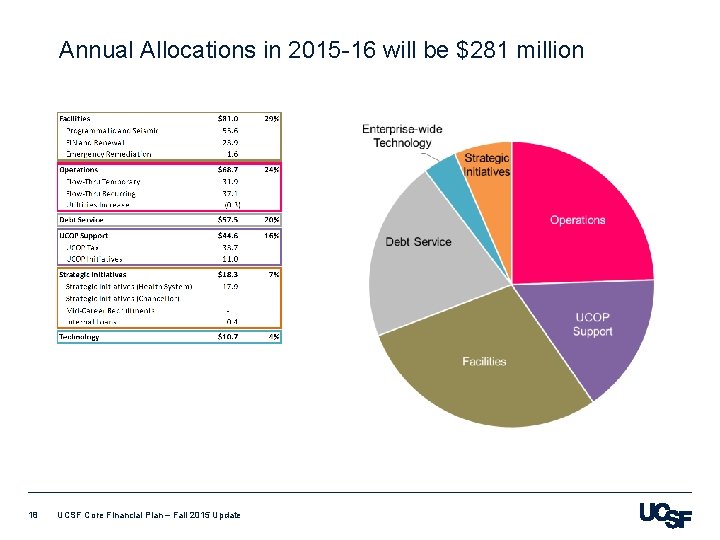
Annual Allocations in 2015 -16 will be $281 million 18 UCSF Core Financial Plan – Fall 2015 Update
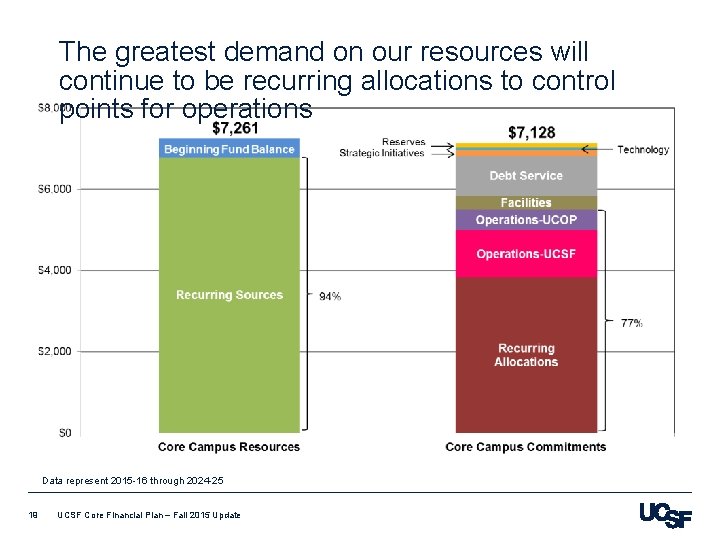
The greatest demand on our resources will continue to be recurring allocations to control points for operations Data represent 2015 -16 through 2024 -25 19 UCSF Core Financial Plan – Fall 2015 Update
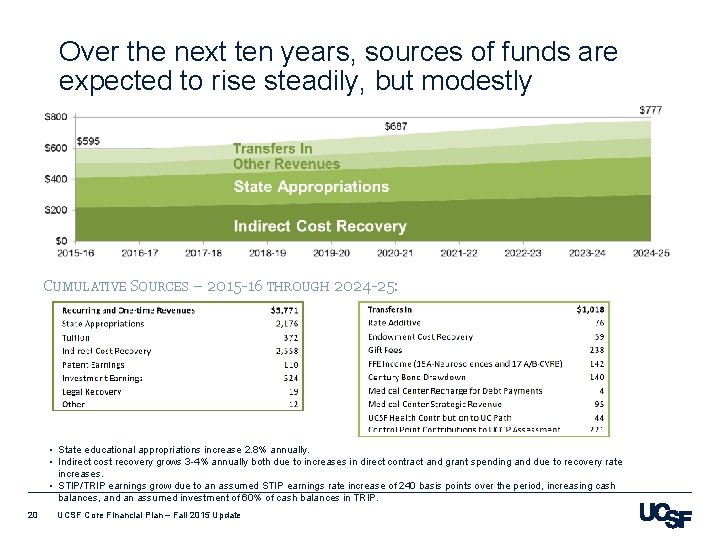
Over the next ten years, sources of funds are expected to rise steadily, but modestly CUMULATIVE SOURCES – 2015 -16 THROUGH 2024 -25: • State educational appropriations increase 2. 8% annually. • Indirect cost recovery grows 3 -4% annually both due to increases in direct contract and grant spending and due to recovery rate increases. • STIP/TRIP earnings grow due to an assumed STIP earnings rate increase of 240 basis points over the period, increasing cash balances, and an assumed investment of 60% of cash balances in TRIP. 20 UCSF Core Financial Plan – Fall 2015 Update
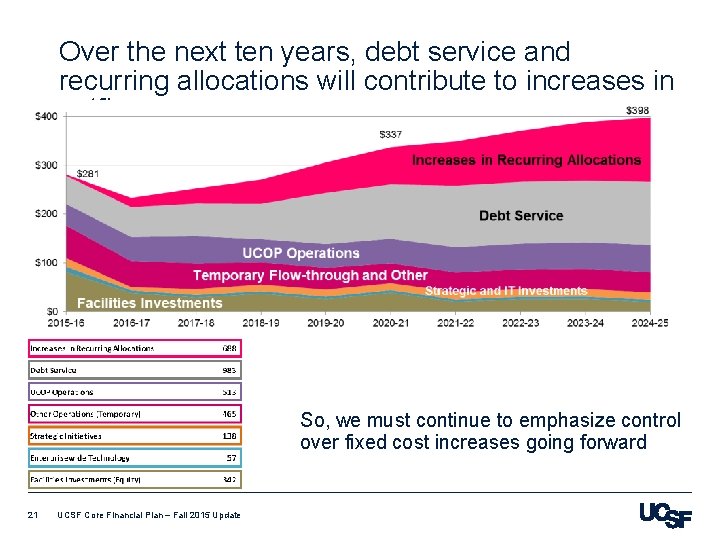
Over the next ten years, debt service and recurring allocations will contribute to increases in outflows So, we must continue to emphasize control over fixed cost increases going forward 21 UCSF Core Financial Plan – Fall 2015 Update
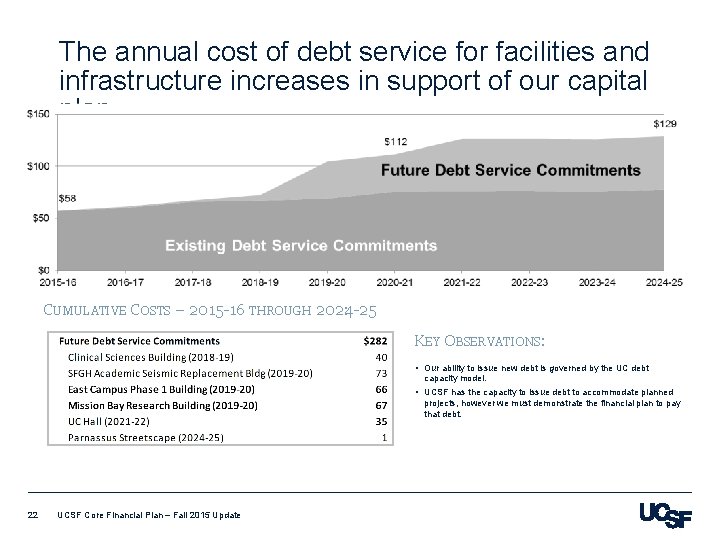
The annual cost of debt service for facilities and infrastructure increases in support of our capital plan CUMULATIVE COSTS – 2015 -16 THROUGH 2024 -25: CUMULATIVE COSTS – 2015 -16 THROUGH 2024 -25 : KEY OBSERVATIONS: • Our ability to issue new debt is governed by the UC debt capacity model. • UCSF has the capacity to issue debt to accommodate planned projects, however we must demonstrate the financial plan to pay that debt. 22 UCSF Core Financial Plan – Fall 2015 Update
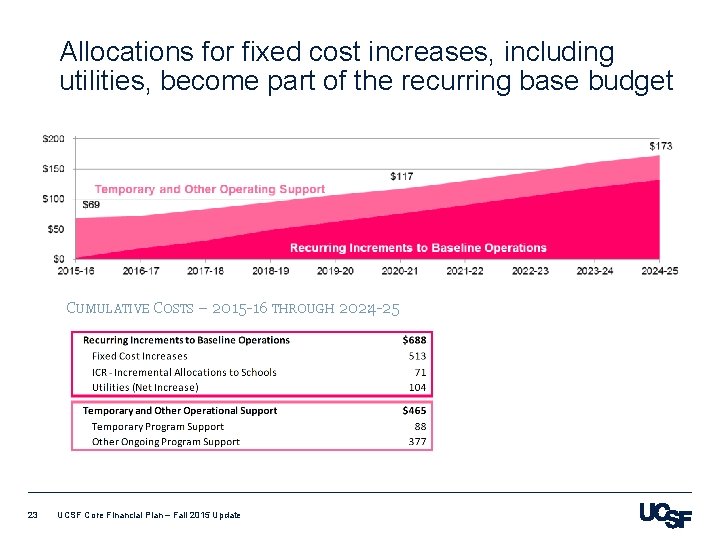
Allocations for fixed cost increases, including utilities, become part of the recurring base budget CUMULATIVE COSTS – 2015 -16 THROUGH 2024 -25 : 23 UCSF Core Financial Plan – Fall 2015 Update
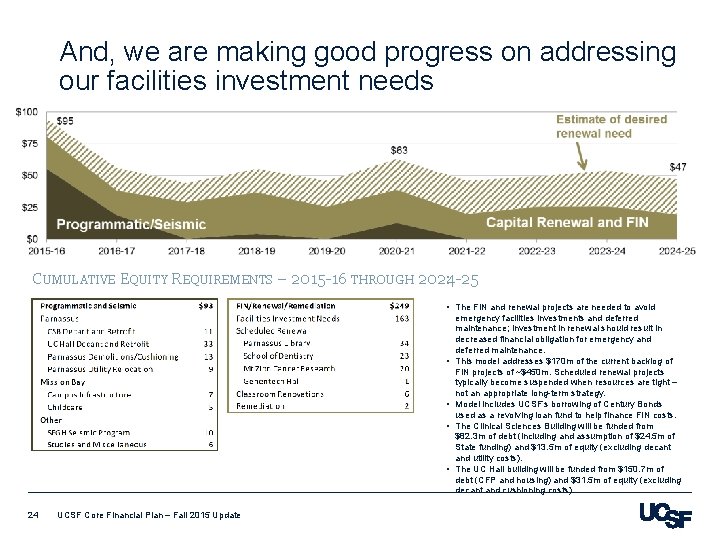
And, we are making good progress on addressing our facilities investment needs Capital Projects FIN and Renewal CUMULATIVE EQUITY REQUIREMENTS – 2015 -16 THROUGH 2024 -25 : • The FIN and renewal projects are needed to avoid • • 24 UCSF Core Financial Plan – Fall 2015 Update emergency facilities investments and deferred maintenance; investment in renewal should result in decreased financial obligation for emergency and deferred maintenance. This model addresses $170 m of the current backlog of FIN projects of ~$450 m. Scheduled renewal projects typically become suspended when resources are tight – not an appropriate long-term strategy. Model includes UCSF’s borrowing of Century Bonds used as a revolving loan fund to help finance FIN costs. The Clinical Sciences Building will be funded from $82. 3 m of debt (including and assumption of $24. 5 m of State funding) and $13. 5 m of equity (excluding decant and utility costs). The UC Hall building will be funded from $150. 7 m of debt (CFP and housing) and $31. 5 m of equity (excluding decant and cushioning costs).
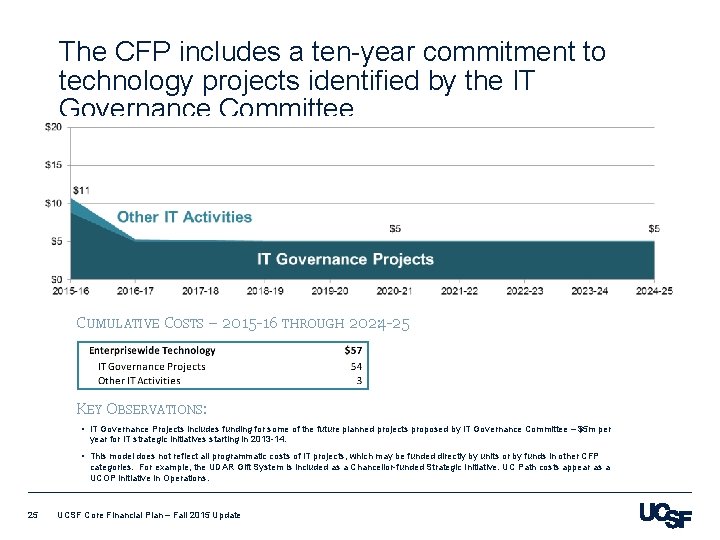
The CFP includes a ten-year commitment to technology projects identified by the IT Governance Committee CUMULATIVE COSTS – 2015 -16 THROUGH 2024 -25 : KEY OBSERVATIONS: • IT Governance Projects includes funding for some of the future planned projects proposed by IT Governance Committee – $5 m per year for IT strategic initiatives starting in 2013 -14. • This model does not reflect all programmatic costs of IT projects, which may be funded directly by units or by funds in other CFP categories. For example, the UDAR Gift System is included as a Chancellor-funded Strategic Initiative. UC Path costs appear as a UCOP initiative in Operations. 25 UCSF Core Financial Plan – Fall 2015 Update
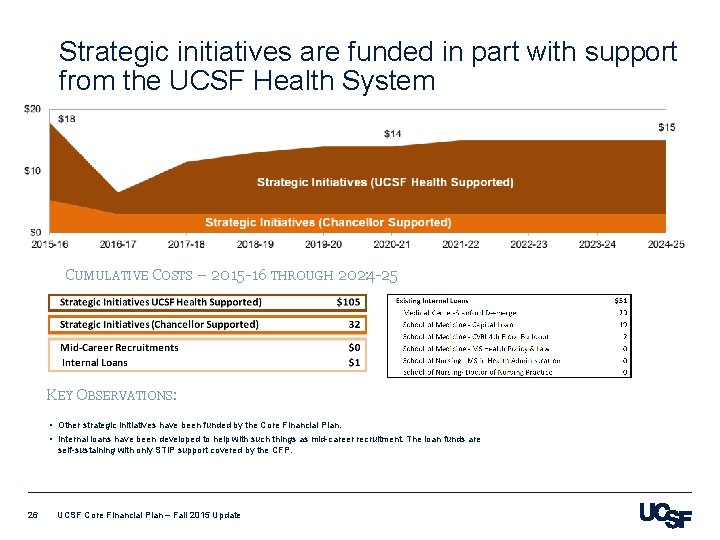
Strategic initiatives are funded in part with support from the UCSF Health System CUMULATIVE COSTS – 2015 -16 THROUGH 2024 -25 : KEY OBSERVATIONS: • Other strategic initiatives have been funded by the Core Financial Plan. • Internal loans have been developed to help with such things as mid-career recruitment. The loan funds are self-sustaining with only STIP support covered by the CFP. 26 UCSF Core Financial Plan – Fall 2015 Update
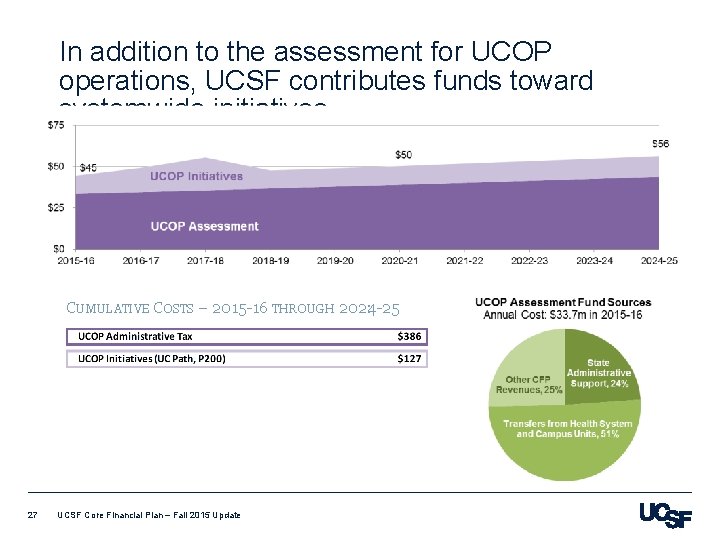
In addition to the assessment for UCOP operations, UCSF contributes funds toward systemwide initiatives CUMULATIVE COSTS – 2015 -16 THROUGH 2024 -25 : 27 UCSF Core Financial Plan – Fall 2015 Update
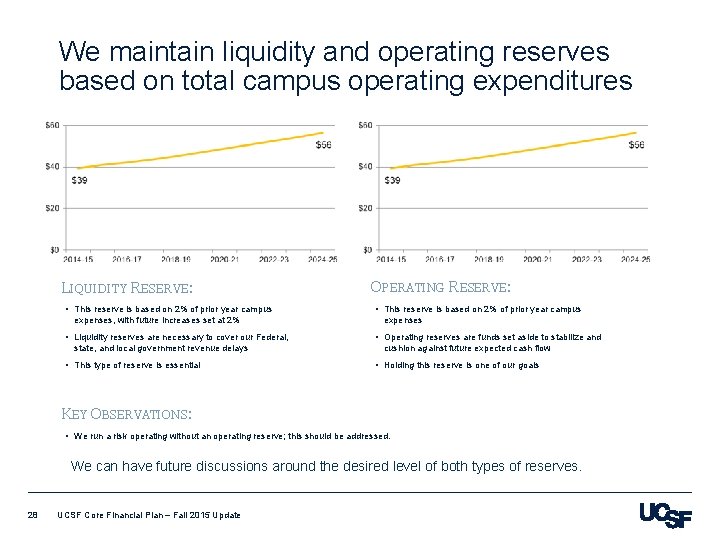
We maintain liquidity and operating reserves based on total campus operating expenditures LIQUIDITY RESERVE: • This reserve is based on 2% of prior year campus expenses, with future increases set at 2% • Liquidity reserves are necessary to cover our Federal, state, and local government revenue delays • This type of reserve is essential OPERATING RESERVE: • This reserve is based on 2% of prior year campus expenses • Operating reserves are funds set aside to stabilize and cushion against future expected cash flow • Holding this reserve is one of our goals KEY OBSERVATIONS: • We run a risk operating without an operating reserve; this should be addressed. We can have future discussions around the desired level of both types of reserves. 28 UCSF Core Financial Plan – Fall 2015 Update
UCSF Core Financial Plan POTENTIAL UPSIDE AND DOWNSIDE TO THE BASE CASE 29 UCSF Core Financial Plan – Fall 2015 Update
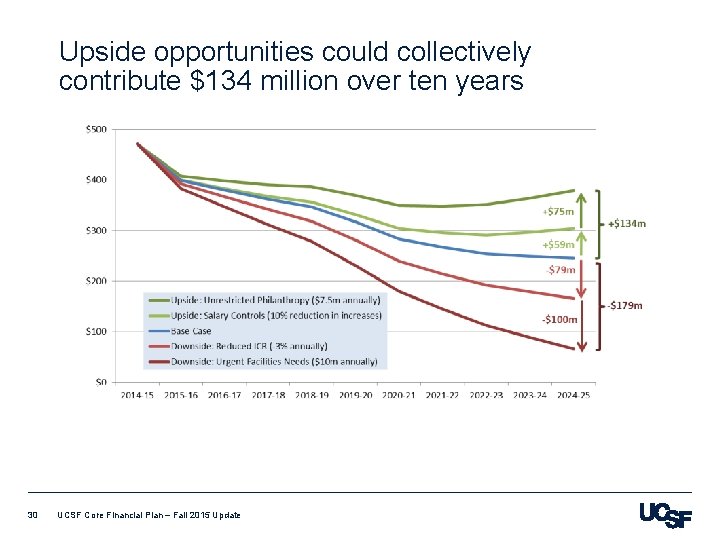
Upside opportunities could collectively contribute $134 million over ten years 30 UCSF Core Financial Plan – Fall 2015 Update
UCSF Core Financial Plan APPENDIX WORKSHEETS AND ASSUMPTIONS 31 UCSF Core Financial Plan – Fall 2015 Update
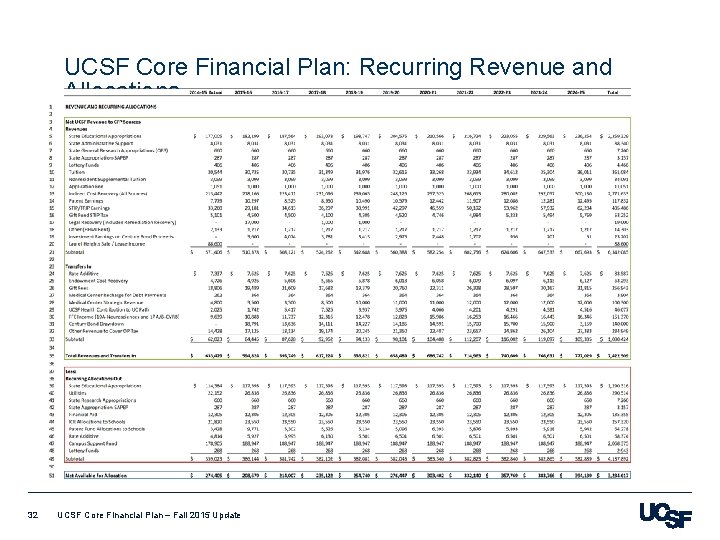
UCSF Core Financial Plan: Recurring Revenue and Allocations 32 UCSF Core Financial Plan – Fall 2015 Update
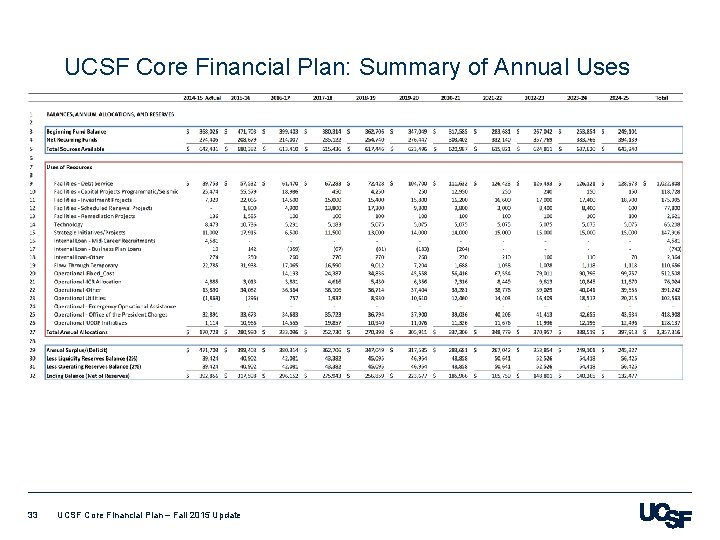
UCSF Core Financial Plan: Summary of Annual Uses 33 UCSF Core Financial Plan – Fall 2015 Update
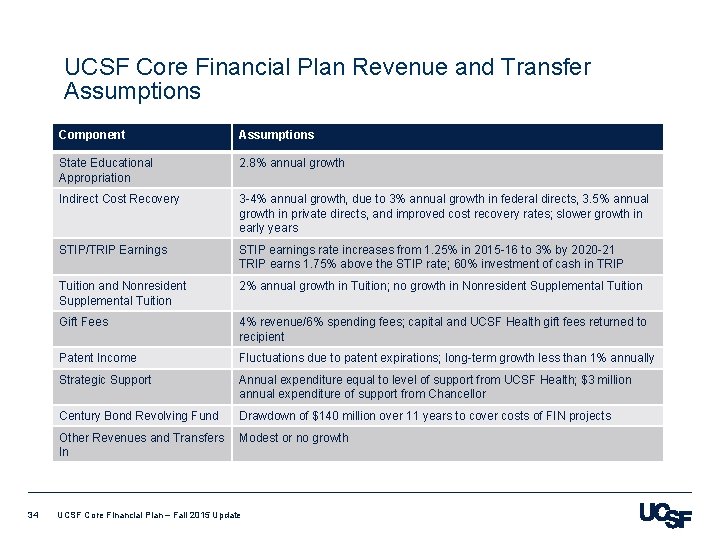
UCSF Core Financial Plan Revenue and Transfer Assumptions 34 Component Assumptions State Educational Appropriation 2. 8% annual growth Indirect Cost Recovery 3 -4% annual growth, due to 3% annual growth in federal directs, 3. 5% annual growth in private directs, and improved cost recovery rates; slower growth in early years STIP/TRIP Earnings STIP earnings rate increases from 1. 25% in 2015 -16 to 3% by 2020 -21 TRIP earns 1. 75% above the STIP rate; 60% investment of cash in TRIP Tuition and Nonresident Supplemental Tuition 2% annual growth in Tuition; no growth in Nonresident Supplemental Tuition Gift Fees 4% revenue/6% spending fees; capital and UCSF Health gift fees returned to recipient Patent Income Fluctuations due to patent expirations; long-term growth less than 1% annually Strategic Support Annual expenditure equal to level of support from UCSF Health; $3 million annual expenditure of support from Chancellor Century Bond Revolving Fund Drawdown of $140 million over 11 years to cover costs of FIN projects Other Revenues and Transfers In Modest or no growth UCSF Core Financial Plan – Fall 2015 Update
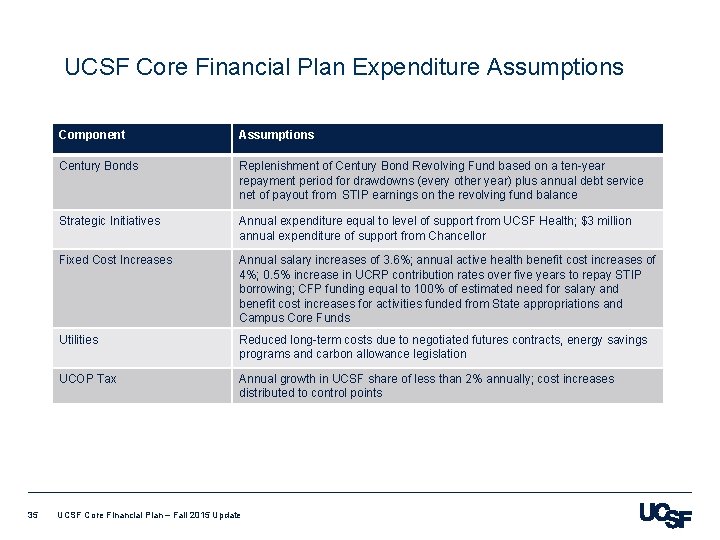
UCSF Core Financial Plan Expenditure Assumptions 35 Component Assumptions Century Bonds Replenishment of Century Bond Revolving Fund based on a ten-year repayment period for drawdowns (every other year) plus annual debt service net of payout from STIP earnings on the revolving fund balance Strategic Initiatives Annual expenditure equal to level of support from UCSF Health; $3 million annual expenditure of support from Chancellor Fixed Cost Increases Annual salary increases of 3. 6%; annual active health benefit cost increases of 4%; 0. 5% increase in UCRP contribution rates over five years to repay STIP borrowing; CFP funding equal to 100% of estimated need for salary and benefit cost increases for activities funded from State appropriations and Campus Core Funds Utilities Reduced long-term costs due to negotiated futures contracts, energy savings programs and carbon allowance legislation UCOP Tax Annual growth in UCSF share of less than 2% annually; cost increases distributed to control points UCSF Core Financial Plan – Fall 2015 Update