U S Population Projections Three population scenarios for


 New Zealand 2. 03 children born/woman (2016 est.")


 16. 0")


- Slides: 54
U. S. Population Projections Three population scenarios for the United States based on differing fertilities rates and immigration of 450, 000 persons per year. (Redrawn from Westoff, C. F. “Fertility in the United States. ” Science 234: 554 -559. )
Birthrate B K Population Density Mortality Rate M
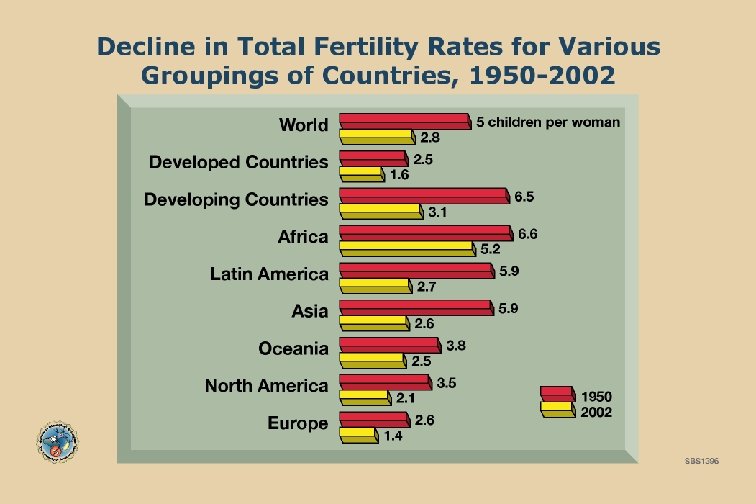
Average Annual Rate of Population for Various Groups of Countries in 1993 (Data from Population Reference Bureau)
Developing Countries Rate per 1, 000 people 50 Crude Birth Rate 40 30 Rate of Natural Increase Crude Death Rate 20 10 0 1775 1800 1850 1900 Year 1950 2000 2050
Developed Countries 50 Rate per 1, 000 people Rate of Natural Increase = Crude Birth Rate – Crude Death Rate 40 Rate of Natural Increase 30 Crude Birth Rate 20 Crude Death Rate 10 0 1775 1800 1850 1900 Year 1950 2000 2050
50 Birth Rate 40 30 20 Rate of Natural Increase Death Rate 10 0 1800 1850 1900 1975 Overall Population Increase Rate per 1, 000 people Birth and Death Rates in Mexico, 1900 to 1995 2000 Time Both birth and death rates decline during the 20 th century, but because the death rates declined much more than the birth rate, Mexico has experienced a high growth rate. (The high death rate prior to 1920 was caused by the Mexican Revolution. )
Country Total Fertility Rate (children born/woman) New Zealand 2. 03 children born/woman (2016 est. ) Nicaragua 1. 92 children born/woman (2016 est. ) Nigeria 5. 13 children born/woman (2016 est. ) Niger 6. 62 children born/woman (2016 est. )
Number of Children a Woman Has Varies with Education 3. 2 Children Born per Woman 2. 8 2. 4 2 1. 6 1. 2 0. 8 0. 4 0 Not high School graduate High School graduate College 4 years College 5+ years Shown are the 1987 fertility rates for 35 - to 44 -year-old women in the United States with differing levels of education.
Projected Changes in the Ethnic Composition of the U. S. Population Between 1980 and 2080 In 1980 In 2080 (If current trends continue) Whites 79. 9% Whites 49. 9% Blacks 11. 7% Asians, others 2. 0% Asians, others 12. 0% Hispanics 23. 4% Blacks 14. 7% Hispanics 6. 4% (Data from the Population Reference Bureau)
Patterns of World Urbanization from 1900 to 1985 with Projections to 2020 Rural Cities less than 1 million 2020 Cities more than 1 million 1985 1900 56. 7 1. 6 27. 5 15. 8 12 7. 5 35. 4 27. 1 71. 1 86. 4 1. 6 37. 5 1950 21. 4 2. 5 4. 9 8. 1 World Population in Billions (percent) Data from United Nations and Population Reference Bureau
Urbanization of Various Groups of Countries, 1950 - 2000 29% World 41% 48% 64% North America 61% Oceania 77% 78% 70% 73% 56% Europe 75% 79% 39% USSR 66% 74% 41% Latin America 69% 77% 20% Asia 29% 55% 15% Africa 31% 42% 1950 1990 2000 (Data from United Nations and Population Reference Bureau)
Tracking the Baby-boom Generation Age structure of the U. S. Population in 1955, 1985, 2015 and 2035 (Data from Population Reference Bureau and U. S. Census Bureau)
Population Types Postreproductive Reproductive Prereproductive A Expanding B Stable C Diminishing Age structure of populations: (A) an expanding population, with a very large proportion of young individuals; (B) a stable population, with relatively equal prereproductive and reproductive age groups; and ( C) a diminishing population, with a low percentage of young individuals.
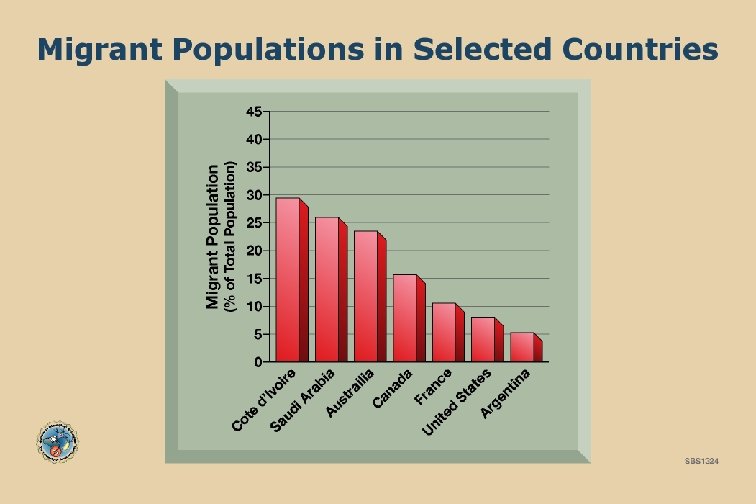
Population Age Structure Diagrams for Countries with Rapid, Slow, Zero, and Negative Population Growth Rates Male Female Rapid Growth Kenya Nigeria Saudi Arabia Male Female Slow Growth United States Australia Canada Male Female Zero Growth Denmark Austria Italty Bottom portions represent prereproductive years (ages 0 -14), middle portions represent reproductive years (ages 15 -44), and top portions represent postreproductive years (ages 45 -85+). (Data from Population Reference Bureau) Male Female Negative Growth Germany Bulgaria Hungary Ages 45 - 85+ Ages 15 - 44 Ages 0 - 14
Approximate Age Distribution in the United States at the Present Time and in 2050 Age Class (years) Today (percent) 2050 (percent) 0 -17 26. 5 24. 0 18 -44 42. 8 35. 3 45 -64 18. 9 23. 7 65 and over 11. 8 17. 0 Assuming a stationary population size of about 275 million. Based on pages 6 -7 of the Statistical Abstract of the United States, 97 th ed. , Bureau of the Census, 1976. Current age distribution is from table 25, Statistical Abstract of the United States, 106 th ed. , 1985.
Projected Chinese Population in 2032 If Fertility Rate Reached 1. 0 by 1992 Age 75+ 70– 74 65– 69 60– 64 55– 59 50– 54 Males 45– 49 Females 40– 44 35– 39 30– 34 25– 29 20– 24 15– 19 10– 14 5– 9 0– 4 60 40 20 0 0 20 Population (Millions) 40 60 (Source: H. Yuan Tien, Population Today, April 1984, p. 7)
Chinese Birth Planning Campaigns
Answer: The information provided allows us to set up the following 1 xmx table, from which R 0 is computed: x (years) 1 x mx 0 1 2 3 4 1. 0 0. 5 0. 25 0. 125 0 0 3 3 3 0 1 xmx 0 1. 5 0. 75 0. 375 0 R 0=2. 625
Reproductive Parameters for Daphnia magna Cohorts Fed a Range of Chlamydomonas Concentrations at 20 o. C Food Concentration (Cells cm– 3) 103 Percent Reproducing 50 104 87 105 106 97 50 Eggs per Brood 2. 8 2. 6 15. 5 21. 1 Broods per Female 1. 7 7. 5 8. 2 3. 4 Days Between Broods 5. 4 3. 6 3. 1 3. 3 23. 4 16. 9 9. 8 9. 1 Age at First Brood (days) Net Reproductive Rate (R 0) 2. 25 16. 23 99. 33 34. 80 Exponential Rate of Increase ( r ) 0. 03 0. 10 0. 28 0. 20 Source: Porter et al. 1983.
1000 Rotifer Human Number of Survivors Hydra Gull 100 Black-tail Deer 10 Oyster 1 0 20 40 60 Percent of Total Life Span 80 100
1000 700 500 Number of Survivors 300 100 70 50 30 Human female 10 7 5 Human male Black-tail female 3 1 Black-tail Male 0 10 20 30 40 50 60 70 Percent of Total Life Span 80 90 100
1000 700 500 Number of Survivors 300 100 70 50 30 Wild-type 10 7 5 Quintuple Speck 3 1 Vestigial 0 10 20 30 40 50 60 70 Percent of Total Life Span 80 90 100
Survivorship Curves For the Population of Sweden over Several Centuries 1000 Survivors per 1, 000 Live Births 1959 1931 -1940 800 1891 -1900 600 1816 -1840 400 1757 -1763 200 0 0 20 40 60 Age (Years) 80 100 Note that as health conditions improved and the standard of living increased over the years, the survivorship curves began to approach physiological life span, changing from concave to convex. (From Clark, 1967)
17. 5 Norway 17. 0 16. 5 Germany Age at Menarche (Years) 16. 0 Finland Sweden 15. 5 15. 0 14. 5 U. S. A. 14. 0 Denmark 13. 5 Great Britain 13. 0 1840 1860 1880 1900 Year of Menarche 1920 1940 1960
Illustration of the Calculation of Ex in a Hypothetical Stable Population with Discrete Age Classes, Using Equations (1) to (4) Age (x) Survivorship (lx ) Expectation of Life Ex (see below) 0 1 2 3 4 5 6 1. 0 0. 8 0. 6 0. 4 0. 2 0. 0 3. 40 3. 00 2. 67 2. 50 1. 00 0. 00 Expectation of life: E 0 = (l 0 + l 1 + l 2 + l 3 + l 4 + l 5 ) = (1. 0 + 0. 8 + 0. 6 + 0. 4 + 0. 2)/1. 0 = 3. 4/1. 0 E 1 = (l 1 + l 2 + l 3 + l 4 + l 5)/l 1 = (0. 8 + 0. 6 + 0. 4 + 0. 2)/0. 8 = 2. 4/0. 8 = 3. 0 E 2 = (l 2 + l 3 + l 4 + l 5)/l 2 = (0. 6 + 0. 4 + 0. 2)/0. 6 = 1. 6/0. 6 = 2. 67 E 3 = (l 3 + l 4 + l 5)/l 3 = (0. 4 + 0. 2)/0. 4 = 1. 0/0. 4 = 2. 5 E 4 = (l 4 + l 5)/l 4 = (0. 4 + 0. 2)/0. 4 = 0. 6/0. 4 = 1. 5 E 5 = l 5/l 5 = 0. 2/0. 2 = 1. 0
The Common Mud Turtle’s Generation Time is Close to that of Other Organisms of Similar Size 100 m Kelp Whale 10 m Length 10 cm 1 m Birch Balsam Horse fly House fly Clam Drosophila Daphnia 1 mm 10 m Sequoia Dogwood Rhino Elephant Elk Bear Man Deer Snake Fox Beaver Salamander Rat Horseshoe crab Crab Turtle Mouse Newt Scallop Frog Snail Chameleon Bee Oyster 1 m 100 m Fir Stentor Paramecium Tetrahymena Didinium Euglena Spirochaeta E. coli Pseudomonas B. aureus 1 1 ho ur da y 1 1 w ee k 1 m on th Generation time 10 ye a r 10 ye 0 ar s ye ar s
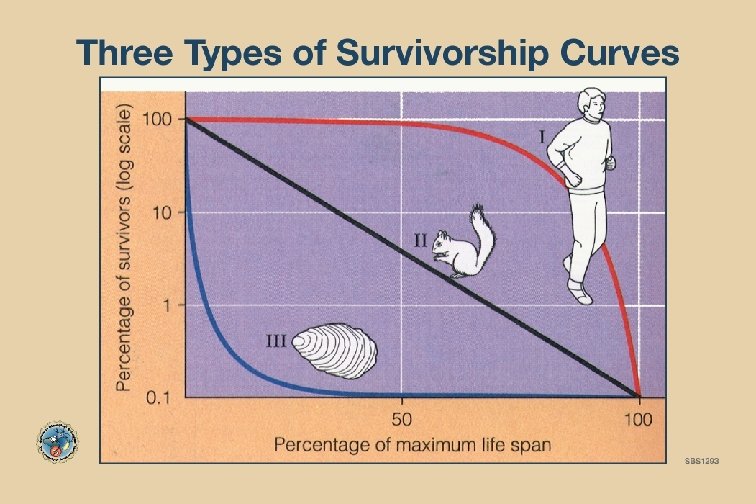
Ranges of Reproductive Strategies R-Selected Number of Offspring Number of times an Individual reproduces Size of young Rate of development Parental care Life span Survivorship curve Energy to reproduction Energy to increasing Body size Examples Animals Plants K-Selected many few once many times small large fast slow minimal intensive short long Type III Type I high low high oysters weeds insects saguaro birds oaks elephants humans pears mangroves