
U S General Services Administration Do D Travel

- Slides: 14
U. S. General Services Administration Do. D Travel Card Program Update August 4 -6, 2020 presented by Alec Cloyd
Agenda • • • Policy/Program Changes Since 2019 Forum Citibank TS 2 Migration Observations State of the Program / Key Metrics Questions & Answers References 2
Key Policy/Program Changes Since 2019 Forum • Creditworthiness Evaluations – effective October 2019 – If applicant declines credit score check by Citibank, they must provide an alternate creditworthiness assessment • Required by OMB Circular A-123, Appendix B • DD Form 2883 is the alternate assessment for the Do. D – If applicant is unsure of ability to qualify, recommend they obtain free credit score before applying – Also, a reminder to utilize the account upgrade option to move from a restricted account to a standard account • Requires less maintenance by APCs 3
Key Policy/Program Changes Since 2019 Forum • Creditworthiness Score Thresholds – effective March 2020 – Removed the previous lower score threshold of 500 as qualifying; New score threshold scores are • Standard = 660+ • Restricted = 659 or below – This aligns the Do. D with the rest of the Federal Government Smart. Pay Agencies – Should result in more card issuance, more GTCC spend, and higher GTCC rebates 4
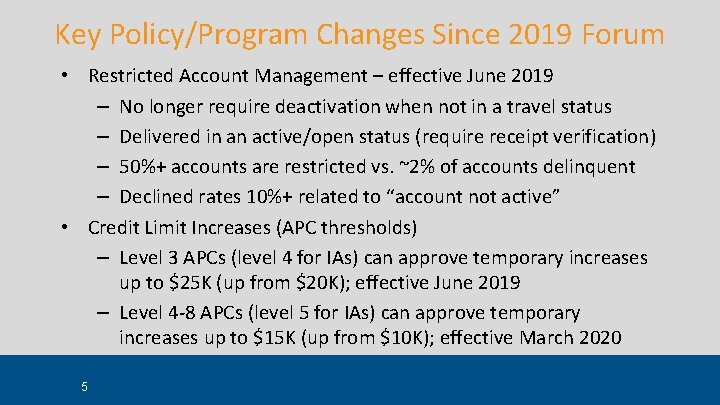
Key Policy/Program Changes Since 2019 Forum • Restricted Account Management – effective June 2019 – No longer require deactivation when not in a travel status – Delivered in an active/open status (require receipt verification) – 50%+ accounts are restricted vs. ~2% of accounts delinquent – Declined rates 10%+ related to “account not active” • Credit Limit Increases (APC thresholds) – Level 3 APCs (level 4 for IAs) can approve temporary increases up to $25 K (up from $20 K); effective June 2019 – Level 4 -8 APCs (level 5 for IAs) can approve temporary increases up to $15 K (up from $10 K); effective March 2020 5
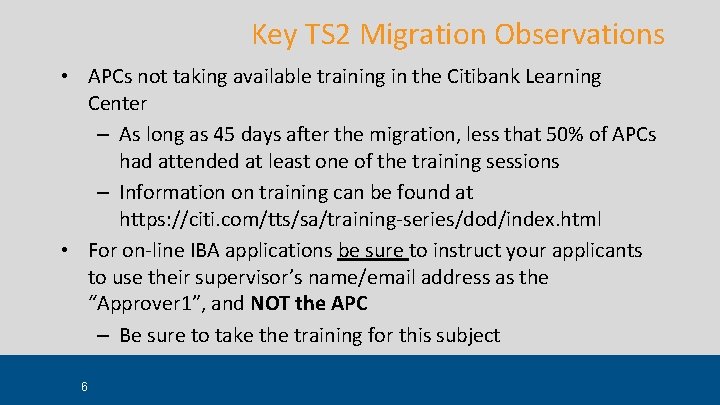
Key TS 2 Migration Observations • APCs not taking available training in the Citibank Learning Center – As long as 45 days after the migration, less that 50% of APCs had attended at least one of the training sessions – Information on training can be found at https: //citi. com/tts/sa/training-series/dod/index. html • For on-line IBA applications be sure to instruct your applicants to use their supervisor’s name/email address as the “Approver 1”, and NOT the APC – Be sure to take the training for this subject 6
State of the Program • Most recent key metrics / size of the program • Spend breakdown by merchant category groups • Citibank call center statistics 7
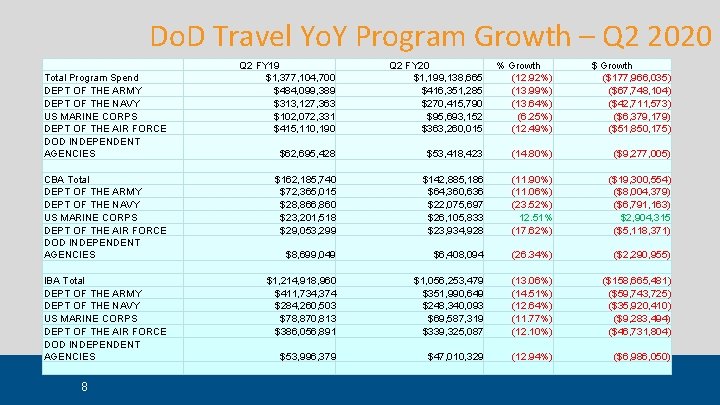
Do. D Travel Yo. Y Program Growth – Q 2 2020 Total Program Spend DEPT OF THE ARMY DEPT OF THE NAVY US MARINE CORPS DEPT OF THE AIR FORCE DOD INDEPENDENT AGENCIES CBA Total DEPT OF THE ARMY DEPT OF THE NAVY US MARINE CORPS DEPT OF THE AIR FORCE DOD INDEPENDENT AGENCIES IBA Total DEPT OF THE ARMY DEPT OF THE NAVY US MARINE CORPS DEPT OF THE AIR FORCE DOD INDEPENDENT AGENCIES 8 Q 2 FY 19 $1, 377, 104, 700 $484, 099, 389 $313, 127, 363 $102, 072, 331 $415, 110, 190 Q 2 FY 20 $1, 199, 138, 665 $416, 351, 285 $270, 415, 790 $95, 693, 152 $363, 260, 015 % Growth (12. 92%) (13. 99%) (13. 64%) (6. 25%) (12. 49%) $ Growth ($177, 966, 035) ($67, 748, 104) ($42, 711, 573) ($6, 379, 179) ($51, 850, 175) $53, 418, 423 (14. 80%) ($9, 277, 005) $142, 885, 186 $64, 360, 636 $22, 075, 697 $26, 105, 833 $23, 934, 928 (11. 90%) (11. 06%) (23. 52%) 12. 51% (17. 62%) ($19, 300, 554) ($8, 004, 379) ($6, 791, 163) $2, 904, 315 ($5, 118, 371) $6, 408, 094 (26. 34%) ($2, 290, 955) $1, 214, 918, 960 $411, 734, 374 $284, 260, 503 $78, 870, 813 $386, 056, 891 $1, 056, 253, 479 $351, 990, 649 $248, 340, 093 $69, 587, 319 $339, 325, 087 (13. 06%) (14. 51%) (12. 64%) (11. 77%) (12. 10%) ($158, 665, 481) ($59, 743, 725) ($35, 920, 410) ($9, 283, 494) ($46, 731, 804) $53, 996, 379 $47, 010, 329 (12. 94%) ($6, 986, 050) $62, 695, 428 $162, 185, 740 $72, 365, 015 $28, 866, 860 $23, 201, 518 $29, 053, 299 $8, 699, 049
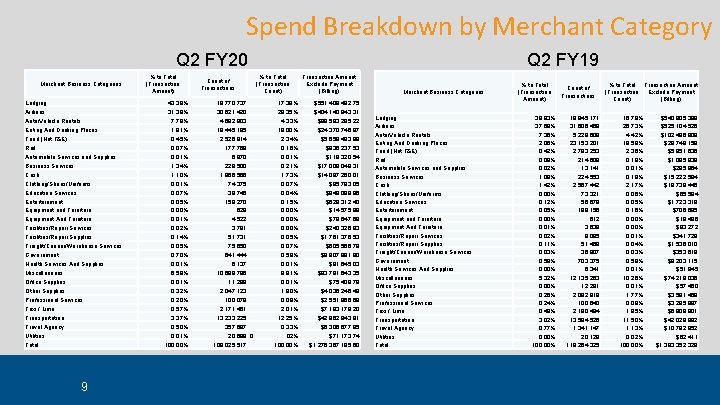
Spend Breakdown by Merchant Category Q 2 FY 20 Merchant Business Categories Lodging Airlines Auto/Vehicle Rentals Eating And Drinking Places Food (Not T&E) Rail Automobile Services and Supplies Business Services Cash Clothing/Shoes/Uniforms Education Services Entertainment Equipment and Furniture Equipment And Furniture Facilities/Repair Services Facilities/Repair Supplies Freight/Courier/Warehouse Services Government Health Services And Supplies Miscellaneous Office Supplies Other Supplies Professional Services Taxi / Limo Transportation Travel Agency Utilities Total % to Total (Transaction Amount) 43. 38% 31. 39% 7. 78% 1. 91% 0. 45% 0. 07% 0. 01% 1. 34% 1. 10% 0. 01% 0. 07% 0. 05% 0. 00% 0. 01% 0. 02% 0. 14% 0. 05% 0. 70% 0. 01% 6. 58% 0. 01% 0. 32% 0. 20% 0. 57% 3. 37% 0. 50% 0. 01% 100. 00% 9 Count of Transactions % to Total (Transaction Count) 18, 770, 737 17. 38% 30, 621, 420 28. 35% 4, 682, 803 4. 33% 19, 445, 195 18. 00% 2, 526, 914 2. 34% 177, 769 0. 16% 6, 970 0. 01% 229, 500 0. 21% 1, 866, 566 1. 73% 74, 375 0. 07% 39, 746 0. 04% 158, 270 0. 15% 629 0. 00% 4, 522 0. 00% 3, 791 0. 00% 51, 731 0. 05% 75, 650 0. 07% 641, 444 0. 59% 6, 137 0. 01% 10, 699, 786 9. 91% 11, 288 0. 01% 2, 047, 123 1. 90% 100, 079 0. 09% 2, 171, 461 2. 01% 13, 233, 225 12. 25% 357, 697 0. 33% 20, 689 0. 02% 108, 025, 517 Q 2 FY 19 100. 00% Transaction Amount Exclude Payment (Billing) $551, 408, 492. 75 $404, 140, 843. 31 $98, 583, 295. 22 $24, 370, 746. 97 $5, 659, 483. 89 $836, 237. 53 $119, 320. 54 $17, 008, 049. 31 $14, 097, 260. 01 $95, 783. 05 $848, 099. 86 $629, 312. 40 $14, 575. 88 $79, 647. 69 $240, 326. 93 $1, 761, 376. 53 $605, 566. 79 $8, 907, 981. 80 $81, 645. 03 $83, 781, 643. 35 $75, 408. 79 $4, 036, 246. 48 $2, 551, 866. 69 $7, 193, 179. 20 $42, 862, 943. 91 $6, 306, 677. 95 $71, 173. 74 $1, 276, 367, 185. 60 Merchant Business Categories Lodging Airlines Auto/Vehicle Rentals Eating And Drinking Places Food (Not T&E) Rail Automobile Services and Supplies Business Services Cash Clothing/Shoes/Uniforms Education Services Entertainment Equipment and Furniture Equipment And Furniture Facilities/Repair Services Facilities/Repair Supplies Freight/Courier/Warehouse Services Government Health Services And Supplies Miscellaneous Office Supplies Other Supplies Professional Services Taxi / Limo Transportation Travel Agency Utilities Total % to Total (Transaction Amount) 38. 83% 37. 68% 7. 36% 2. 06% 0. 42% 0. 08% 0. 02% 1. 09% 1. 42% 0. 00% 0. 12% 0. 05% 0. 00% 0. 01% 0. 02% 0. 11% 0. 03% 0. 59% 0. 00% 5. 32% 0. 00% 0. 26% 0. 24% 0. 49% 3. 02% 0. 77% 0. 00% 100. 00% Count of Transactions 19, 845, 171 31, 606, 468 5, 229, 608 23, 153, 201 2, 793, 253 214, 608 13, 141 224, 553 2, 567, 442 73, 321 56, 678 188, 156 612 3, 638 9, 095 51, 459 36, 907 703, 375 6, 341 12, 135, 263 12, 291 2, 092, 819 100, 640 2, 190, 484 13, 594, 526 1, 341, 147 20, 128 118, 264, 325 % to Total Transaction Amount (Transaction Exclude Payment Count) (Billing) 16. 78% 26. 73% 4. 42% 19. 58% 2. 36% 0. 18% 0. 01% 0. 19% 2. 17% 0. 06% 0. 05% 0. 16% 0. 00% 0. 01% 0. 04% 0. 03% 0. 59% 0. 01% 10. 26% 0. 01% 1. 77% 0. 09% 1. 85% 11. 50% 1. 13% 0. 02% 100. 00% $540, 905, 389 $525, 104, 526 $102, 486, 909 $28, 748, 158 $5, 851, 636 $1, 085, 938 $295, 964 $15, 222, 594 $19, 739, 445 $65, 594 $1, 723, 319 $706, 685 $18, 486 $83, 272 $341, 728 $1, 536, 010 $353, 618 $8, 203, 115 $51, 945 $74, 219, 036 $57, 460 $3, 581, 458 $3, 285, 887 $6, 808, 901 $42, 029, 892 $10, 782, 952 $62, 411 $1, 393, 352, 328
Do. D Call Center Statistics 10
References • DTMO Website/Travel Card Section www. defensetravel. dod. mil – GTCC Regulations (and related Cardholder Reference Guide) – APC Guide • Training available on DTMO/Tra. X – “Travel Card 101” – APC Training – Management Official Training (related to misuse) • Citibank Learning Center 11
Resources www. defensetravel. dod. mil • Presenter: Alec Cloyd – Email address for follow-up questions: dodhra. mc-alex. dtmo. list. government-travel-charge-card-team@mail. mil 12
Questions 13