U S EPA DISCLAIMER EPA strongly cautions that


- Slides: 26
U. S. EPA DISCLAIMER EPA strongly cautions that these study results should not be used to draw conclusions about local exposure concentrations or risk. The results are most meaningful when viewed at the regional or county level; for smaller areas, the study becomes less certain. In addition, these results represent conditions in 1999 rather than current conditions and only include exposures from outdoor sources of particulate matter. The results provide answers to questions about emissions, ambient air concentrations, exposures and risks across broad geographic areas for the year 1999. As such, they help the EPA identify specific air toxics compounds, and specific source sectors such as stationary sources or mobile sources, which generally produce the highest exposures and risks in the country. But they also are based on assumptions and methods that limit the range of questions that can be answered reliably. They cannot be used to identify exposures and risks for specific individuals, or even to identify exposures and risks in small geographic regions such as a specific neighborhood. These limitations, or caveats, must always be kept in mind when interpreting the results. The results should be used only to address questions for which the assessment methods are suited. All risk estimates are based on exposure estimates for the median individual within each census tract, which EPA considers to be a "typical" exposure. Some individuals may have substantially higher or lower exposures based on where they spend their time. The study is not designed to quantify these individual extremes.
The Diesel Difference Álvaro Alvarado, Ph. D. Environmental Protection Agency
Ben. MAP Air Quality Modeling 2. Health Impacts – Epidemiology 3. Valuation 1.
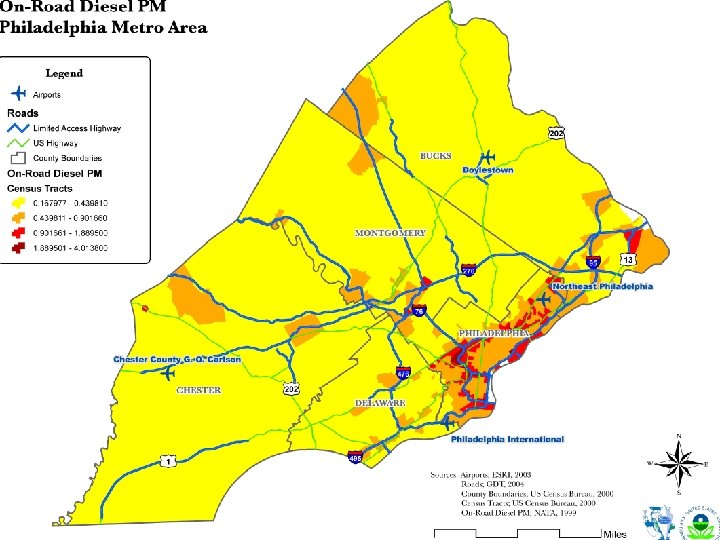
Air Quality Modeling l 1999 National Air Toxics Assessment l Non-road and On-road diesel PM l Study Area: – – – Philadelphia Delaware Montgomery Chester Bucks
Air Pollution and Health l Donora, PA – October 30 -31, 1948 – 20 people dead – 7, 000 Hospitalized – Half the population l London Fog – December – 12, 000 people dead – Transportation disrupted – Prize winning cattle dead 5 -9, 1952
Epidemiology American Cancer Society Study 1. 2 Million participants l 1982 - 1998 l Controlled for: Age, gender, weight, smoking history, alcohol use, occupation, diet, education l Each 10 µg/m 3 PM l – 4% increase in all cause mortality – 6% increase in lung cancer – 8% increase in fatal heart attacks
Pre-Mature Deaths Pope A. C. , et al. 2002. Lung cancer, cardiopulmonary mortality, and long‑term exposure to fine particulate air pollution. JAMA, vol. 287, no. 9, 1132 -1141.
Asthma Attacks Bucks 330 Chester 190 Delaware 510 Montgomery 410 Philadelphia 2300 Vedal, S. et al. 1998. Acute effects of ambient inhalable particles in asthmatic and nonasthmatic children. Am. J of Respiratory and Critical Care Medicine. 157(4): 1034 -1043. Ostro, B. et al. 2001. Air pollution and exacerbation of asthma in African-American children in Los Angeles. Epidemiology. 12(2): 200 -208.
Non-Fatal Heart Attacks Ostro, B. D. 1987. Air pollution and morbidity revisited: A speciation test. J of Environ Economics Management. 14: 87 -98.
Work Loss Days Bucks 2, 800 Chester 1, 600 Delaware 4, 000 Philadelphia 20, 000 Montgomery 3, 700 Ostro, B. D. 1987. Air pollution and morbidity revisited: A speciation test. J of Environ Economics Management. 14: 87 -98.
Work Loss Days Ostro, B. D. 1987. Air pollution and morbidity revisited: A speciation test. J of Environ Economics Management. 14: 87 -98.
Particulate Matter Worth Its’ Weight in Gold l 260 Premature deaths 450 Non-fatal heart attacks l 32, 000 Missed days of work l 3, 700 Asthma attacks l l Valued at $1. 4 billion l Cost $37 million $4. 4 million in lost wages l Valued at $160, 000 l
Particulate Matter Worth Its’ Weight in Gold l Willingness to pay l Cost of illness l Lost wages
Willingness to Pay l Standard regulatory approach l Value of small reduction in risk l Based on peer-reviewed studies: – Interviews – Market forces – Peoples willingness to accept risk for higher wages
Willingness to Pay l Mortality l $5. 5 l Asthma l $42 l Acute l $360 bronchitis Million to prevent “Bad asthma day” to prevent 6 day episode
Cost of Illness Medical costs, lost wages l Non-fatal Heart Attacks l Age dependent $66 k to $140 K l Hospital Admissions l Depends on illness $12, 378 to $18, 387 l Asthma ER visits l $286
Lost Wages l Data from 2000 Census l Median Income by County – Bucks $39, 286 – Chester $43, 039 – Delaware $37, 993 – Montgomery $41, 894 – Philadelphia $31, 338
How good are the results? l Uncertainties – Modeling – Epidemiology – Valuation
To know that even one life has breathed easier because you lived – this is to have succeeded. Ralph Waldo Emerson