
U S A National Surface Rock Density Map
- Slides: 1
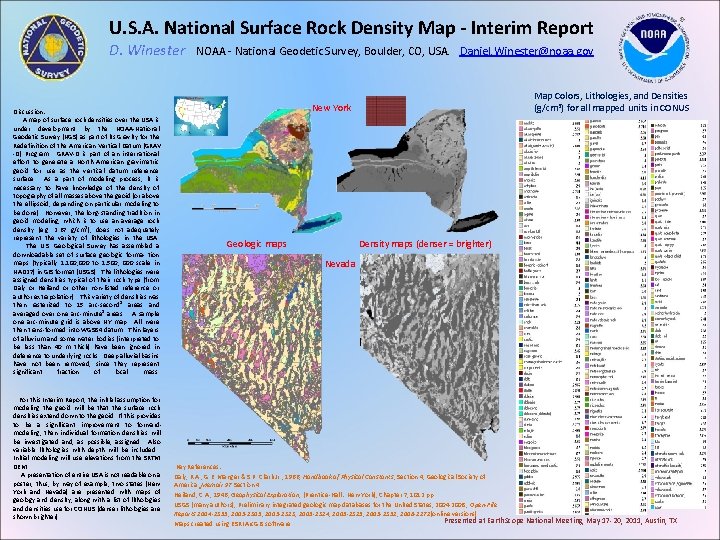
U. S. A. National Surface Rock Density Map - Interim Report D. Winester Discussion: A map of surface rock densities over the USA is under development by the NOAA-National Geodetic Survey (NGS) as part of its Gravity for the Redefinition of the American Vertical Datum (GRAV -D) Program. GRAV-D is part of an international effort to generate a North American gravimetric geoid for use as the vertical datum reference surface. As a part of modeling process, it is necessary to have knowledge of the density of topography of all masses above the geoid (or above the ellipsoid, depending on particular modeling to be done). However, the long-standing tradition in geoid modeling, which is to use an average rock density (e. g. 2. 67 g/cm 3), does not adequately represent the variety of lithologies in the USA. The U. S. Geological Survey has assembled a downloadable set of surface geologic forma- tion maps (typically 1: 100, 000 to 1: 500, 000 scale in NAD 27) in GIS format (USGS). The lithologies were assigned densities typical of their rock type (from Daly or Heiland or other non-listed reference or author extrapolation). This variety of densities was then rasterized to 15 arc-second² areas and averaged over one arc-minute² areas. A sample one arc-minute grid is above NY map. All were then trans-formed into WGS 84 datum. Thin layers of alluvium and some water bodies (interpreted to be less than 40 m thick) have been ignored in deference to underlying rocks. Deep alluvial basins have not been removed, since they represent significant fraction of local mass. For this Interim Report, the initial assumption for modeling the geoid will be that the surface rock densities extend down to the geoid. If this provides to be a significant improvement to forwardmodeling, then individual formation densities will be investigated and, as possible, assigned. Also variable lithologies with depth will be included. Initial modeling will use elevations from the SRTM DEM. A presentation of entire USA is not readable on a poster, thus, by way of example, two states (New York and Nevada) are presented with maps of geology and density, along with a list of lithologies and densities use for CONUS (denser lithologies are shown brighter). NOAA - National Geodetic Survey, Boulder, CO, USA. Daniel. Winester@noaa. gov Map Colors, Lithologies, and Densities (g/cm 3) for all mapped units in CONUS New York Geologic maps Density maps (denser = brighter) Nevada Key References: Daly, R. A. , G. E. Manger & S. P. Clark Jr. , 1966, Handbook of Physical Constants, Section 4, Geological Society of America Memoir 97 Section 4. Heiland, C. A. , 1946, Geophysical Exploration, (Prentice-Hall: New York), Chapter 7, 1012 pp. USGS (many authors), Preliminary integrated geologic map databases for the United States, 2004 -2008, Open-File Reports 2004 -1355, 2005 -1305, 2005 -1323, 2005 -1324, 2005 -1325, 2005 -1351, 2006 -1272(online versions). Presented at Earth. Scope National Meeting, May 17 -20, 2011, Austin, TX Maps created using ESRI Arc. GIS software.