Types of scale and maps PATTERNS PROCESSES Scale


 are")


")


- Slides: 34
Types of scale and maps PATTERNS & PROCESSES
Scale The relationship between the size of an object or distance between objects on a map, and the size of the actual object or distance on earth’s surface
Scale • Another description: – The relationship between the portion of Earth being studied and Earth as a whole • 3 different types of scale – Ratio – Written – Graphic
Scale • The scale on a map of downtown Chicago will be different than the scale on a map of Illinois • The smaller the area the map is depicting the larger the scale – Example • a city map will have a larger scale than a state map • City map- 1: 10, 000 • State map- 1: 10, 000 • Think about it, the smaller the area the map is depicting, the more detail you can cover, so scale is larger
Local Map What type of map would have a smaller scale? State Map
Reference Maps • They are designed for people to refer to for general information about places: – Political maps – Physical maps – Road maps – Plat maps – Locator maps
Political Map of Europe
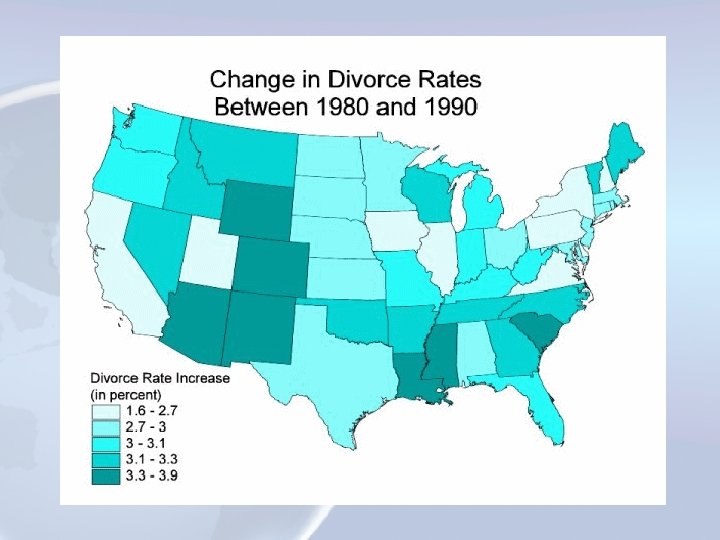
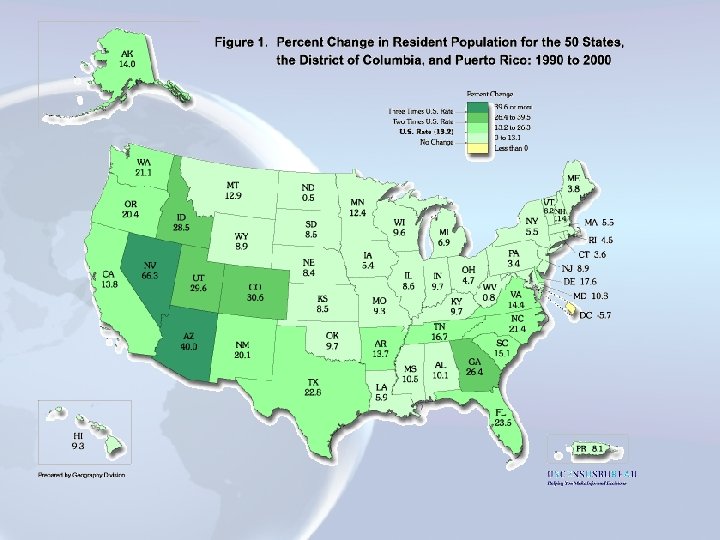
Thematic Maps • They show spatial aspects of information or of a phenomenon – Choropleth – Dot Distribution – Graduated symbol – Isoline • topographic
Choropleth • Method of thematic mapping • Shows statistical data using shading or coloring of specific areas Water Consumption in millions of gallons per day
Dot Distribution Map • Method of thematic mapping • A dot represents the occurrence of a phenomenon • Ex: one dot = every 100 people that voted in an election
One dot= 7500 people Where are most people located in the U. S. ? Why?
Graduated Symbol Map • Graduated symbol maps use symbols of different sizes to indicate different amounts of something • Larger sizes indicate more • Smaller sizes indicate less
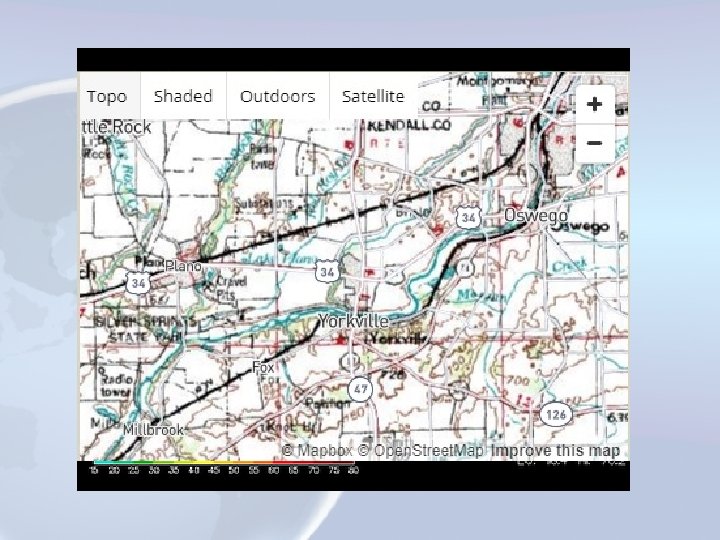
Isoline • Map with continuous lines that join points with the same value • Quickly show the information • Used a lot in weather forecasts and topographic maps
Isoline Map showing temperature across U. S.
Cartograms • The size of countries (or states, counties, or another areal unit) are shown according to some specific statistic • Distorted in order to show a variable • Abstracted and simplified map
• Election Map Cartograms • Show World Mapping
World map- population scale
Explain why this is a good example of a cartogram.
How to Make an A on a Map! AP Human Geography
TODALSIGS • • • T : Title O : Orientation D : Date A : Author L : Legend S : Scale I : Index G : Grid S : Site and Situation
TITLE • Title lets the reader know what the map is about
Orientation • Orientation tells the reader direction - NSEW
Date • Date tells the reader when the map was made
Author • Author tells the reader who made the map
Legend • Legend tells the reader how to read the map and what the different symbols mean
• Scale tells the reader the size of the map in relation to its size in the real world Scale
Types of Scale • Fractional – 1/24, 000 • Ratio – 1: 24, 000 • Statement – “one inch equals 1 mile”
Index • Index provides the reader with a list of all the information portrayed on the map • This will not be applicable to most of the maps you make in this class.
Grid • Grid helps the reader determine exact location (ex: latitude/Longitude coordinates)
Site/Situation • Site – Physical characteristics of a place • Situation – What it is near.
Examples of student made maps! Objective: Students will identify and apply key elements that all reliable maps contain