Types of Architecture Accumulator Stack General Purpose RegisterRegister


- Slides: 56

Types of Architecture Accumulator, Stack, General Purpose (Register-Register, Register Memory) Dr. John Abraham Professor UTRGV

4 types • stack, an accumulator, or a set of registers. Operands may be named explicitly or implicitly. C = A + B shown below. Lighter shades indicate inputs, and the dark shade indicates the result. Prof. John P. Abraham, UTRGV

Stack Architecture • Set of registers (perhaps 16 or 32) OR RAM are used as a stack to hold the LIFO structure. With all today’s CPUs stack uses RAM not registers; There are registers such as base pointer, stack segment register, stack-pointer, etc. in the register. • A register known as SP (stack pointer) will point to the top of the stack. Two other bits will be used to indicate Stack is Full (1 means full, 0 means not) and Stack is Empty (1 means empty, 0 means not). • Data from data register is pushed on to the stack and as popped off the stack to perform operations and result of operation is pushed into the stack itself.

Stack Full/Empty • 4 bits are used for a stack 16 register file. 0000, first data is pushed after incrementing the SP by one, or 0001. When stack pointer reaches 1111, the next pointer is 0000. So, the last data is added to 0000. When you push If the SP is pointing to 0000 (which is 0) stack is full. When you are popping if the stack is pointing 0 then the stack is empty.

Stack Assignment • In order to understand stack we will implement a stack based postfix calculator. • I used array based stack. You are free to use array or pointer. You can use any language you feel comfortable. • For implementing visual stack you will be given 20 extra points.

Infix and postfix • If the operator (opcode) is between operands then it is an infix expression: a+b • If the operator is after the operands it is a postfix expression: a b c + • Infix is human solvable as long as we know operator precedence and associativity. • Postfix is easily computer solvable • Infix can be converted to postfix by pushing and popping operators in a stack based on precedence and associativity. • For this assignment you don’t need to convert infix to postfix. Just write the expression in postfix.

Example Program Suppose your math expression is 8 3 4 + * The following will be carried out by the program you write. Parse the expression. For each number push it in the stack (make sure stack is not full when you push) • For each operator (opcode) pop two items from the stack (make sure stack is not empty when you pop) and perform the operation and place the result back in the stack. • Output result or appropriate error message. Push 8, push 3, push 4. As + is encountered pop 4 and 3 and add. Result is pushed. Now the stack has 8 7. As * is encountered pop 7 and 8 and perform multiply and push the result 56. If end of the expression is reached pop and output the result. • •

Hennessy and Patterson– Fundamentals of Quantitative Design and Analysis – 70 years of computer technology – 25% performance improvement/year for first 25 yrs – Dramatic dominance of microcomputers since late 70 s – 35% improvements/year. After 2003 less than 22% per year attributed to singe cpu. – Renaissance computer design • • Architectural innovation Efficient use of technology improvements Vendor-independent operating system such as unix Paved way to RISC machines Prof. John P. Abraham, UTRGV

Growth in processor performance since late 70 s Prof. John P. Abraham, UTRGV

Growth in processor performance since the late 1970 s. This chart plots performance relative to the VAX 11/780 as measured by the SPEC benchmarks (see Section 1. 8). Prior to the mid 1980 s, processor performance growth was largely technology driven and averaged about 25% per year. The increase in growth to about 52% since then is attributable to more advanced architectural and organizational ideas. By 2003, this growth led to a difference in performance of about a factor of 25 versus if we had continued at the 25% rate. Performance for floatingpoint-oriented calculations has increased even faster. Since 2003, the limits of power and available instruction-level parallelism have slowed uniprocessor performance, to no more than 22% per year, or about 5 times slower than had we continued at 52% per year. (The fastest SPEC performance since 2007 has had automatic parallelization turned on with increasing number of cores per chip each year, so uniprocessor speed is harder to gauge. These results are limited to single-socket systems to reduce the impact of automatic parallelization. ) Prof. John P. Abraham, Figure 1. 11 on page 24 shows the improvement in clock. UTRGV rates for these same three eras. Since SPEC has changed over the years, performance of newer machines is estimated by a scaling

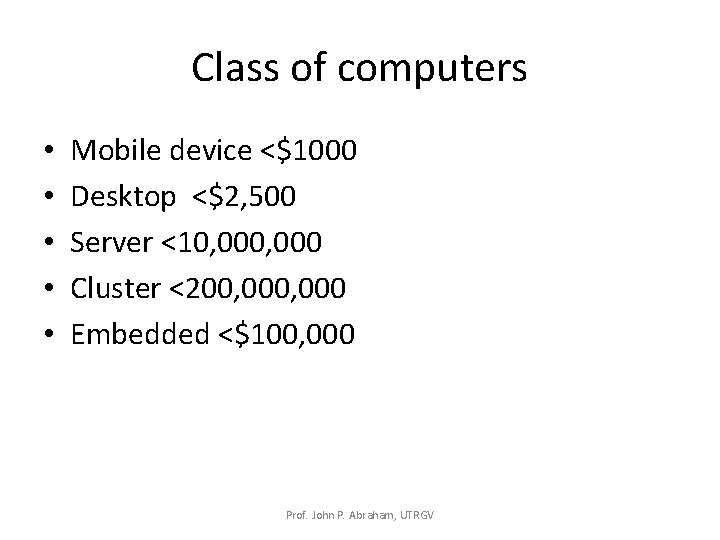
Class of computers • • • Mobile device <$1000 Desktop <$2, 500 Server <10, 000 Cluster <200, 000 Embedded <$100, 000 Prof. John P. Abraham, UTRGV

Critical system design issues • Cost, energy, media performance, responsiveness – FOR MOBILE DEVICES • Price performance, energy, graphics performance – FOR DESKTOPS • Throughput, availability, scalability, energy – FOR SERVERS • Price-performance, throughput, energy, proportionality – FOR CLUSTERS • Price, energy, application-specific performance for EMBEDDED Prof. John P. Abraham, UTRGV

hourly losses with downtime Prof. John P. Abraham, UTRGV

Parallelism 1. Data-Level Parallelism (DLP) arises because there are many data items that can be operated on at the same time. 2. Task-Level Parallelism (TLP) arises because tasks of work are created that can operate independently and largely in parallel. Flynn classification of implemation SISD, SIMD, MISD, MIMD (multiple instruction streams, multiple data streams) Prof. John P. Abraham, UTRGV

Our task as computer architects • Determine what attributes are important • Maximize performance without increasing cost • In fact, the cost has decreased dramatically. • Different aspects of the task – Instruction set design – Functional organization – Logic design – Implementation Prof. John P. Abraham, UTRGV

Instruction Set Architecture - ISA • Programmer visible instruction set • Boundary between software and hardware – General-purpose register ISA (we saw accumulator) – Operands are registers or memory locations – 32 GP & 32 FP registers today – Memory-byte addressable, read as a word. Can use byte, half-word or full word (32 bits) Prof. John P. Abraham, UTRGV

Addressing modes • Register • Immediate for constants • Displacement – constant offset is added to register to form a memory address (or 2 registers base register and displacement) Prof. John P. Abraham, UTRGV

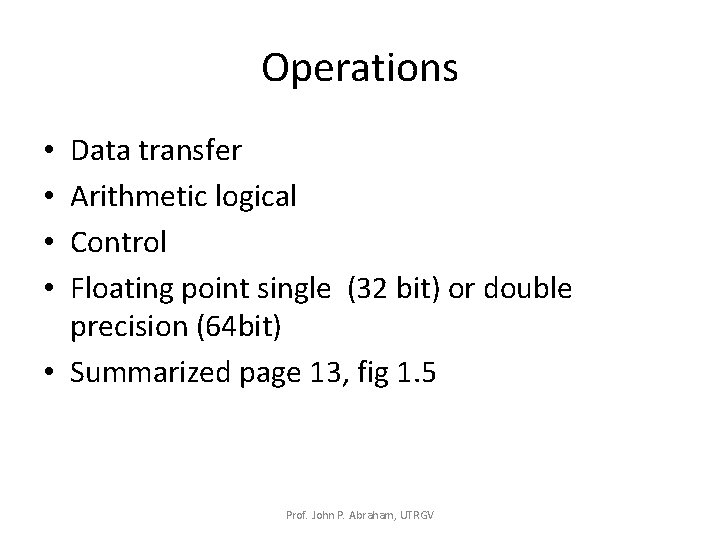
Operations Data transfer Arithmetic logical Control Floating point single (32 bit) or double precision (64 bit) • Summarized page 13, fig 1. 5 • • Prof. John P. Abraham, UTRGV

Control flow explained • • • Conditional branches Unconditional jumps Procedure calls and returns PC relative addressing for branching (PC + addressfield) Prof. John P. Abraham, UTRGV

Implementation • Three aspects: ISA, Organization, Hardware • Organization (microarchitecture) – High level aspects of a computer’s design: memory system, interconnect and design of CPU (core) – Example: Intel vs AMD same instruction set but different organization • Hardware – Logic design, etc. Prof. John P. Abraham, UTRGV

Architecture can be driven by market • Widely accepted application software – Architects will attempt to deliver speed to such software. • Well accepted compilers – Architects may keep the same ISA • Price, power, performance & availability Prof. John P. Abraham, UTRGV

Choice between designs Design complexity Complex design takes longer to complete This will prolong time to market Someone may come up with a better machine meantime. Cost A balancing act. Prof. John P. Abraham, UTRGV

Requirements and features Prof. John P. Abraham, UTRGV

Trends in technology and usage -1 IC logic technology: transistor density increases about 35% per year, ICs on a chip doubles every 18 -24 months. Moore’s law. DRAM capacity doubles every 2 -3 years. Capacity of Flash memory increases 5060%/year. Magnetic disk technology improved 300 to 500 times cheaper bit than DRAM. Prof. John P. Abraham, UTRGV

Performance milestones Prof. John P. Abraham, UTRGV

Trends in Cost • Time, volume and commoditization – Cost of manufacture decreases over time. – Cost of Integrated circuit=(cost of die+cost of testing+cost of packing)/final yield – Cost of die=cost of wafer/(dies per wafer x die yield) – Dies per wafer=area of wafer/area of the die minus unusable wafer area at the edges. See figure 1. 15 Prof. John P. Abraham, UTRGV

Example Prof. John P. Abraham, UTRGV

Prof. John P. Abraham, UTRGV

A manufacturing plant costs billions of dollars. Prof. John P. Abraham, UTRGV

Assume a 15 cm diameter wafer has a cost of 12, contains 84 dies, and has 0. 020 defects/cm 2. Calculate yield and cost per die. Prof. John P. Abraham, UTRGV

Measuring, Reporting & Summarizing Performance. 1. 8 What criteria do we use to say one computer is faster than another? • We might use terms such as: – execution time (also called response time) – Throughput • number of programs / unit time – wall-clock time (or elapsed time) – CPU time, user CPU time, system CPU time • CPU time = user CPU time + system CPU time – System performance (on an unloaded system) – CPU performance Prof. John P. Abraham, UTRGV

Performance Measures • To say X is n times faster than Y means that – Execution time Y / Execution time X = n – Performance X / Performance Y = n • The throughput of X is 1. 3 times higher than Y means that the number of tasks that can be executed on X is 1. 3 more than on Y in the same amount of time Prof. John P. Abraham, UTRGV

Execution time • Execution time depends upon performance of the machine – Execution time = 1/performance. • Better the performance smaller the time n= 1/performance of y 1/performance of x Prof. John P. Abraham, UTRGV

UNIX time command returns four measurements 90. 7 u 12. 9 s 2: 39 65% cpu time = 90. 7 sec System cpu time = 12. 9 s Elapsed time = 2 min 39 sec %of cpu time (90. 7+12. 9) over total time=65% Prof. John P. Abraham, UTRGV

Evaluating Peformance • There are four levels or programs that can be used to test performance – Real programs - e. g. , C compiler, Te. X, CAD tool, programs that have input and output and options that the user can select – Kernels - remove key pieces of programs and just test those – Toy benchmarks - 10 -100 lines of code such as quicksort whose performance is known in advance – Synthetic benchmarks - try to match average frequency of operations to simulate those instructions in some large program Prof. John P. Abraham, UTRGV

Benchmark Suite • A set of programs that test different performance metrics such as arrays, floating point operations, loops, etc… – SPEC CPU 2006 is a commonly quoted benchmark suite • 12 integer and 17 floating point benchmarks – Server Benchmarks – around Open. MP and MPI • SPECrate • SPECSFS Prof. John P. Abraham, UTRGV

Reporting Performance Results • One important factor is that performance results be reproducible – However, reported results may omit such information as the input, compiler settings, version of compiler, version of OS, size and number of disks, etc… – SPEC benchmark reports must include information like compiler flags, fairly complete description of the machine, and results running with normal and optimized compilers Comparing Performances Prof. John P. Abraham, UTRGV

Quantitative Principles of Computer Design 1. 9 • Parallelism-pipelining – most important methods for improving performance • Principle of locality –Temporal locality. . tendency to use same code used recently -Spatial locality. . items whose addresses are near each other tend to be used close together Focus on Common case – frequent case vs. infrequent case. Example, fetch/decode is more frequently than multiplier Prof. John P. Abraham, UTRGV

Amdahl’s Law • A fundamental law in describing performance gain created through some architectural improvement as speedup -- “make the common case fast” Prof. John P. Abraham, UTRGV

Using Amdahl’s Law • We must consider two factors in using this: – Fraction of the computation time in the original machine that can be converted to take advantage of the enhancement – Improvement gained by the enhanced execution mode (how much faster will the task run if the enhanced mode is used for the entire program? ) • Speedup = 1 / [ (1 - fraction enhanced) + Fraction enhanced / Speedup enhanced) ] Prof. John P. Abraham, UTRGV

Examples – An enhancement runs 10 times faster but is only usable 40% of the time. • Speedup = 1 / [(1 -. 4) *. 4/10] = 1. 56 Prof. John P. Abraham, UTRGV

Suppose FP sqrt is responsible for 20% of instructions in a benchmark Prof. John P. Abraham, UTRGV

The Processor Performance Equation • Essentially all computers are constructed using a clock running at a constant rate. • These discrete time events are called ticks, clock periods, clocks, Prof. John P. Abraham, UTRGV

CPU Performance – CPU time = CPU clock cycles * clock cycle time – CPU time = CPU clock cycles for prog / Clock rate – IC - instruction count • This is the # of instructions in the program – CPI - clock cycles per instruction – CPI = CPU clock cycles for prog / IC – CPU time = IC * CPI * Clock cycle time – CPU time = (Sum CPIi * ICi) * clock cycle time – Average CPI = Sum (CPIi * ICi/ Instruction Count) Prof. John P. Abraham, UTRGV

Example – Frequency of FP operations = 25% – Average CPI of FP operations = 4. 0 – Average CPI of other instructions = 1. 33 – Frequency of FP sqrt = 2% – CPI of FP sqrt = 20 – CPI = 4*25%+1. 33*75% = 2. 0 • Two alternatives: reduce CPI of FP sqrt to 2 or reduce CPI of all FP ops to 2 – CPI new FP sqrt = CPI original - 2% * (20 -2) = 1. 64 – CPI new FP = 75%*1. 33+25%*2. 0=1. 5 – Speedup new FP = CPI original/CPI new FP = 1. 33 • refer back to previous example Prof. John P. Abraham, UTRGV

CPU Components’ Performance • Large part of a Comp. Architect’s job is to design tools or means of measuring the CPU component performances – Low level tools: timing estimators • We can also measure the instruction count for a program using compiler technology, using the program execution duration and the instruction mix • Execution-based monitoring by including in the program, code that saves the instruction mix during execution Prof. John P. Abraham, UTRGV

Measuring CPI • Requires knowing the processor’s organization and the instruction stream – Designers may use Average CPIs but this is influenced by cache and pipeline structures – We might assume a perfect memory system that does not cause delays – Pipeline CPI measures can be determined by simulating the pipeline • This might be sufficient for simple pipes but not for advanced pipes Prof. John P. Abraham, UTRGV

More Ex’s of CPU Performance • 2 alternatives for a conditional branch instruction – CPU A: condition code is set by a compare instruction and followed by a branch that tests the condition code – CPU B: compare is included in the branch • Conditional branch takes 2 cycles, all other instructions take 1 clock cycle • For CPU A, 20% of all instructions are conditional branches • Assume CPU A has a clock cycle time 1. 25 times faster than CPU B – since CPUA does not have the compare included in the branch statement • Which CPU is faster? Prof. John P. Abraham, UTRGV

Solution • CPI A =. 2 * 2 +. 8 * 1 = 1. 2 • CPU time A = IC A * 1. 2 * Clock Cycle time A – A’s clock rate is 1. 25 times higher than B – Compares are not executed in isolation on B, so there are instead 25% compares and 75% other • CPI B =. 25 * 2 +. 75 * 1 = 1. 25 • CPU time B = IC B * 1. 25 * Clock Cycle time B =. 8 * IC A * 1. 25 * Clock Cycle time A • CPU time B = 1. 25 * IC A * Clock Cycle time A • So, CPU time A is shorter than B and so A is faster Prof. John P. Abraham, UTRGV

What if A’s clock cycle = 1. 1 B? • We repeat the previous solution changing – Clock Cycle time A = 1. 1 * Clock Cycle time B • instead of using 1. 25 – CPU time A = 1. 2 * IC A * Clock Cycle time A – CPU time B = IC B * 1. 25 * Clock Cycle time B =. 8 * IC A * 1. 25 * 1. 1 Clock Cycle time A = 1. 1 * IC A * Clock Cycle time A – So, in this case, CPU B is faster Prof. John P. Abraham, UTRGV

Prof. John P. Abraham, UTRGV

Memory Hierarchy • • Register (CPU) Cache Main Memory I/O Devices – Hard Disk – Optical disk, floppy disk – Magnetic tape Prof. John P. Abraham, UTRGV

Cache Performance • Assume: Cache is 10 times faster than memory and cache hit rate is 90% • How much speedup is gained using this cache? – Use Amdahl’s law: – Speedup = 1 / [(1 -90%) + (90%/10)] = 1/[. 1+. 9/10] = 5. 3 • Over a 5 times speedup by using cache with these specifications! Prof. John P. Abraham, UTRGV

Memory Impact on CPU • In a pipeline, a memory stall will occur if the memory fetch of an operand is not found in cache – CPU execution time = (CPU clock cycles + Memory stall cycles) * Clock cycle – Memory stall cycles = number of misses * miss penalty = IC * misses per instruction * miss penalty = IC * mem ref’s/instr * miss rate * miss penalty – Miss rate is determined by cache efficiency – Miss penalty is determined by main memory system speed (also bus load and bandwidth, etc…) Prof. John P. Abraham, UTRGV

Example • Assume a machine with – CPI = 2. 0 when all memory accesses are hits – Only data accesses are loads and stores (40% of all instructions are loads and stores) – Miss penalty = 25 clock cycles – Miss rate = 2% – How much faster would the machine be if all accesses are hits? Prof. John P. Abraham, UTRGV

Solution • For machine with no misses: – CPU exec. Time = (CPU clock cycles + memory stall cycles) * clock cycle = (IC * CPI + 0) * clock cycle • For machine with 2% miss rate: – Memory stall cycles = IC * memory references/instr * miss rate * miss penalty = IC * (1 +. 4) *. 02 * 25 = IC *. 7 – CPU exec Time = (IC * 2. 0 + IC *. 7) * clock cycle = 2. 7 * IC * clock cycle • So, the machine with no misses is 2. 7/2. 0 times faster or 1. 35 times faster Prof. John P. Abraham, UTRGV