TwoSample Tests of Hypothesis Chapter 11 Copyright 2015


 As part of a study of corporate employees, the director")
 Step 1: H 0: µC = µP H 1: µC")
 Mary Jo Fitzpatrick is the vice president for Nursing Services")
 Step 1: H 0: µUnion ≦ µNon. Union H 1:")

")
")
")
")
")
")
")
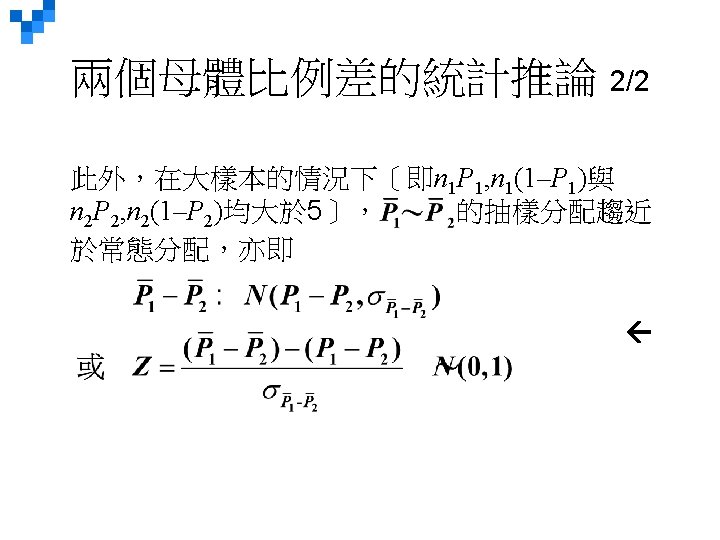
 σ1=σ2=σ A recent study compared the time spent together by")
 σ1=σ2=σ Step 1: Ho: μs ≦ μd. H 1: μs")


 σ1 ≠ σ2 The null and alternate hypotheses are: A")
 σ1 ≠ σ2 a. df = 30, found by b.")


 The federal government recently granted funds for a special program")
 Step 1: H 0: μd ≦ 0 H 1: μd")

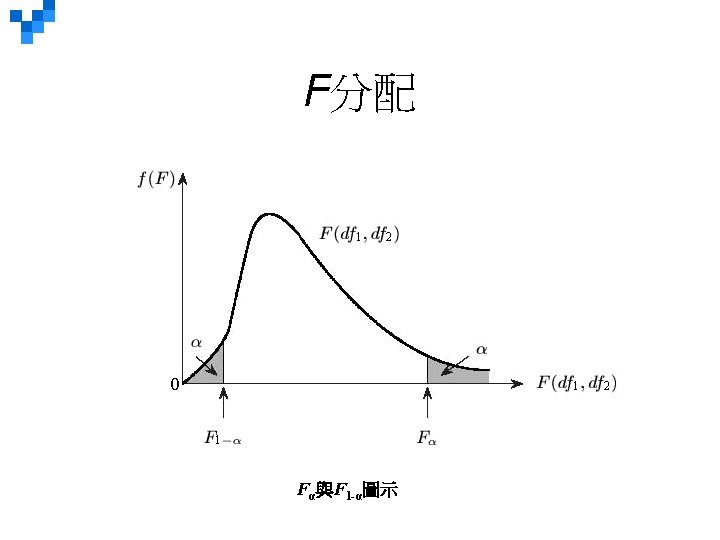
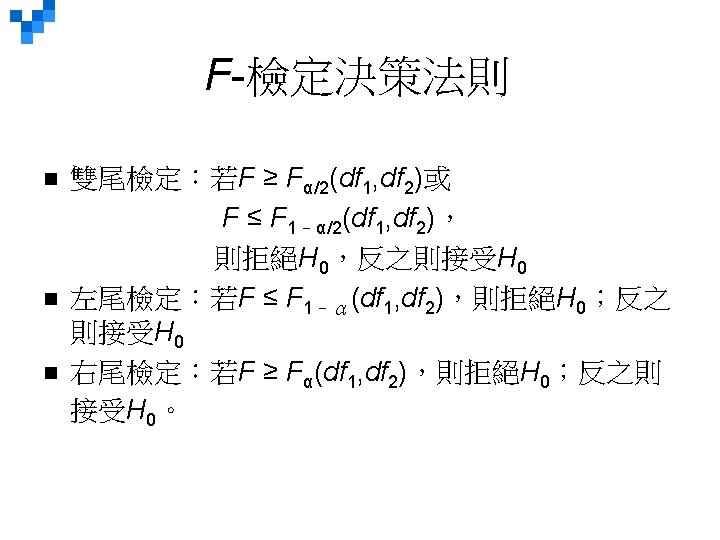
<F<Fα/2(df 1, df 2))=1–α")
- Slides: 76
Two-Sample Tests of Hypothesis Chapter 11 Copyright © 2015 Mc. Graw-Hill Education. All rights reserved. No reproduction or distribution without the prior written consent of Mc. Graw-Hill Education.
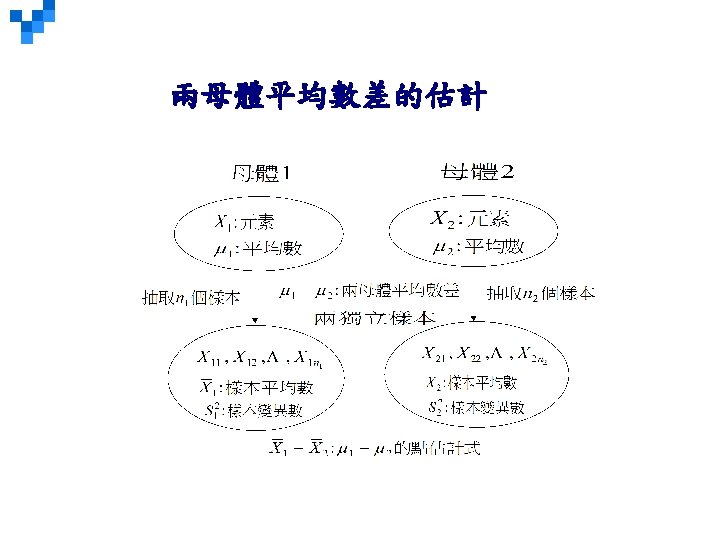
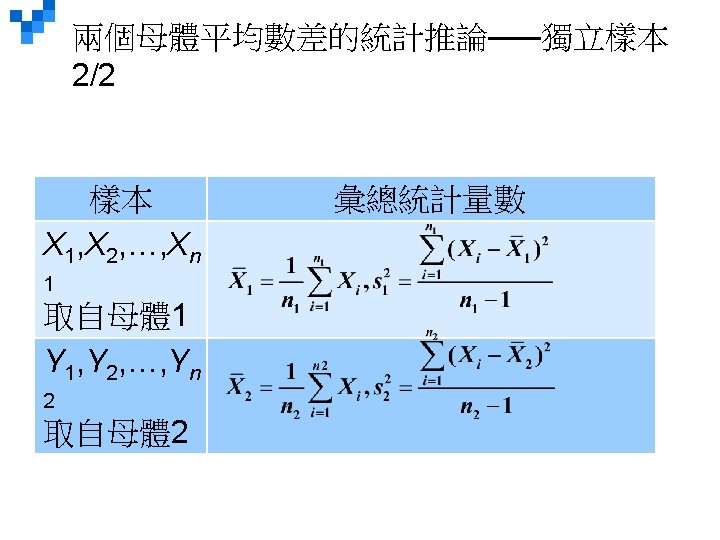
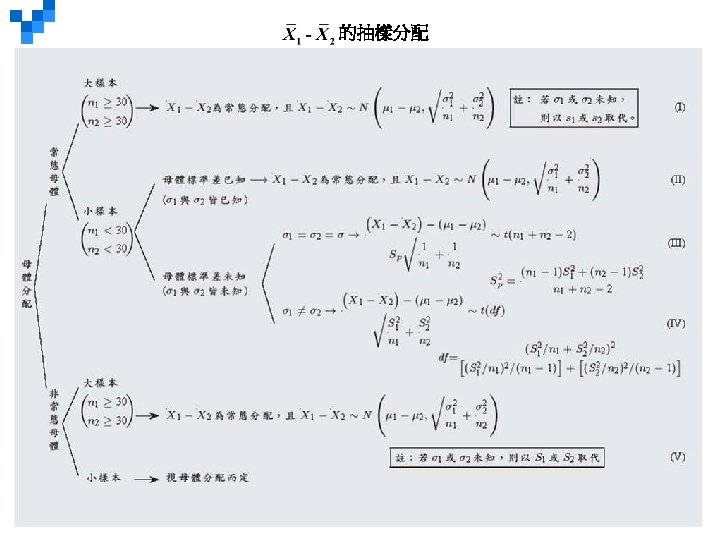
Learning Objectives LO 11 -1 Test a hypothesis that two independent population means are equal, assuming that the population standard deviations are known and equal. LO 11 -2 Test a hypothesis that two independent population means are equal, with unknown population standard deviations. LO 11 -3 Test a hypothesis about the mean population difference between paired or dependent observations. LO 11 -4 Explain the difference between dependent and independent samples. 11 -*
Comparing Two Populations – Examples § Is there a difference in the mean value of residential real estate sold by male agents and female agents in south Florida? § Is there a difference in the mean number of defects produced on the day and the afternoon shifts at Kimble Products? § Is there a difference in the mean number of days absent between young workers (under 21 years of age) and older workers (more than 60 years of age) in the fast-food industry? § Is there is a difference in the proportion of Ohio State University graduates and University of Cincinnati graduates who pass the state Certified Public Accountant Examination on their first attempt? § Is there an increase in the production rate if music is piped into the production area? 11 -*
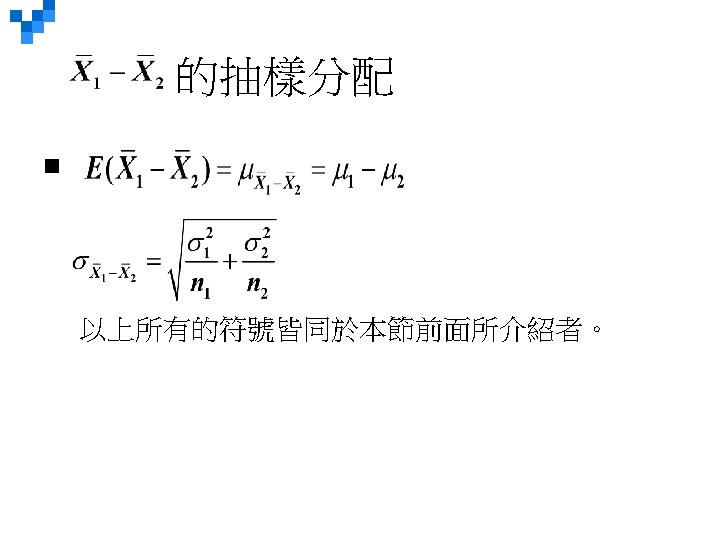
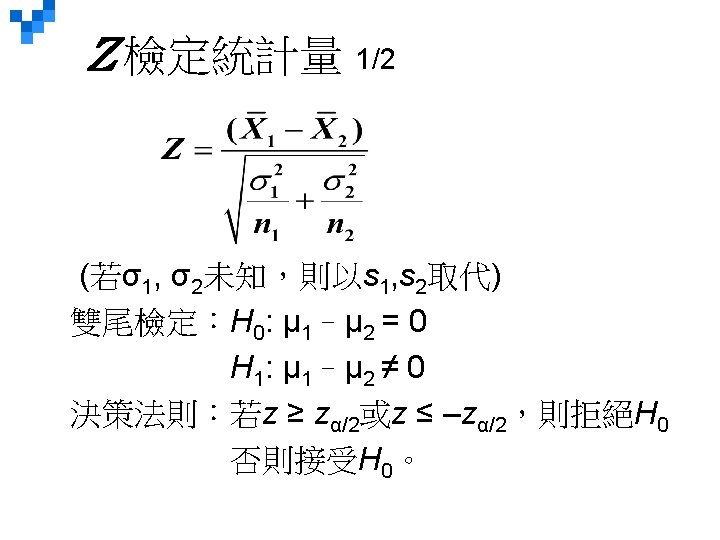
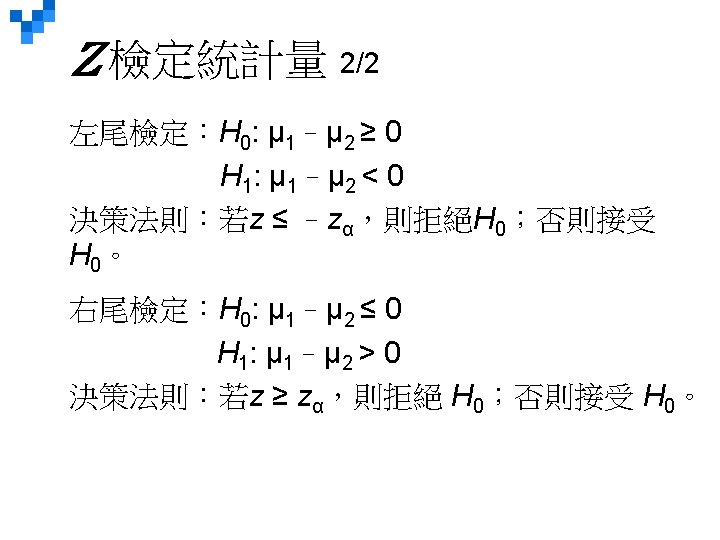
LO 11 -1 Test a hypothesis that two independent population means are equal, assuming that the population standard deviations are known and equal. Comparing Two Population Means: Equal, Known Population Variances § No assumptions about the shape of the populations are required. § The samples are from independent populations. § The formula for computing the value of z is: 11 -*
LO 11 -1 Comparing Two Population Means: Equal, Known Population Variances – Example (p. 351 -353) The Fast Lane procedure was recently installed at the local food market. The store manager would like to know if the mean checkout time using the standard checkout method is longer than using the Fast Lane procedure. She gathered the following sample information. The time is measured from when the customer enters the line until their bags are in the cart. Hence, the time includes both waiting in line and checking out. 11 -*
LO 11 -1 Comparing Two Population Means: Equal, Known Population Variances – Example (p. 351 -353) Applying the six-step hypothesis testing procedure: Step 1: State the null and alternate hypotheses. (keyword: “longer than”) H 0 : µS ≤ µ U H 1 : µ S > µ U Step 2: Select the level of significance. The. 01 significance level is requested in the problem. Step 3: Determine the appropriate test statistic. Because both population standard deviations are known, we can use the z-distribution as the test statistic. 11 -*
LO 11 -1 Comparing Two Population Means: Equal, Known Population Variances – Example (p. 351 -353) Step 4: Formulate a decision rule. Reject H 0 if z > z z> 2. 326 11 -*
LO 11 -1 Comparing Two Population Means: Equal, Known Population Variances – Example (p. 351 -353) Step 5: Take a sample and make a decision. The computed value of 3. 123 is larger than the critical value of 2. 326. Our decision is to reject the null hypothesis. Step 6: Interpret the result. The difference of. 20 minutes between the mean checkout time using the standard method is too large to have occurred by chance. We conclude the Fast Lane method is faster. 11 -*
ex. 4 (p. 355) As part of a study of corporate employees, the director of human resources for PNC Inc. wants to compare the distance traveled to work by employees at its office in downtown Cincinnati with the distance for those in downtown Pittsburgh. A sample of 35 Cincinnati employees showed they travel a mean of 370 miles per month. A sample of 40 Pittsburgh employees showed they travel a mean of 380 miles per month. The population standard deviations for the Cincinnati and Pittsburgh employees are 30 and 26 miles, respectively. At the. 05 significance level, is there a difference in the mean number of miles traveled per month between Cincinnati and Pittsburgh employees?
ex. 4 (p. 355) Step 1: H 0: µC = µP H 1: µC ≠ µP Step 2: The 0. 05 significance level was chosen Step 3: Use a z-statistic as both population standard deviations are known. Step 4: Reject Ho if z < – 1. 96 or z > 1. 96 Step 5: -1. 532, found by Fail to reject Ho. Step 6: There is no difference in the mean number of miles traveled per month for PNC Inc. employees at Cincinnati and Pittsburg.
ex. 6 (p. 355) Mary Jo Fitzpatrick is the vice president for Nursing Services at St. Luke's Memorial Hospital. Recently she noticed in the job postings for nurses that those that are unionized seem to offer higher wages. She decided to investigate and gathered the following information. Would it be reasonable for her to conclude that union nurses earn more? Use the. 02 significance level. What is the p-value?
ex. 6 (p. 355) Step 1: H 0: µUnion ≦ µNon. Union H 1: µUnion > µNon. Union Step 2: The 0. 02 significance level was chosen Step 3: Use a z-statistic as both population standard deviations are known. Step 4: If z > 2. 054, reject Ho. Steps 5: Reject the null. Step 6: It is reasonable to conclude union nurses earn more. The p-value is 0. 0183, found by 0. 5000 - 0. 4817.
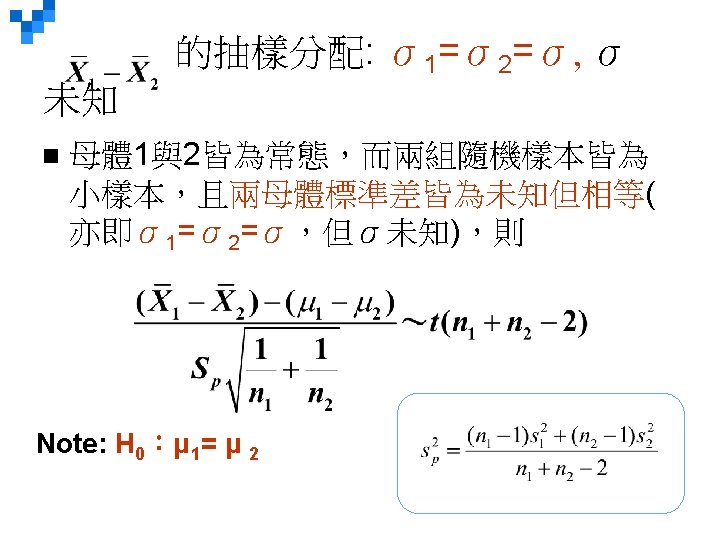
LO 11 -2 Test a hypothesis that two independent population means are equal, with unknown population standard deviations. Comparing Population Means: Equal, Unknown Population Standard Deviations σ1=σ2=σ (The Pooled t-test) The t distribution is used as the test statistic if one or more of the samples have less than 30 observations. The required assumptions are: §Both populations must follow the normal distribution. §The populations must have equal standard deviations. §The samples are from independent populations. 11 -*
LO 11 -2 Comparing Population Means: Equal, Unknown Population Standard Deviations (The Pooled t-test) σ1=σ2=σ Finding the value of the test statistic requires two steps: 1. Pool the sample standard deviations. 2. Use the pooled standard deviation to compute the tstatistic. 11 -*
LO 11 -2 Comparing Population Means: Equal, Unknown Population Standard Deviations (The Pooled t-test) – Example (p. 356 -358) σ1=σ2=σ Owens Lawn Care, Inc. , manufactures and assembles lawnmowers that are shipped to dealers throughout the United States and Canada. Two different procedures have been proposed for mounting the engine on the frame of the lawnmower. The question is: Is there a difference in the mean time to mount the engines on the frames of the lawnmowers? The first procedure was developed by longtime Owens employee Herb Welles (designated “W”), and the other procedure was developed by Owens Vice President of Engineering William Atkins (designated “A”). To evaluate the two methods, it was decided to conduct a time and motion study. A sample of five employees was timed using the Welles method and six using the Atkins method. The results, in minutes, are shown on the right. Is there a difference in the mean mounting times? Use the. 10 significance level. 11 -*
LO 11 -2 Comparing Population Means: Equal, Unknown Population Standard Deviations (The Pooled t-test) – Example (p. 356 -358) σ1=σ2=σ Step 1: State the null and alternate hypotheses. (Keyword: “Is there a difference”) H 0 : µW = µ A H 1 : µ W ≠ µ A Step 2: State the level of significance. The 0. 10 significance level is stated in the problem. Step 3: Select the appropriate test statistic. Because the population standard deviations are not known but are assumed to be equal, we use the pooled t-test. 11 -*
LO 11 -2 Comparing Population Means: Equal, Unknown Population Standard Deviations (The Pooled t-test) – Example (p. 356 -358) σ1=σ2=σ Step 4: State the decision rule. Reject H 0 if t > t /2, n. W+n. A-2 or t < - t /2, n. W+n. A-2 t > t. 05, 9 or t < - t. 05, 9 t > 1. 833 or t < - 1. 833 11 -*
LO 11 -2 Comparing Population Means: Equal, Unknown Population Standard Deviations (The Pooled t-test) – Example (p. 356 -358) σ1=σ2=σ Step 5: Compute the value of t and make a decision. (a) Calculate the sample standard deviations. (b) Calculate the pooled sample standard deviation. 11 -*
LO 11 -2 Comparing Population Means: Equal, Unknown Population Standard Deviations (The Pooled t-test) – Example (p. 356 -358) σ1=σ2=σ Step 5 (continued): Take a sample and make a decision. (c) Determine the value of t. The decision is not to reject the null hypothesis because – 0. 662 falls in the region between -1. 833 and 1. 833. Step 6: Interpret the Result. The data show no evidence that there is a difference in the mean times to mount the engine on the frame between the Welles and Atkins methods. 11 -*
LO 11 -2 Comparing Population Means: Equal, Unknown Population Standard Deviations (The Pooled t-test) – Example (p. 356 -358) σ1=σ2=σ 11 -*
ex. 10 (p. 360) σ1=σ2=σ A recent study compared the time spent together by singleand dual-earner couples. According to the records kept by the wives during the study, the mean amount of time spent together watching television among the single-earner couples was 61 minutes per day, with a standard deviation of 15. 5 minutes. For the dual-earner couples, the mean number of minutes spent watching television was 48. 4 minutes, with a standard deviation of 18. 1 minutes. At the. 01 significance level, can we conclude that the singleearner couples on average spend more time watching television together? There were 15 single-earner and 12 dual-earner couples studied.
ex. 10 (p. 360) σ1=σ2=σ Step 1: Ho: μs ≦ μd. H 1: μs > μd Step 2: The 0. 01 significance level was chosen Step 3: Use a t-statistic assuming a pooled variance with the standard deviation unknown. Step 4: df = 15 + 12 – 2 = 25 Reject Ho if t > 2. 485 Step 5: Do not reject Ho. Step 6: There is no difference in the mean amount of time spent watching television between single and dual earner couples.
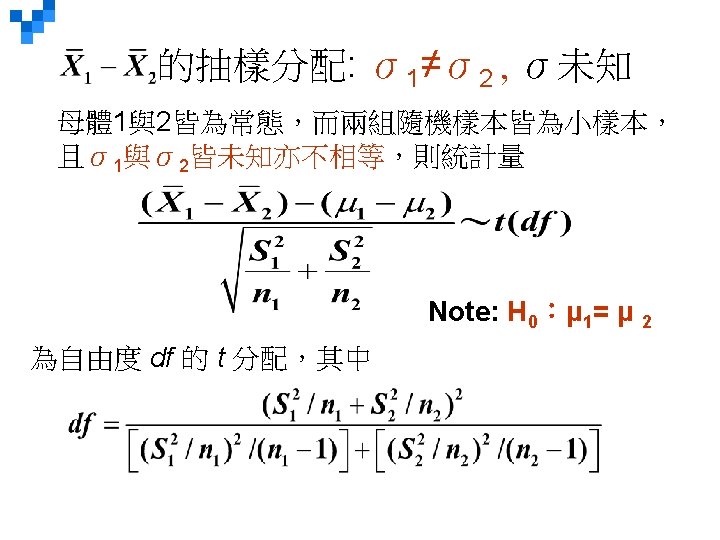
LO 11 -2 Comparing Population Means with Unknown AND Unequal Population Standard Deviations (σ1 ≠ σ2) Use the formula for the t-statistic shown if it is not reasonable to assume the population standard deviations are equal. The degrees of freedom are adjusted downward by a rather complex approximation formula. The effect is to reduce the number of degrees of freedom in the test, which will require a larger value of the test statistic to reject the null hypothesis. 11 -*
LO 11 -2 Comparing Population Means with Unknown AND Unequal Population Standard Deviations – Example (p. 361 -363) (σ1 ≠ σ2) Personnel in a consumer testing laboratory are evaluating the absorbency of paper towels. They wish to compare a set of store brand towels to a similar group of name brand ones. For each brand they dip a ply of the paper into a tub of fluid, allow the paper to drain back into the vat for two minutes, and then evaluate the amount of liquid the paper has taken up from the vat. A random sample of 9 store brand paper towels absorbed the following amounts of liquid in milliliters. 8 8 3 1 9 7 5 5 12 An independent random sample of 12 name brand towels absorbed the following amounts of liquid in milliliters: 12 11 10 6 8 9 9 10 11 9 8 10 Use the. 10 significance level and test if there is a difference in the mean amount of liquid absorbed by the two types of paper towels. 11 -*
LO 11 -2 Comparing Population Means with Unknown AND Unequal Population Standard Deviations – Example (p. 361 -363) (σ1 ≠ σ2) The following dot plot provided by MINITAB shows the variances to be unequal. The following output provided by MINITAB shows the descriptive statistics. 11 -*
LO 11 -2 Comparing Population Means with Unknown AND Unequal Population Standard Deviations – Example (p. 361 -363) (σ1 ≠ σ2) Step 1: State the null and alternate hypotheses. H 0 : μ 1 = μ 2 H 1 : μ 1 ≠ μ 2 Step 2: State the level of significance. The. 10 significance level is stated in the problem. Step 3: Find the appropriate test statistic. A t-test adjusted for unequal variances. 11 -*
LO 11 -2 Comparing Population Means with Unknown AND Unequal Population Standard Deviations – Example (p. 361 -363) (σ1 ≠ σ2) Step 4: State the decision rule. Reject H 0 if t > t /2 d. f. or t < - t /2, d. f. t > t. 05, 10 or t < - t. 05, 10 t > 1. 812 or t < -1. 812 Step 5: Compute the value of t and make a decision. The computed value of t (-2. 474) is less than the lower critical value, so our decision is to reject the null hypothesis. Step 6: Interpret the result. We conclude that the mean absorption rate for the two towels is not the same. 11 -*
LO 11 -2 Comparing Population Means with Unknown AND Unequal Population Standard Deviations – Minitab σ1 ≠ σ2 11 -*
ex. 14 (p. 364) σ1 ≠ σ2 The null and alternate hypotheses are: A random sample of 20 items from the first population showed a mean of 100 and a standard deviation of 15. A sample of 16 items for the second population showed a mean of 94 and a standard deviation of 8. Use the. 05 significant level.
ex. 14 (p. 364) σ1 ≠ σ2 a. df = 30, found by b. If t > 1. 697, then reject Ho. c. d. You fail to reject the null hypothesis.
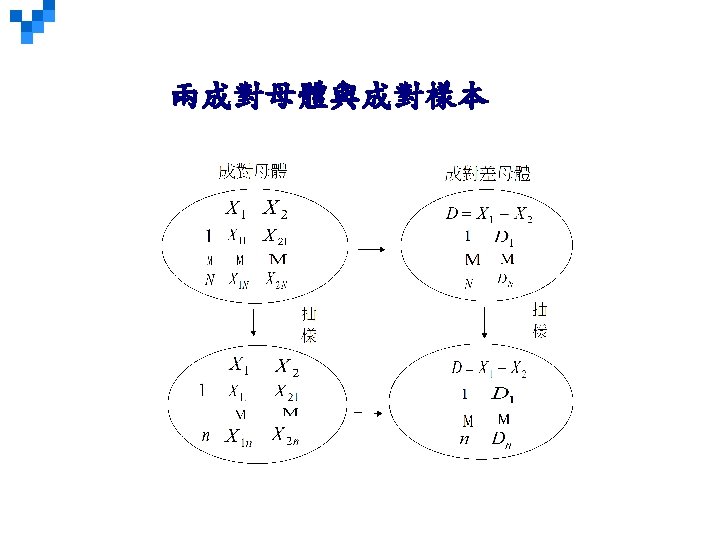
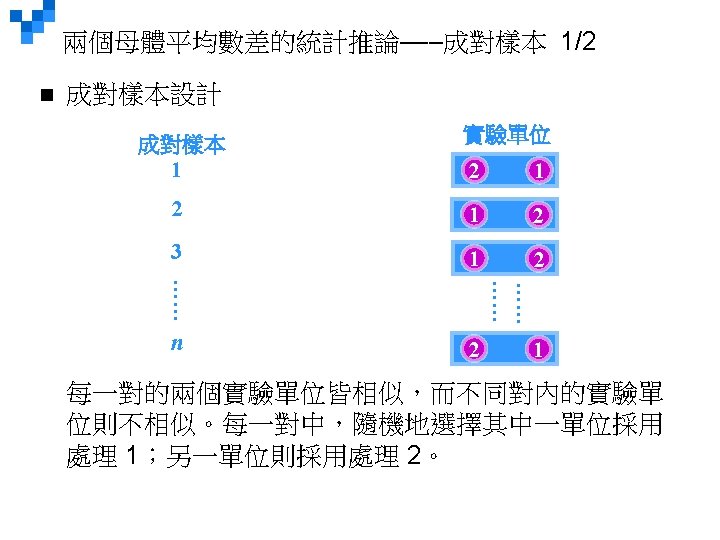
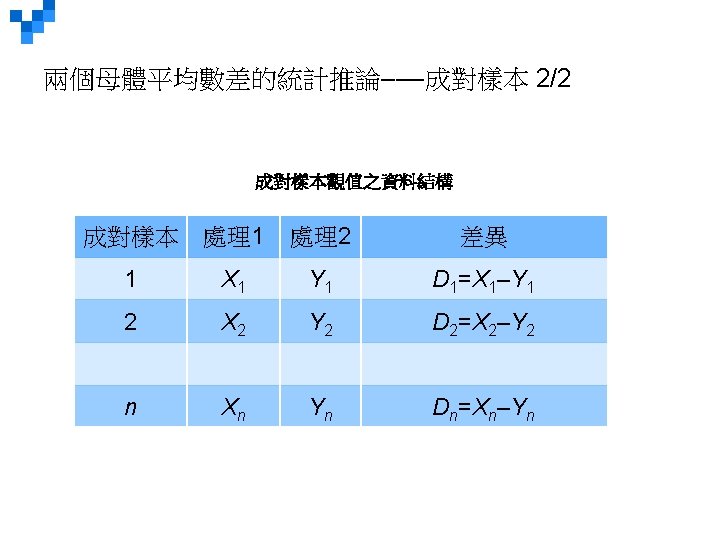
LO 11 -3 Test a hypothesis about the mean population difference between paired or dependent observations. Comparing Population Means: Hypothesis Testing with Dependent Samples Dependent samples are samples that are paired or related in some fashion. For example: ¨ If you wished to buy a car you would look at the same car at two (or more) different dealerships and compare the prices. 同一車款 ¨ If you wished to measure the effectiveness of a new diet you would weigh the dieters at the start and at the finish of the program. 同 一人(之前、之後) 11 -*
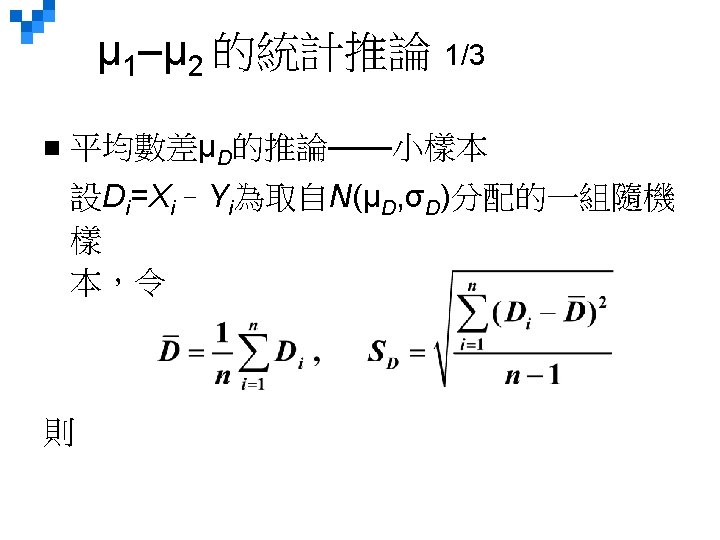
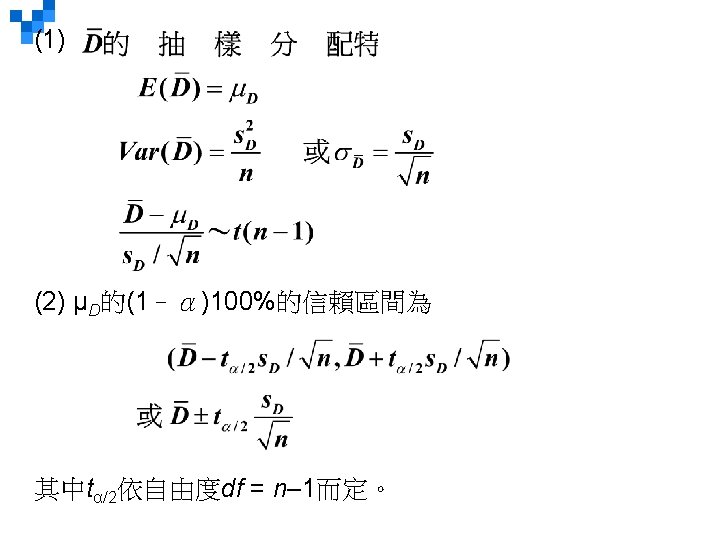
LO 11 -3 Comparing Population Means: Hypothesis Testing with Dependent Samples Use the following test when the samples are dependent: Where is the mean of the differences sd is the standard deviation of the differences n is the number of pairs (differences) 11 -*
LO 11 -3 Comparing Population Means: Hypothesis Testing with Dependent Samples – Example (p. 365 -367) Nickel Savings and Loan wishes to compare the two companies, Schadek and Bowyer, it uses to appraise the value of residential homes. Nickel Savings selected a sample of 10 residential properties and scheduled both firms for an appraisal. The results, reported in $000, are shown in the table (right). At the. 05 significance level, can we conclude there is a difference in the mean appraised values of the homes? 11 -*
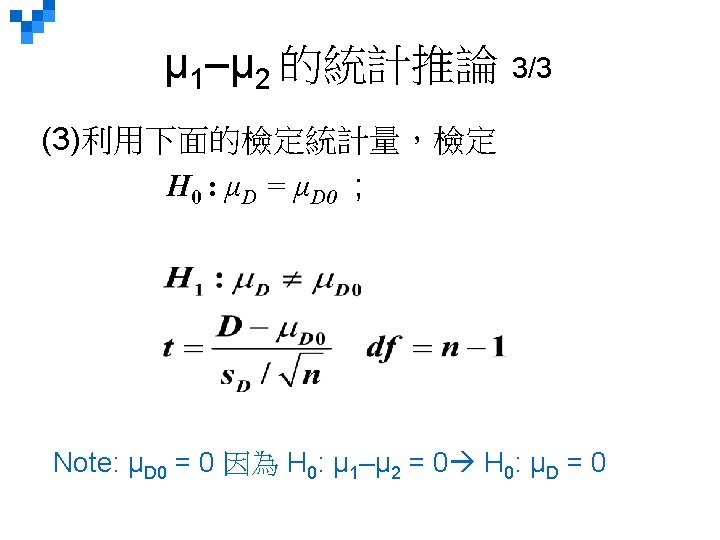
LO 11 -3 Comparing Population Means: Hypothesis Testing with Dependent Samples – Example (p. 365 -367) Step 1: State the null and alternate hypotheses. H 0: �μd = 0 H 1: �μd ≠ 0 Step 2: State the level of significance. The. 05 significance level is stated in the problem. Step 3: Select the appropriate test statistic. To test the difference between two population means with dependent samples, we use the t-statistic. 11 -*
LO 11 -3 Comparing Population Means: Hypothesis Testing with Dependent Samples – Example (p. 365 -367) Step 4: State the decision rule. Reject H 0 if t > t /2, n-1 or t < - t /2, n-1 t > t. 025, 9 or t < - t. 025, 9 t > 2. 262 or t < -2. 262 11 -*
LO 11 -3 Comparing Population Means: Hypothesis Testing with Dependent Samples – Example (p. 365 -367) Step 5: Take a sample and make a decision. The computed value of t, 3. 305, is greater than the higher critical value, 2. 262, so our decision is to reject the null hypothesis. Step 6: Interpret the result. The data indicate that there is a significant statistical difference in the property appraisals from the two firms. We would hope that appraisals of a property would be similar. 11 -*
LO 11 -3 Comparing Population Means: Hypothesis Testing with Dependent Samples – Excel Example (p. 367) 此處用成對(相依) 母體來做檢定分析: 11 -*
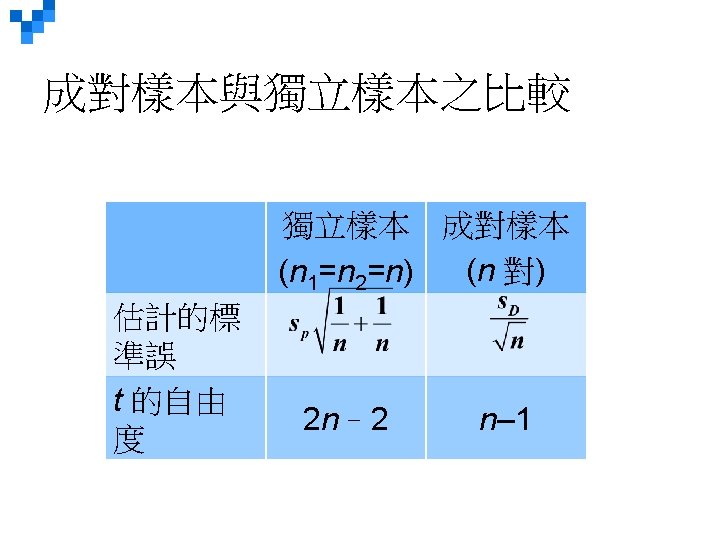
LO 11 -4 Explain the difference between dependent and independent samples. Dependent versus Independent Samples How do we differentiate between dependent and independent samples? § Dependent samples are characterized by a measurement followed by an intervention of some kind and then another measurement. This could be called a “before” and “after” study. § Dependent samples are characterized by matching or pairing observations. Why do we prefer dependent samples to independent samples? § By using dependent samples, we are able to reduce the variation in the sampling distribution. 11 -*
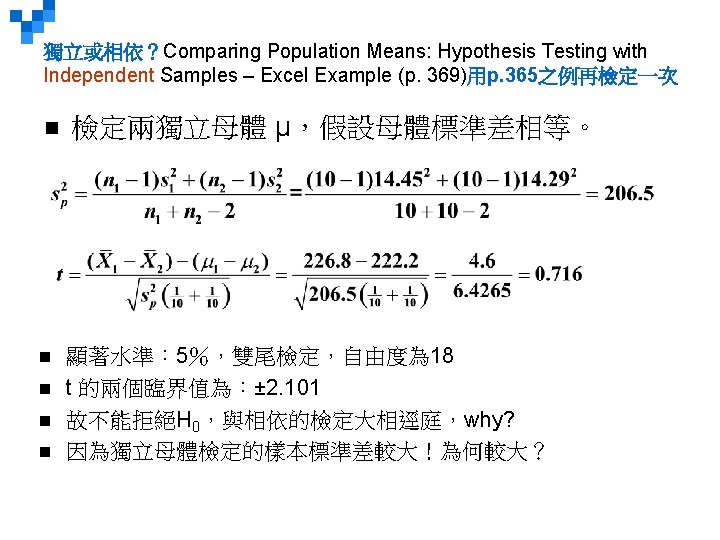
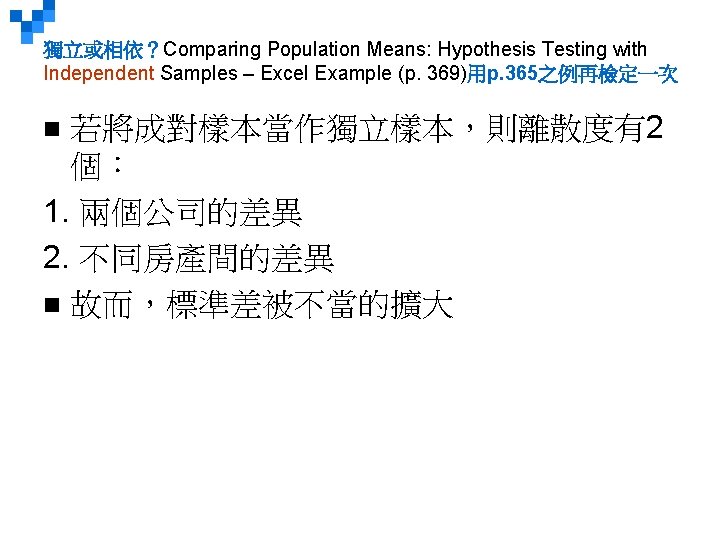
LO 11 -3 獨立或相依?Comparing Population Means: Hypothesis Testing with Independent Samples – Excel Example (p. 369)用p. 365之例再檢定一次 11 -*
ex. 20 (p. 371) The federal government recently granted funds for a special program designed to reduce crime in high-crime areas. A study of the results of the program in eight high-crime areas of Miami, Florida, yielded the following results. Has there been a decrease in the number of crimes since the inauguration of the program? Use the. 01 significance level. Estimate the p-value.
ex. 20 (p. 371) Step 1: H 0: μd ≦ 0 H 1: μd > 0 Step 2: The 0. 01 significance level was chosen Step 3: Use a t-statistic with the standard deviation unknown for a paired sample. Step 4: Reject Ho if t > 2. 998 Step 5: = 3. 625 sd = 4. 8385 Do not reject Ho. Step 6: There has not been a decrease in the number of crimes. From the t-table we estimate the p-value is less than 0. 05 but more than 0. 025, using software we find the p-value is about 0. 036.
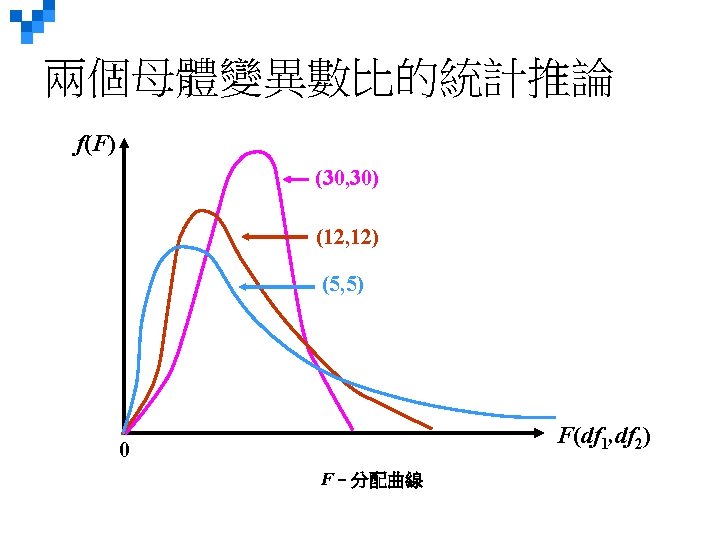
區間估計 2/2 P(F 1–α/2(df 1, df 2)<F<Fα/2(df 1, df 2))=1–α