Turning Data into Outcome Statements Why What is


")


- Slides: 18
Turning Data into Outcome Statements
Why? • What is the objective your survey is measuring? • What type of data did you collect: survey, observation checklist, record book narratives, county event day scores, standards of excellence?
Collection • Code for easy data entry – i. e. make a list of all the ways that count for “decision making” when analyzing self-reports. – Reverse code if necessary • Remove surveys that are incomplete or do not make sense from your data set. • Determine how you will input data: electronic or by hand • How many program participants did you have that you “surveyed” n=#surveyed, number record books turned in, etc. not the number who answered in the affirmative.
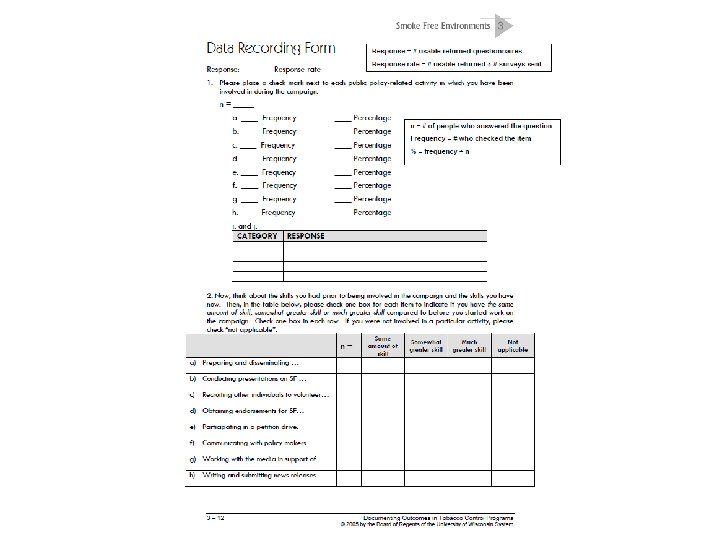
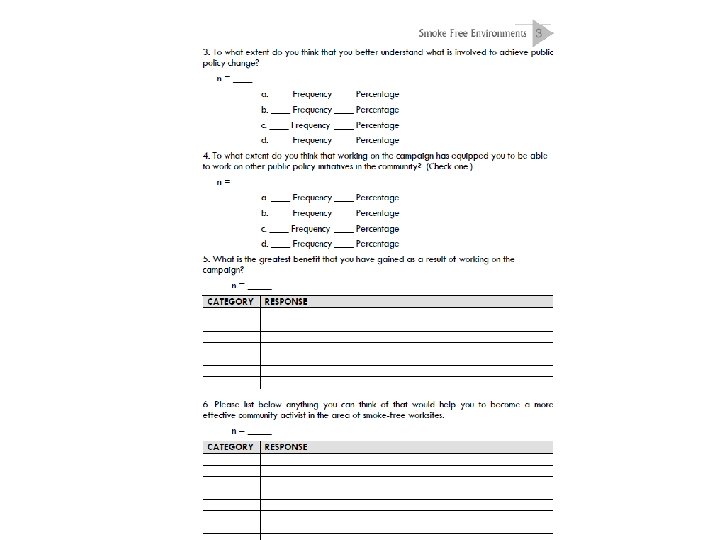
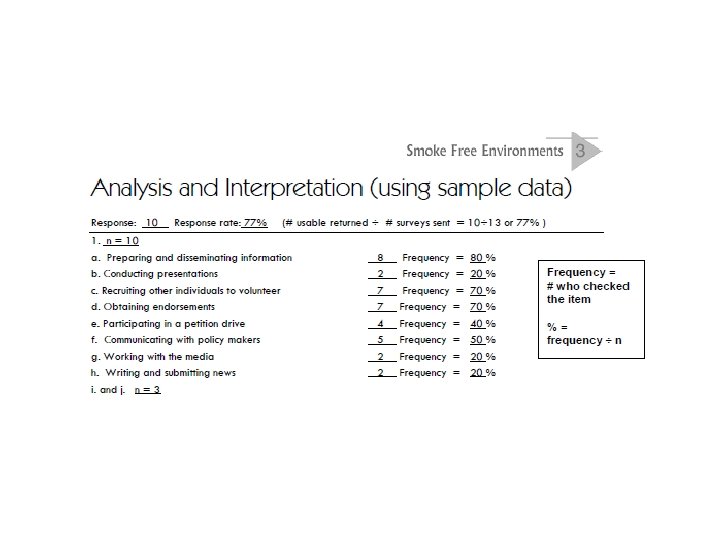
• Sample Data Recording Form • n = number of people who answered the question • Frequency = number who checked the item • % = frequency n *University of Wisconsin Extension PD&E
• If n is less than 30 respondents report frequency vs %; 3 of 10 respondents agreed • If reporting a % always indicate your n value first to ensure accuracy
• Question determines how you calculate. • By box, row, or column to see results most clearly
Supports restaurant ordinance Opposes restaurant ordinance Undecided/ declined to comment 8 (15% of smokers) 33 (60% of smokers) 14 (25% of smokers) Non-smokers (n=200) 170 (86% of nonsmokers) 16 (8% of nonsmokers) 12 (6% of nonsmokers) Total (N=255) 178 (70% of all respondents) 49 (19% of all respondents) 26 (11% of all respondents) Current smokers (n=55)
• Row: n=9 (can “collapse” data to combine categories. All who gained skills regardless of degree 7 of 9 … add frequencies, do not add percentages) • Column: use total number of responses to calculate % i. e. 37 (n/a responses not included)
Know your data • In these examples it is a “self-report” of what people believe to be their improvements, the same with common measures or camp, it is a perception and is not a measure of “actual change”. • What would be a true measure of “actual change” – Pre-post test –.
Quantitative • Observation Check-list ? • Project Story Narrative ? • Always ask your self why you conducted the survey, what was your question
• Code data: – Identify themes/ patterns and organize into categories (determined by research not your own interpretation) – what indicators are you looking for i. e. decision making, responsibility • Identify connections and importance – Tally and Calculate based on frequency (Of n=10 youth who completed a daily journal as a participant of the Explorers 4 -H Day camp 8 youth self-reported their increased appreciation for the outdoors. ) • Identify Relationships – two themes that continually occur together may show cause and effect (a good counselor and a positive camp experience) • Attach meaning and significance – List your key findings and think…what is important, necessary program changes, stakeholder interest, my original objective
Reporting outline follows your logic model
Connect to Evidence • Research available – PDEC Impact Support – Florida 4 -H Evaluation Resources • Outcomes in the short-term lead to Impacts in the long-term
Discussing limitations • Written reports: – Be explicit about your limitations Oral reports: – Be prepared to discuss limitations – Be honest about limitations – Know the claims you cannot make • Do not claim causation without a true experimental design • Do not generalize to the population without random sample and quality administration (e. g. , <60% response rate on a survey)