Turning Data Into Action A Webinar Series for

Turning Data Into Action A Webinar Series for SOHPs Presenting by the ASTDD Data Committee

7 -Part Series Date Topic Presenter May 18 Turning data into action Kathy Phipps, ASTDD June 1 Developing and using state oral health data reports Hawaii & Vermont June 15 Using the CDC Open Data Platform to visualize oral health data Valerie Robison, CDC June 29 Data to Action: Making Better Infographics Carole Stampfel, AMCHP July 13 CANCELLED - RESCHEDULED FOR AUGUST 3 July 27 Web-based oral health data systems – state examples Colorado, Minnesota, Wisconsin August 3 Oral health infographics – state examples Arizona & New Hampshire Using coalitions and partners to spread the message Children’s Health Alliance of Wisconsin, Washington Dental Service Foundation August 10 All webinars are Thursday from 3: 00 -4: 00 Eastern Time
 �Please hold")
General Reminders �This webinar will be recorded & archived (www. astdd. org) �Please hold questions until the end If you have questions, please make a note of them If you want to ask a question at the end, click on the Set Status icon � The little man with his arm raised on either the upper left or the top of your screen. Click on “raise hand” We will then call on you to ask your question �Please respond to the polling questions

Acknowledgements This presentation was supported by Cooperative Agreement NU 58 DP 004919 -05 -00 from CDC, Division of Oral Health. Its contents are solely the responsibility of the authors and do not necessarily represent the official views of CDC.

Data to Action: Making Better Infographics ASTDD Webinar June 29, 2017 Caroline Stampfel, MPH Direct of Programs, AMCHP

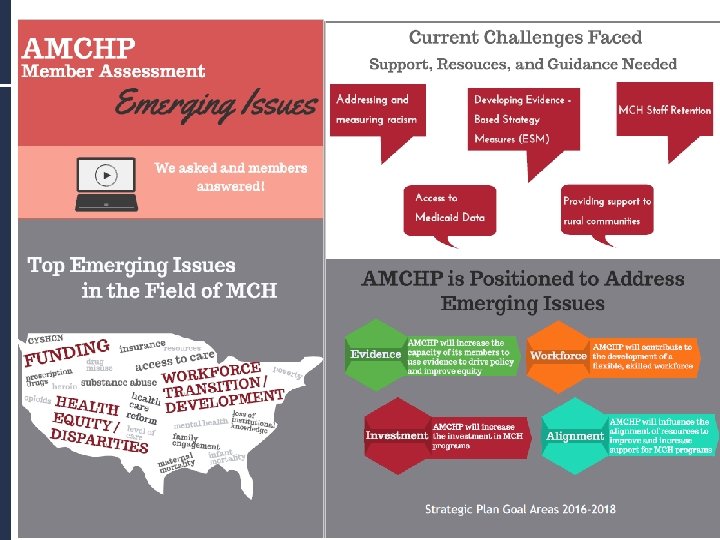
Who is AMCHP? AMCHP is a national resource, partner and advocate for state public health leaders and others working to improve the health of women, children, youth and families, including those with special health care needs. 6

7

What Will I Talk About Today? • Why people use infographics • Some of the ways infographics can go wrong • Some of the ways we are trying to make better infographics • Iterations of infographics we’ve made • Lessons learned 8

What is an Infographic? • Graphic visual representation of information, data or other collections of knowledge 1 • A chart, diagram, or illustration that uses graphic elements to present information in a visually striking way 2 • Data visualizations that present complex information quickly and clearly. Think of maps, signs, and charts used by statisticians or computer scientists: Wherever you have deep data presented in visual shorthand, you’ve got an infographic. 3 1 https: //en. wikipedia. org/wiki/Infographic 2 https: //www. merriam-webster. com/dictionary/infographic 3 https: //visual. ly/m/what-is-an-infographic/ 9

Why Infographics? • Pictures rather than words • Shareable • Bring together a lot of information 10

Where we came from – AMCHP Pulse Data and Trends

Why BETTER Infographics? Some infographics miss the mark, but why? • Too much information • Visualizations that not appropriate for the data • Clashing colors, fonts, hard to read 12
 Put what’s newsworthy at the top Rank our")
LOVED IT (We will try to…) Put what’s newsworthy at the top Rank our data (what’s most important) Include white space Dress up our charts Use meaningful visuals Keep visuals numerically accurate Keep charts simple Tell a story Use complimentary color schemes (find good palettes) Use images that we have purchased (avoid copyright infringement) Include citations for data and images in some way Use PDF as the final output Come up with a catchy title
 HATED IT (We will avoid…) Put what’s newsworthy")
LOVED IT (We will try to…) HATED IT (We will avoid…) Put what’s newsworthy at the top Pie charts Rank our data (what’s most important) Imagery in charts (not always appropriate) Include white space Too much information in one infographic Dress up our charts Too small (print and visuals) Use meaningful visuals Too many fonts Keep visuals numerically accurate Unlabeled / incorrectly labeled axis Keep charts simple Background images that are too busy Tell a story Images that might be divisive Use complimentary color schemes (find good palettes) Using people as “vessels” to show percent because they are not accurate Use images that we have purchased (avoid copyright infringement) Include citations for data and images in some way Use PDF as the final output Come up with a catchy title

We will avoid…

How Do We Make Them Better? Iteration #1

Iteration #2

Iteration #3

Iteration #4 The Final Version

What if you don’t use numbers at all?

Experimenting with Social Math

Where we are now: AMCHP Pulse Data and Trends

We Still Struggle With… • Maps • Too much information in one infographic • Design aesthetics 24

We Feel Good About… • Accurate data visualizations • Pushing the epi/data boundaries • Appropriate citations 25

Our Favorite Resources For making infographics: • Piktochart • https: //piktochart. com/ • Visme • https: //www. visme. co/ • Flat Icon • http: //www. flaticon. com/ 26

Our Favorite Resources For making infographics better: Making charts look cool: http: //piktochart. com/how-to-make-charts-ininfographics-look-good/ Ten tips for designing better infographics: http: //www. dotdash. ie/10 -tips-for -designing-better-infographics 12 infographic tips: https: //blog. kissmetrics. com/12 -infographic-tips/ Do’s and Don’ts of infographic design: http: //www. smashingmagazine. com/2011/10/14/the-dos-and-donts-ofinfographic-design/ 27

Is there a “How-To Guide”? • • Decide what’s on your DO / DON’T list Do you have access to a graphic designer? Reach out to your PIO If you have to do it yourself, get familiar with the programs Who is your audience? How many products do you need? Consider how you will resolve tension between accuracy and style Try it out! 28

Lessons Learned • Collaboration is essential • Agreement on design principles is a good starting point • Nobody gets it right the first time 29

Thank you! Caroline Stampfel Director of Programs cstampfel@amchp. org 30

Questions? If you have a question, please click on the little man with his arm raised icon on either the upper left or the top of your screen. Click on “raise hand. ” We will then call on you to ask your question over the phone.
- Slides: 31