
TURNAROUND COURIERS SROI Report Card Year Four October
TURNAROUND COURIERS SROI Report Card: Year Four October 2005 - September 2006
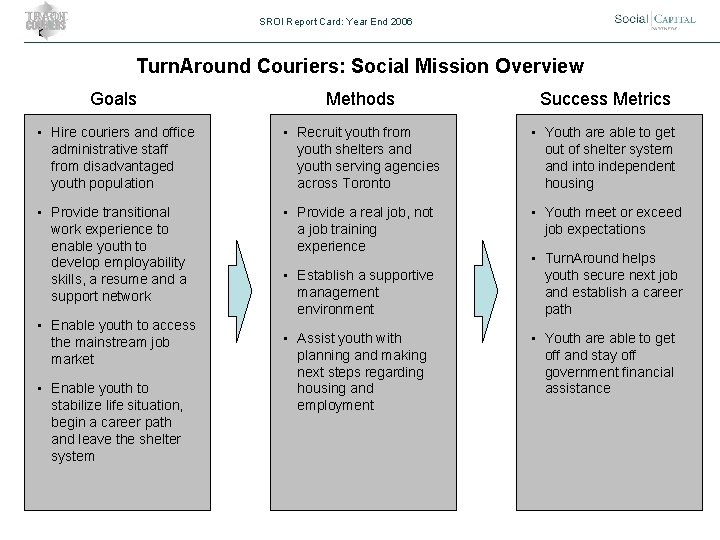
SROI Report Card: Year End 2006 Turn. Around Couriers: Social Mission Overview Goals Methods Success Metrics • Hire couriers and office administrative staff from disadvantaged youth population • Recruit youth from youth shelters and youth serving agencies across Toronto • Youth are able to get out of shelter system and into independent housing • Provide transitional work experience to enable youth to develop employability skills, a resume and a support network • Provide a real job, not a job training experience • Youth meet or exceed job expectations • Enable youth to access the mainstream job market • Enable youth to stabilize life situation, begin a career path and leave the shelter system • Establish a supportive management environment • Assist youth with planning and making next steps regarding housing and employment • Turn. Around helps youth secure next job and establish a career path • Youth are able to get off and stay off government financial assistance
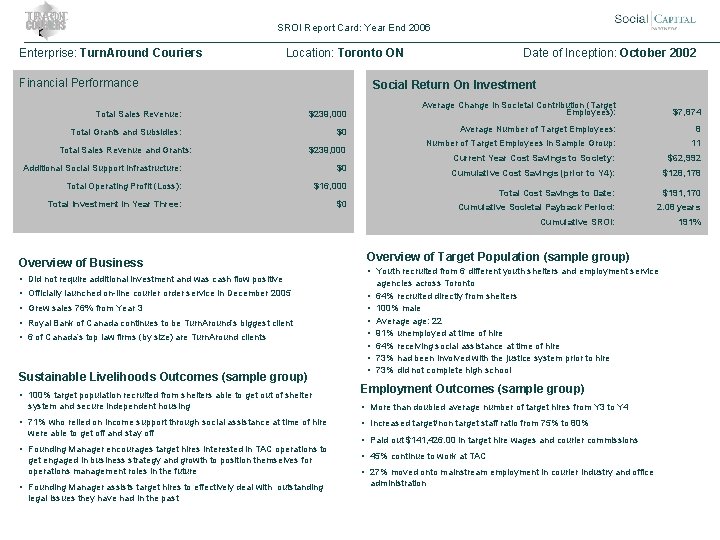
SROI Report Card: Year End 2006 Enterprise: Turn. Around Couriers Location: Toronto ON Financial Performance Date of Inception: October 2002 Social Return On Investment Total Sales Revenue: $239, 000 Average Change in Societal Contribution (Target Employees): $7, 874 Total Grants and Subsidies: $0 Average Number of Target Employees: 8 Number of Target Employees in Sample Group: 11 Current Year Cost Savings to Society: $62, 992 Cumulative Cost Savings (prior to Y 4): $128, 178 Total Cost Savings to Date: $191, 170 Cumulative Societal Payback Period: 2. 08 years Cumulative SROI: 191% Total Sales Revenue and Grants: $239, 000 Additional Social Support Infrastructure: $0 Total Operating Profit (Loss): $16, 000 Total Investment in Year Three: $0 Overview of Business • Did not require additional investment and was cash flow positive • Officially launched on-line courier order service in December 2005 • Grew sales 76% from Year 3 • Royal Bank of Canada continues to be Turn. Around’s biggest client • 6 of Canada’s top law firms (by size) are Turn. Around clients Sustainable Livelihoods Outcomes (sample group) • 100% target population recruited from shelters able to get out of shelter system and secure independent housing • 71% who relied on income support through social assistance at time of hire were able to get off and stay off • Founding Manager encourages target hires interested in TAC operations to get engaged in business strategy and growth to position themselves for operations management roles in the future • Founding Manager assists target hires to effectively deal with outstanding legal issues they have had in the past Overview of Target Population (sample group) • Youth recruited from 6 different youth shelters and employment service • • agencies across Toronto 64% recruited directly from shelters 100% male Average age: 22 91% unemployed at time of hire 64% receiving social assistance at time of hire 73% had been involved with the justice system prior to hire 73% did not complete high school Employment Outcomes (sample group) • More than doubled average number of target hires from Y 3 to Y 4 • Increased target/non target staff ratio from 75% to 80% • Paid out $141, 426. 00 in target hire wages and courier commissions • 45% continue to work at TAC • 27% moved onto mainstream employment in courier industry and office administration
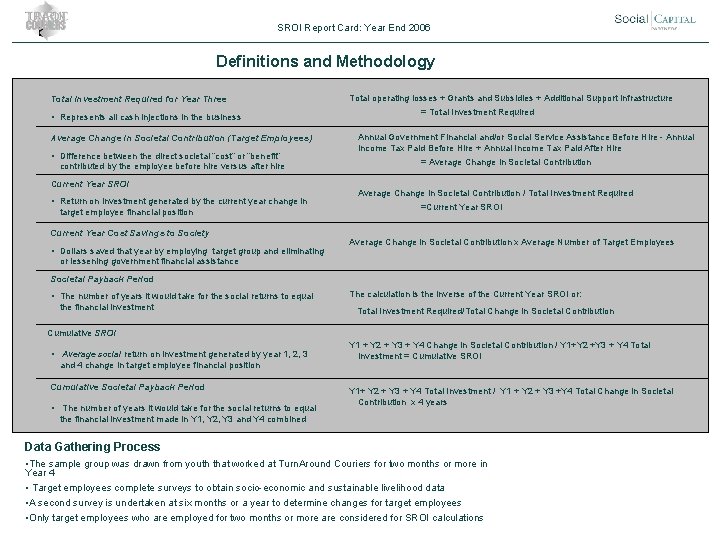
SROI Report Card: Year End 2006 Definitions and Methodology Total Investment Required for Year Three • Represents all cash injections in the business Average Change in Societal Contribution (Target Employees) • Difference between the direct societal “cost” or “benefit” contributed by the employee before hire versus after hire Current Year SROI • Return on investment generated by the current year change in target employee financial position Current Year Cost Savings to Society • Dollars saved that year by employing target group and eliminating Total operating losses + Grants and Subsidies + Additional Support Infrastructure = Total Investment Required Annual Government Financial and/or Social Service Assistance Before Hire - Annual Income Tax Paid Before Hire + Annual Income Tax Paid After Hire = Average Change in Societal Contribution / Total Investment Required =Current Year SROI Average Change in Societal Contribution x Average Number of Target Employees or lessening government financial assistance Societal Payback Period • The number of years it would take for the social returns to equal the financial investment The calculation is the inverse of the Current Year SROI or: Total Investment Required/Total Change in Societal Contribution Cumulative SROI • Average social return on investment generated by year 1, 2, 3 and 4 change in target employee financial position Cumulative Societal Payback Period • The number of years it would take for the social returns to equal Y 1 + Y 2 + Y 3 + Y 4 Change in Societal Contribution / Y 1+Y 2 +Y 3 + Y 4 Total Investment = Cumulative SROI Y 1+ Y 2 + Y 3 + Y 4 Total Investment / Y 1 + Y 2 + Y 3 +Y 4 Total Change in Societal Contribution x 4 years the financial investment made in Y 1, Y 2, Y 3 and Y 4 combined Data Gathering Process • The sample group was drawn from youth that worked at Turn. Around Couriers for two months or more in Year 4 • Target employees complete surveys to obtain socio-economic and sustainable livelihood data • A second survey is undertaken at six months or a year to determine changes for target employees • Only target employees who are employed for two months or more are considered for SROI calculations
- Slides: 4