Turbulence in the Tropical Cyclone Outflow Layer Dave

Turbulence in the Tropical Cyclone Outflow Layer Dave Vollaro Tropical Lunch February 2, 2018

TC Outflow Layer Hurricane Rita 145 kt

TC Outflow Layer Cirrus Canopy: Area of long-lasting cloudiness extending several hundred km from core. It is thickest near the core and slowly descends and thins with radius. Hurricane Rita 145 kt

TC Outflow Layer Cirrus Canopy: Area of long-lasting cloudiness extending several hundred km from core. It is thickest near the core and slowly descends and thins with radius. Banded features: Tied to deep convection as they extend cyclonically outward from the center. Hurricane Rita 145 kt

TC Outflow Layer Cirrus Canopy: Area of long-lasting cloudiness extending several hundred km from core. It is thickest near the core and slowly descends and thins with radius. . Banded features: Tied to deep convection as they extend cyclonically outward from the center. Diurnal pulse features: (Dunion et al. 2014) cloud bands that propagate away from center near sunrise and are located near the 600 km radius by late afternoon. Hurricane Rita 145 kt

TC Outflow Layer Cirrus Canopy: Area of long-lasting cloudiness extending several hundred km from core. It is thickest near the core and slowly descends and thins with radius. Banded features: Tied to deep convection as they move cyclonically outward from the center. Diurnal pulse features: (Dunion et al. 2014) cloud bands that propagate away from center near sunrise and are located near the 600 km radius by late afternoon. Region of widespread turbulence Hurricane Rita 145 kt

Stability Term Shear Term • RB < 1 indicates that turbulence is possible. • RB < 0. 25 indicates that turbulence is likely. • High shear and low stability ideal for turbulence

Previous work 1. Studies of turbulence associated with the MCS outflow layer: • CAT, NCT (Fovell et al. 2007, Lane et al. 2012) • Transverse Bands (Lenz et al. 2009, Trier et al. 2010) 2. Studies of turbulence above the Hurricane outflow layer: • Upper Tropospheric generation of stratospheric Gravity Waves(Pfister et al. 1993, Kuester et al. 2008) • Turbulence within the outflow layer(Kudo 2013, Molinari et al. 2014, Duran and Molinari 2016)

Molinari et al. 2014: Used low RB in G-IV dropsonde data to define three types of turbulent layers observed in the hurricane outflow layer: 1. Turbulence associated with sublimation of ice into dry air below cloud base lowering the static stability(Kudo 2013) 2. Turbulence associated with low static stability regions within CDO cloudiness generated by radiative processes 3. Turbulence associated with large vertical shears outside the CDO associated with the transition to strong anticyclonic outflow

Duran and Molinari 2016 • Maximum in low RB frequency at R=0200 km near 13. 5 km • Slopes down w/radius • Low RB more common in hurricanes. • Small static stability was a more common cause of low RB than high shear. Percentage of Rawindsonde observations of RB <0. 25 in the upper troposphere.
. Net radiation(negative dashed). Vertical profiles of area and temporally")
SW LW Net Total condensate(shaded). Net radiation(negative dashed). Vertical profiles of area and temporally averaged radiative forcing tendencies. Dash=clear sky. Bu et al. 2014

Hurricane Ike 09/10 2008 0915 UTC 80 kt >= 0. 5 ms-2

Hurricane Ike 09/10 2008 0915 UTC 80 kt >= 0. 5 ms-2
 •")
G-IV Flight level Dataset • 1 Hz vertical acceleration data(horizontal spacing ~230 m) • All flights for Atlantic storms between 1998 -2016. • Select all observations within 1000 km of 1 minute Best Track Center and between 12. 8 -14. 8 km altitude. • Place data into 200 km radial bins and 400 m height bins • Calculate LST and subdivide data in to Day and Night datasets • Day 0600 -1800 LST • Night 1800 -0600 LST Total Observations ~5 M Day 3. 4 M Night 1. 6 M

Observation Distribution

Observation Distribution
 Range Cirrus Canopy Transition Outside Canopy Number of Obs (Millions)")
Category IR Brightness Temp(Tb) Range Cirrus Canopy Transition Outside Canopy Number of Obs (Millions) 1. 1 -40 ⁰C < Tb > 0⁰C 1. 5 2. 3

Hurricane Ivan 130 kt 9/9/04 2115 UTC

Hurricane Ivan 130 kt 9/9/04 2115 UTC

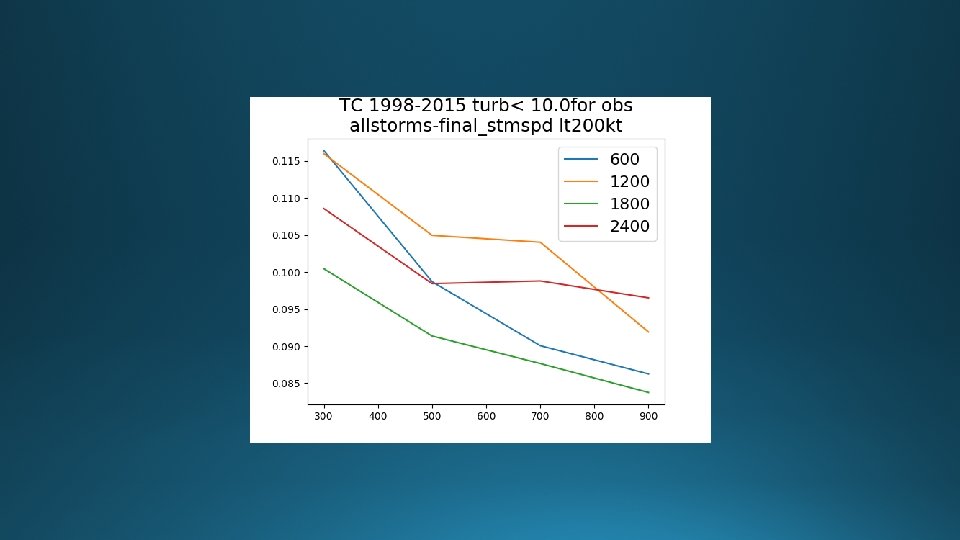
Turbulence vs Radius All Storms

Turbulence vs Radius All Storms Night 7. 3% larger turbulence

Turbulence for TS vs Hurricane

Turbulence for TS vs Hurricane 6% larger turbulence R=0 -600 km

Turbulence according to Cloud Type

Turbulence according to Cloud Type Cirrus 19. 5% larger turbulence
 Upshear Downshear High Shear >10 kt")
All Storms Low Shear (0 -10 kt) Upshear Downshear High Shear >10 kt
")
All Storms Downshear 10% larger turbulence R=0 -600 km Low Shear (0 -10 kt) Upshear Downshear High Shear >10 kt

Hurricane Ivan 115 kt 9/14/04 2255 UTC

Hurricane Ivan 115 kt 9/14/04 2255 UTC 9/15/04 1225 UTC

Hurricane Ivan 09/15/04 115 kt 1015 UTC 1225 UTC

Hurricane Ivan 09/15/04 115 kt 1015 UTC 1225 UTC A 677 0938 UTC R=421 km

Hurricane Ivan 09/15/04 115 kt 1015 UTC 1225 UTC A 678 0951 UTC R=319 km

Hurricane Ivan 09/15/04 115 kt 1015 UTC 1225 UTC A 679 1006 UTC R=308 km

Hurricane Ivan 09/15/04 115 kt 1015 UTC 1225 UTC A 687 1020 UTC R=404 km

Summary • Turbulence R=0 -1000 km 7. 3% greater at night, and near 10% greater at night in Cirrus Canopy. • Hurricanes have more turbulence compared to TDTS, especially in the Cirrus Canopy where it is 6% larger. • Largest turbulence in cirrus clouds at all radii when compared to other IR Tb regimes. • Turbulence R=0 -1000 km within cirrus cloud 10. 2% greater than transition cloud and 19. 2% greater than non-cirrus • Turbulence is impacted by shear with 7. 4% greater values downshear.

Future Work Test for statistical significance of these results, especially at the innermost regions.

Thank You!

 measured by VHF MUradar after Capon processing. Vertical velocity ms-1 Luce.")
Reflectivity (d. B) measured by VHF MUradar after Capon processing. Vertical velocity ms-1 Luce. et. al 2010

A 682 1035 UTC R=481 km A 685 1047 UTC R=424 km No wind information

A 693 0923 UTC R=470 km A 701 1049 UTC R=436 km
 QUADS High Shear(>10 kt)")
All Storms Low Shear (0 -10 kt) QUADS High Shear(>10 kt)

All Storms Low Shear Quads High Shear

Cirrus Transition 13. 0 km C=42 K/05 K T=76 K/16 K N=154 K/32 K Non-Cirrus

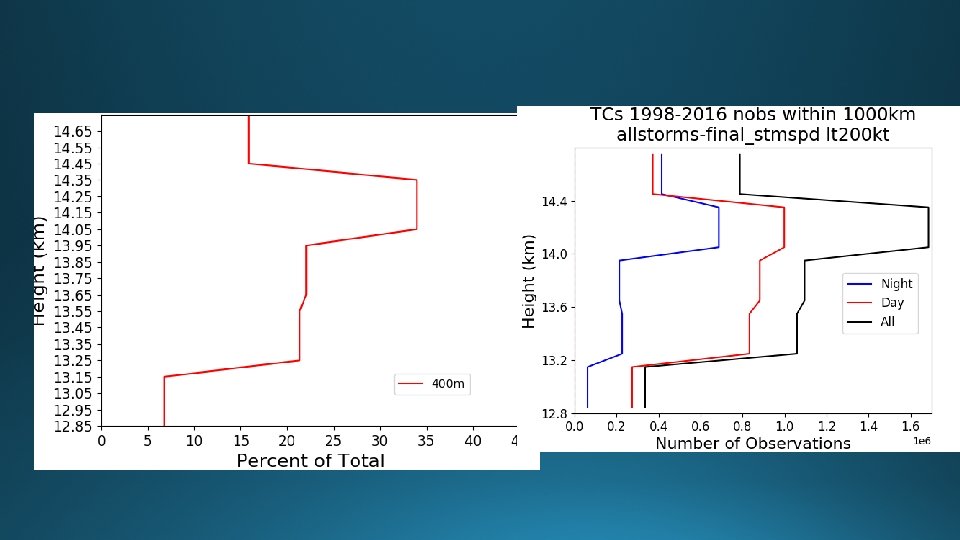
Turbulence vs Height All Storms Daytime 0600 -1800 LST Nobs= 336 K Nighttime 1800 -0600 LST Nobs 161 K

TC Outflow Layer Cirrus Canopy: Horizontally extending long-lasting cloudiness extending several hundred km from core as it slowly descends and thins. Banded features: Tied to deep convection as they move cyclonically outward from the center. Diurnal pulse features: (Dunion et al. 2014) cloud bands that propagate away from center near sunrise to 600 km by late afternoon. Region of widespread turbulence Hurricane Rita 145 kt
- Slides: 49