Tuning Threading Code with Intel Thread Profiler for





- Slides: 39

Tuning Threading Code with Intel® Thread Profiler for Explicit Threads Intel Software College

Objectives After successful completion of this module you will be able to… • Use Thread Profiler to recognize and fix common performance problems in applications using Windows* threads Tuning Threaded Code: Intel® Thread Profiler for Explicit Threads 2 Copyright © 2006, Intel Corporation. All rights reserved. Intel and the Intel logo are trademarks or registered trademarks of Intel Corporation or its subsidiaries in the United States or other countries. *Other brands and names are the property of their respective owners.

Agenda Look at Intel® Thread Profiler features Define Critical Path Analysis Examine Thread Profiler data views available Review common performance issues of multithreaded applications • Focus on Load imbalance • Focus on Synchronization contention Describe general optimizations to gain better performance Tuning Threaded Code: Intel® Thread Profiler for Explicit Threads 3 Copyright © 2006, Intel Corporation. All rights reserved. Intel and the Intel logo are trademarks or registered trademarks of Intel Corporation or its subsidiaries in the United States or other countries. *Other brands and names are the property of their respective owners.

Motivation Developing efficient multithreaded applications is hard New performance problems are caused by the interaction between concurrent threads • Load imbalance • Contention on synchronization objects • Threading overhead Tuning Threaded Code: Intel® Thread Profiler for Explicit Threads 4 Copyright © 2006, Intel Corporation. All rights reserved. Intel and the Intel logo are trademarks or registered trademarks of Intel Corporation or its subsidiaries in the United States or other countries. *Other brands and names are the property of their respective owners.

Intel® Thread Profiler Plugs in to the VTune™ performance environment • Instrumentation-based data collector in VTune Identifies performance issues in Open. MP* or threaded applications using the Win 32* API and POSIX* threads Pinpoints performance bottlenecks that directly affect execution time Tuning Threaded Code: Intel® Thread Profiler for Explicit Threads 5 Copyright © 2006, Intel Corporation. All rights reserved. Intel and the Intel logo are trademarks or registered trademarks of Intel Corporation or its subsidiaries in the United States or other countries. *Other brands and names are the property of their respective owners.

Intel® Thread Profiler Features Supports several different compilers • Intel® C++ and Fortran Compilers, v 7 and higher • Microsoft* Visual* C++, v 6 • Microsoft* Visual* C++. NET* 2002, 2003 & 2005 Editions • Integrated into Microsoft Visual Studio. NET* IDE Binary instrumentation of applications Different views and filters available to assist and organize analysis Uses critical path analysis Tuning Threaded Code: Intel® Thread Profiler for Explicit Threads 6 Copyright © 2006, Intel Corporation. All rights reserved. Intel and the Intel logo are trademarks or registered trademarks of Intel Corporation or its subsidiaries in the United States or other countries. *Other brands and names are the property of their respective owners.

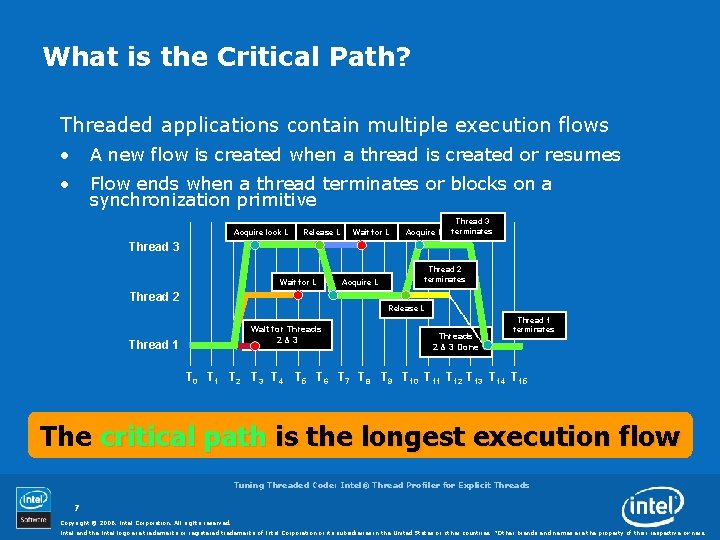
What is the Critical Path? Threaded applications contain multiple execution flows • A new flow is created when a thread is created or resumes • Flow ends when a thread terminates or blocks on a synchronization primitive Acquire lock L Release L Wait for L Acquire L Thread 3 terminates Thread 3 Wait for L Acquire L Thread 2 terminates Thread 2 Release L Wait for Threads 2&3 Thread 1 Threads 2 & 3 Done Thread 1 terminates T 0 T 1 T 2 T 3 T 4 T 5 T 6 T 7 T 8 T 9 T 10 T 11 T 12 T 13 T 14 T 15 The critical path is the longest execution flow Tuning Threaded Code: Intel® Thread Profiler for Explicit Threads 7 Copyright © 2006, Intel Corporation. All rights reserved. Intel and the Intel logo are trademarks or registered trademarks of Intel Corporation or its subsidiaries in the United States or other countries. *Other brands and names are the property of their respective owners.

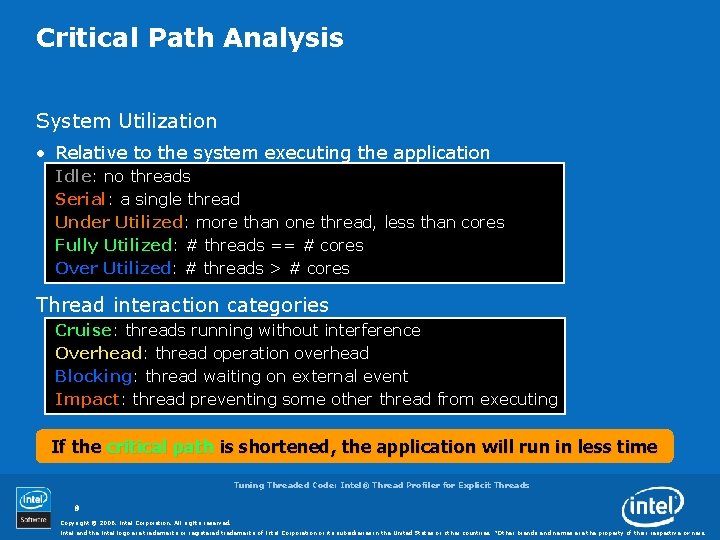
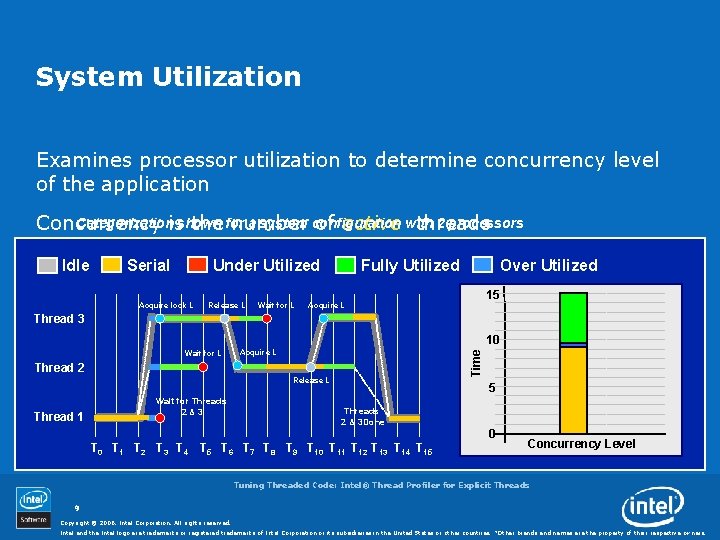
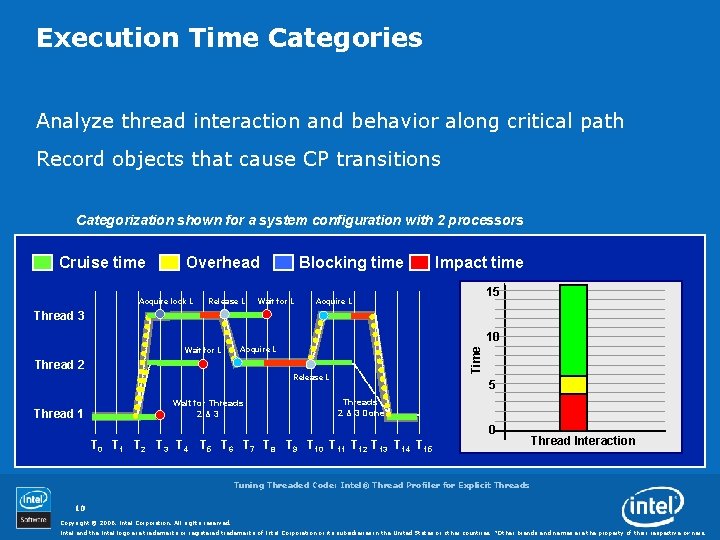
Critical Path Analysis System Utilization • Relative to the system executing the application Idle: no threads Serial: a single thread Under Utilized: more than one thread, less than cores Fully Utilized: # threads == # cores Over Utilized: # threads > # cores Thread interaction categories Cruise: threads running without interference Overhead: thread operation overhead Blocking: thread waiting on external event Impact: thread preventing some other thread from executing If the critical path is shortened, the application will run in less time Tuning Threaded Code: Intel® Thread Profiler for Explicit Threads 8 Copyright © 2006, Intel Corporation. All rights reserved. Intel and the Intel logo are trademarks or registered trademarks of Intel Corporation or its subsidiaries in the United States or other countries. *Other brands and names are the property of their respective owners.

System Utilization Examines processor utilization to determine concurrency level of the application Categorizationis shown a system configuration 2 processors Concurrency the for number of active with threads Idle Serial Under Utilized Acquire lock L Release L Wait for L Fully Utilized Over Utilized 15 Acquire L Thread 3 10 Acquire L Time Wait for L Thread 2 Release L Thread 1 Wait for Threads 2&3 5 Threads 2 & 3 Done T 0 T 1 T 2 T 3 T 4 T 5 T 6 T 7 T 8 T 9 T 10 T 11 T 12 T 13 T 14 T 15 0 Concurrency Level Tuning Threaded Code: Intel® Thread Profiler for Explicit Threads 9 Copyright © 2006, Intel Corporation. All rights reserved. Intel and the Intel logo are trademarks or registered trademarks of Intel Corporation or its subsidiaries in the United States or other countries. *Other brands and names are the property of their respective owners.

Execution Time Categories Analyze thread interaction and behavior along critical path Record objects that cause CP transitions Categorization shown for a system configuration with 2 processors Cruise time Overhead Acquire lock L Release L Blocking time Wait for L Impact time 15 Acquire L Thread 3 10 Acquire L Time Wait for L Thread 2 Release L Thread 1 Wait for Threads 2&3 5 Threads 2 & 3 Done 0 T 1 T 2 T 3 T 4 T 5 T 6 T 7 T 8 T 9 T 10 T 11 T 12 T 13 T 14 T 15 Thread Interaction Tuning Threaded Code: Intel® Thread Profiler for Explicit Threads 10 Copyright © 2006, Intel Corporation. All rights reserved. Intel and the Intel logo are trademarks or registered trademarks of Intel Corporation or its subsidiaries in the United States or other countries. *Other brands and names are the property of their respective owners.

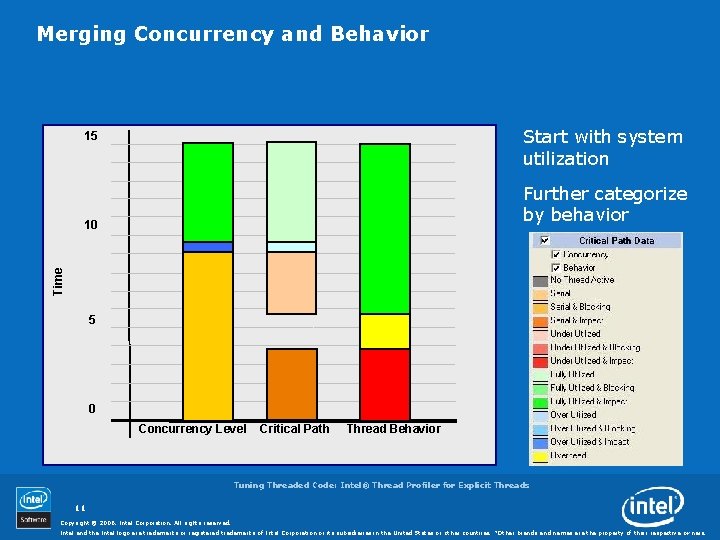
Merging Concurrency and Behavior Start with system utilization 15 Further categorize by behavior Time 10 5 0 Concurrency Level Critical Path Thread Behavior Tuning Threaded Code: Intel® Thread Profiler for Explicit Threads 11 Copyright © 2006, Intel Corporation. All rights reserved. Intel and the Intel logo are trademarks or registered trademarks of Intel Corporation or its subsidiaries in the United States or other countries. *Other brands and names are the property of their respective owners.

Thread Profiler Views Critical Path View • Shows breakdown of the critical path Profile View • Shows the breakdown of selected critical paths • User can select other views of the selected profile • Concurrency level, threads, objects Timeline View • Shows thread activity and critical path transitions for the entire application Source View • Transition source view, creation source view Tuning Threaded Code: Intel® Thread Profiler for Explicit Threads 12 Copyright © 2006, Intel Corporation. All rights reserved. Intel and the Intel logo are trademarks or registered trademarks of Intel Corporation or its subsidiaries in the United States or other countries. *Other brands and names are the property of their respective owners.

Activity 1 a Threaded version of potential code • Is there a performance issue? Goal • Run application through Thread Profiler • Examine thread activities by reviewing different views Tuning Threaded Code: Intel® Thread Profiler for Explicit Threads 13 Copyright © 2006, Intel Corporation. All rights reserved. Intel and the Intel logo are trademarks or registered trademarks of Intel Corporation or its subsidiaries in the United States or other countries. *Other brands and names are the property of their respective owners.

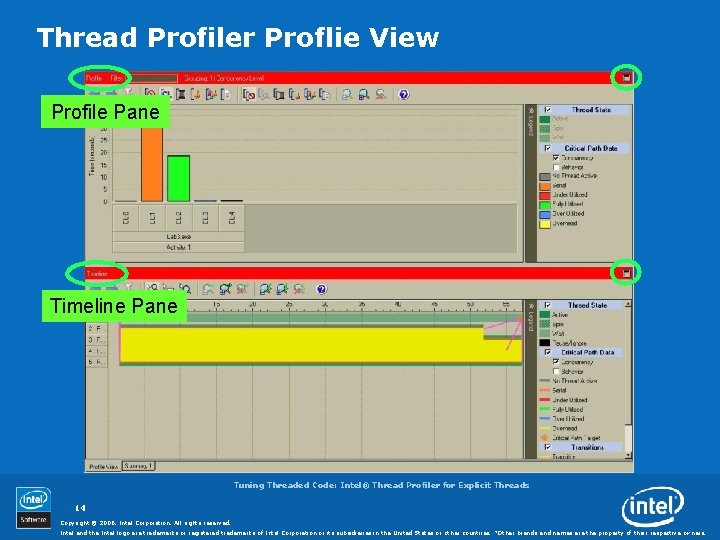
Thread Profiler Proflie View Profile Pane Timeline Pane Tuning Threaded Code: Intel® Thread Profiler for Explicit Threads 14 Copyright © 2006, Intel Corporation. All rights reserved. Intel and the Intel logo are trademarks or registered trademarks of Intel Corporation or its subsidiaries in the United States or other countries. *Other brands and names are the property of their respective owners.

Profile Pane – Concurrency Level View Let’s look at the Concurrency Thread View Level View Ran single threaded ~65% of the time Two threads ran in parallel ~33% of the time Tuning Threaded Code: Intel® Thread Profiler for Explicit Threads 15 Copyright © 2006, Intel Corporation. All rights reserved. Intel and the Intel logo are trademarks or registered trademarks of Intel Corporation or its subsidiaries in the United States or other countries. *Other brands and names are the property of their respective owners.

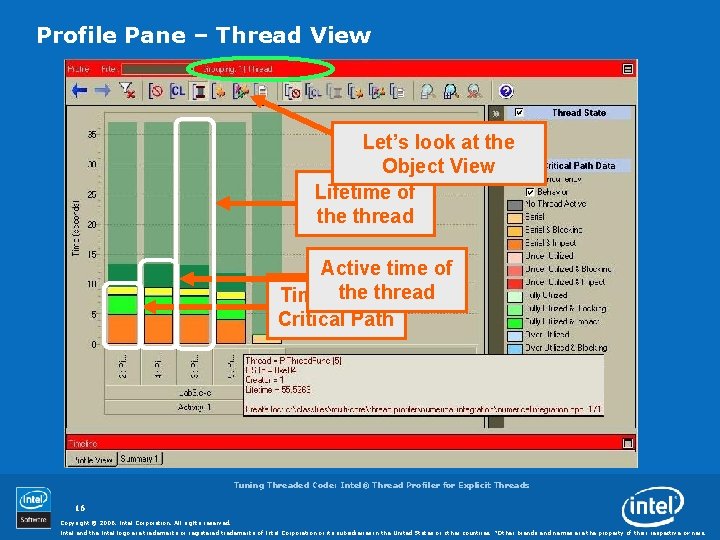
Profile Pane – Thread View Let’s look at the Object View Lifetime of the thread Active time of thethe thread Time on Critical Path Tuning Threaded Code: Intel® Thread Profiler for Explicit Threads 16 Copyright © 2006, Intel Corporation. All rights reserved. Intel and the Intel logo are trademarks or registered trademarks of Intel Corporation or its subsidiaries in the United States or other countries. *Other brands and names are the property of their respective owners.

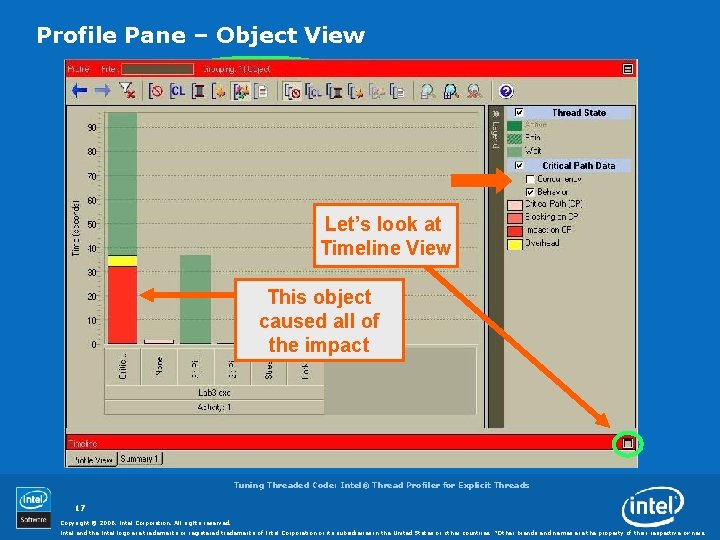
Profile Pane – Object View Let’s look at Timeline View This object caused all of the impact Tuning Threaded Code: Intel® Thread Profiler for Explicit Threads 17 Copyright © 2006, Intel Corporation. All rights reserved. Intel and the Intel logo are trademarks or registered trademarks of Intel Corporation or its subsidiaries in the United States or other countries. *Other brands and names are the property of their respective owners.

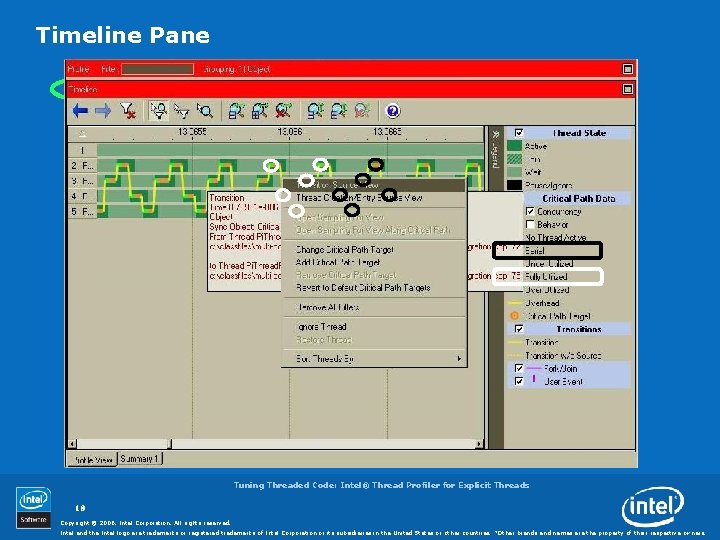
Timeline Pane Tuning Threaded Code: Intel® Thread Profiler for Explicit Threads 18 Copyright © 2006, Intel Corporation. All rights reserved. Intel and the Intel logo are trademarks or registered trademarks of Intel Corporation or its subsidiaries in the United States or other countries. *Other brands and names are the property of their respective owners.

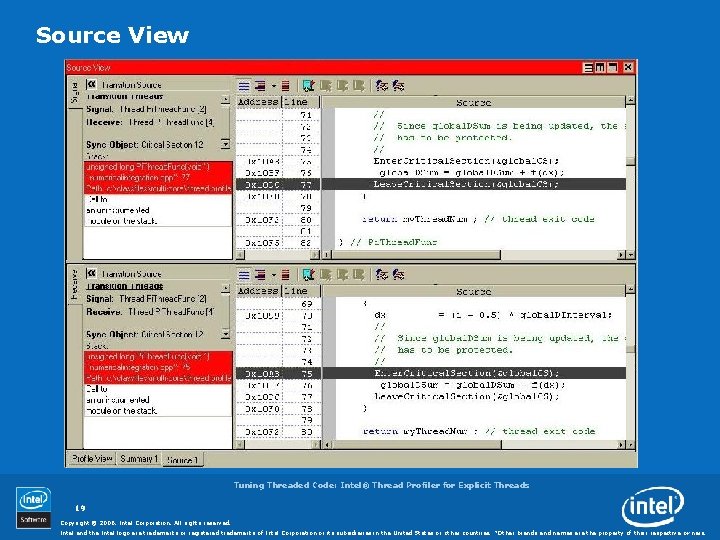
Source View Tuning Threaded Code: Intel® Thread Profiler for Explicit Threads 19 Copyright © 2006, Intel Corporation. All rights reserved. Intel and the Intel logo are trademarks or registered trademarks of Intel Corporation or its subsidiaries in the United States or other countries. *Other brands and names are the property of their respective owners.

Activity 1 b Threaded version of potential code • Is there a performance issue? Goal • Examine thread activities by reviewing different views • Determine system utilization • Identify any performance issues Tuning Threaded Code: Intel® Thread Profiler for Explicit Threads 20 Copyright © 2006, Intel Corporation. All rights reserved. Intel and the Intel logo are trademarks or registered trademarks of Intel Corporation or its subsidiaries in the United States or other countries. *Other brands and names are the property of their respective owners.

Review Activity 1 Concurrency Level view can be used to determine system utilization by the application Timeline view enables you to understand the thread activity in your application Instrumentation time will be included in first run results; thus, for applications running in a short amount of time, a second run may produce more realistic timings. Tuning Threaded Code: Intel® Thread Profiler for Explicit Threads 21 Copyright © 2006, Intel Corporation. All rights reserved. Intel and the Intel logo are trademarks or registered trademarks of Intel Corporation or its subsidiaries in the United States or other countries. *Other brands and names are the property of their respective owners.

Common Performance Issues Load balance • Improper distribution of parallel work Synchronization • Excessive use of global data, contention for the same synchronization object Parallel Overhead • Due to thread creation, scheduling. . Granularity • No sufficient parallel work Tuning Threaded Code: Intel® Thread Profiler for Explicit Threads 22 Copyright © 2006, Intel Corporation. All rights reserved. Intel and the Intel logo are trademarks or registered trademarks of Intel Corporation or its subsidiaries in the United States or other countries. *Other brands and names are the property of their respective owners.

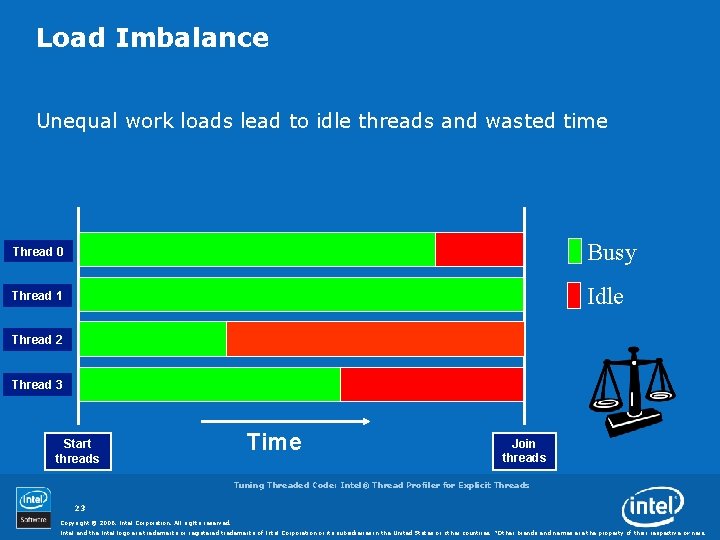
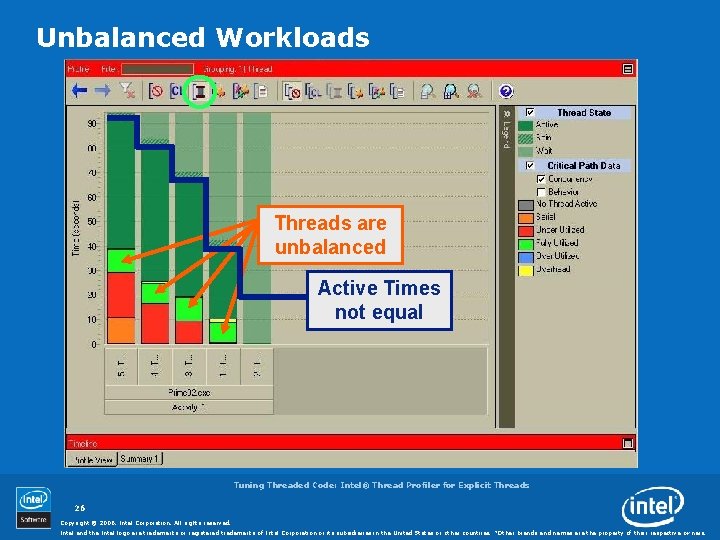
Load Imbalance Unequal work loads lead to idle threads and wasted time Thread 0 Busy Thread 1 Idle Thread 2 Thread 3 Start threads Time Join threads Tuning Threaded Code: Intel® Thread Profiler for Explicit Threads 23 Copyright © 2006, Intel Corporation. All rights reserved. Intel and the Intel logo are trademarks or registered trademarks of Intel Corporation or its subsidiaries in the United States or other countries. *Other brands and names are the property of their respective owners.

Redistribute Work to Threads Static assignment • Are the same number of tasks assigned to each thread? • Do tasks take different processing time? • • Do tasks change in a predictable pattern? • Rearrange (static) order of assignment to threads Use dynamic assignment of tasks Tuning Threaded Code: Intel® Thread Profiler for Explicit Threads 24 Copyright © 2006, Intel Corporation. All rights reserved. Intel and the Intel logo are trademarks or registered trademarks of Intel Corporation or its subsidiaries in the United States or other countries. *Other brands and names are the property of their respective owners.

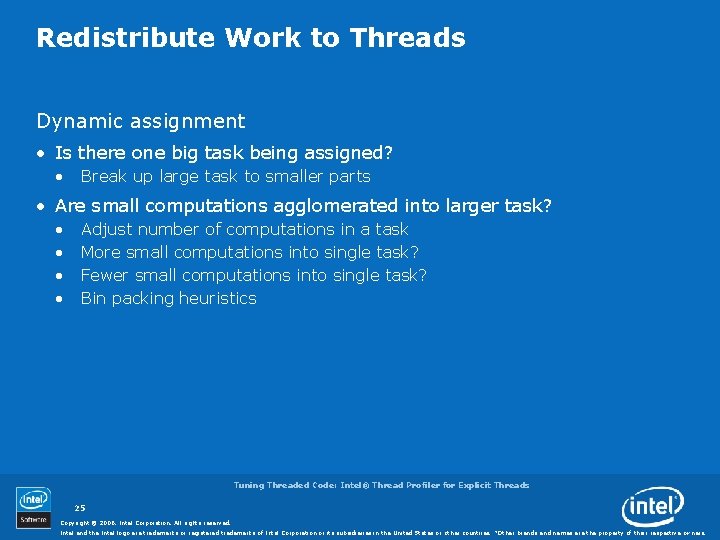
Redistribute Work to Threads Dynamic assignment • Is there one big task being assigned? • Break up large task to smaller parts • Are small computations agglomerated into larger task? • • Adjust number of computations in a task More small computations into single task? Fewer small computations into single task? Bin packing heuristics Tuning Threaded Code: Intel® Thread Profiler for Explicit Threads 25 Copyright © 2006, Intel Corporation. All rights reserved. Intel and the Intel logo are trademarks or registered trademarks of Intel Corporation or its subsidiaries in the United States or other countries. *Other brands and names are the property of their respective owners.

Unbalanced Workloads Threads are unbalanced Active Times not equal Tuning Threaded Code: Intel® Thread Profiler for Explicit Threads 26 Copyright © 2006, Intel Corporation. All rights reserved. Intel and the Intel logo are trademarks or registered trademarks of Intel Corporation or its subsidiaries in the United States or other countries. *Other brands and names are the property of their respective owners.

Activity 2 – Load Imbalance Threaded version of potential code with thread pools • Has a load balance performance issue Tuning Threaded Code: Intel® Thread Profiler for Explicit Threads 27 Copyright © 2006, Intel Corporation. All rights reserved. Intel and the Intel logo are trademarks or registered trademarks of Intel Corporation or its subsidiaries in the United States or other countries. *Other brands and names are the property of their respective owners.

Review Activity 2 Threads view can be used to determine activity levels of each thread within the application Timeline view enables you to understand the thread activity in your application Tuning Threaded Code: Intel® Thread Profiler for Explicit Threads 28 Copyright © 2006, Intel Corporation. All rights reserved. Intel and the Intel logo are trademarks or registered trademarks of Intel Corporation or its subsidiaries in the United States or other countries. *Other brands and names are the property of their respective owners.

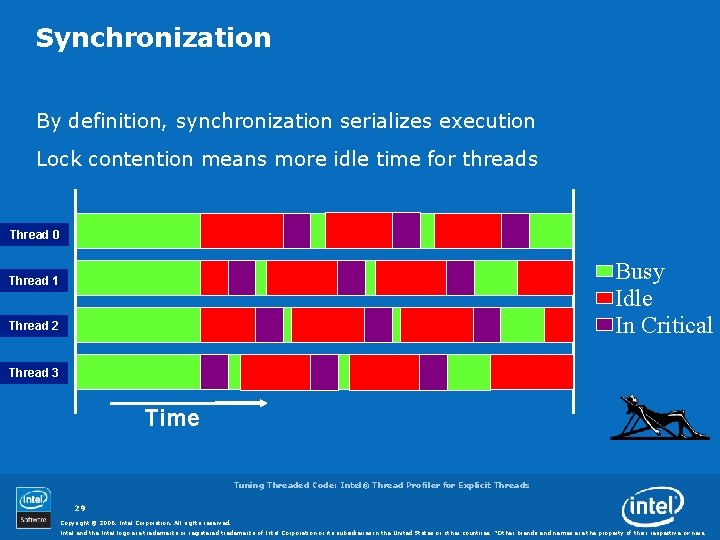
Synchronization By definition, synchronization serializes execution Lock contention means more idle time for threads Thread 0 Busy Idle In Critical Thread 1 Thread 2 Thread 3 Time Tuning Threaded Code: Intel® Thread Profiler for Explicit Threads 29 Copyright © 2006, Intel Corporation. All rights reserved. Intel and the Intel logo are trademarks or registered trademarks of Intel Corporation or its subsidiaries in the United States or other countries. *Other brands and names are the property of their respective owners.

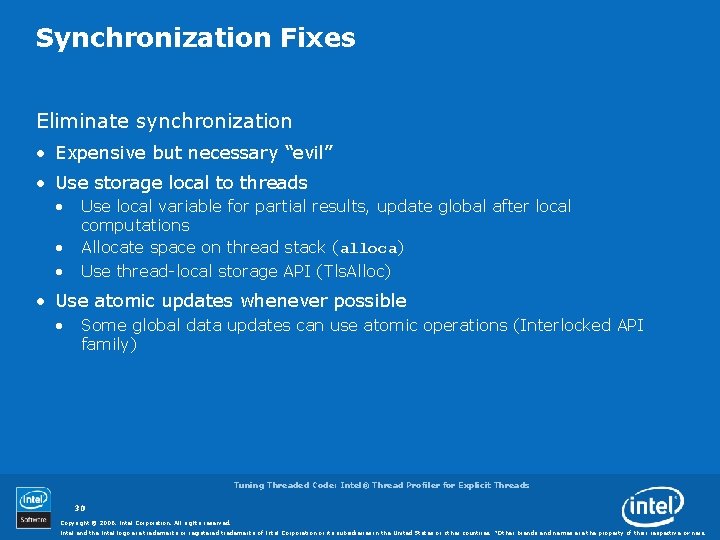
Synchronization Fixes Eliminate synchronization • Expensive but necessary “evil” • Use storage local to threads • • Use local variable for partial results, update global after local computations Allocate space on thread stack (alloca) • Use thread-local storage API (Tls. Alloc) • Use atomic updates whenever possible • Some global data updates can use atomic operations (Interlocked API family) Tuning Threaded Code: Intel® Thread Profiler for Explicit Threads 30 Copyright © 2006, Intel Corporation. All rights reserved. Intel and the Intel logo are trademarks or registered trademarks of Intel Corporation or its subsidiaries in the United States or other countries. *Other brands and names are the property of their respective owners.

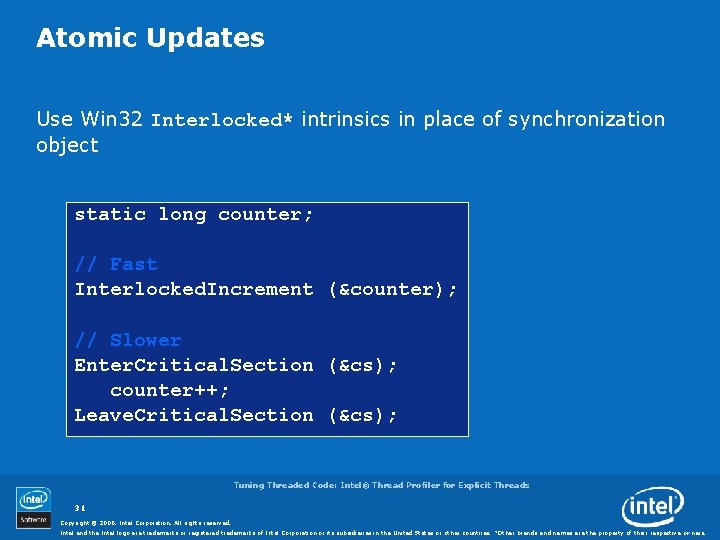
Atomic Updates Use Win 32 Interlocked* intrinsics in place of synchronization object static long counter; // Fast Interlocked. Increment (&counter); // Slower Enter. Critical. Section (&cs); counter++; Leave. Critical. Section (&cs); Tuning Threaded Code: Intel® Thread Profiler for Explicit Threads 31 Copyright © 2006, Intel Corporation. All rights reserved. Intel and the Intel logo are trademarks or registered trademarks of Intel Corporation or its subsidiaries in the United States or other countries. *Other brands and names are the property of their respective owners.

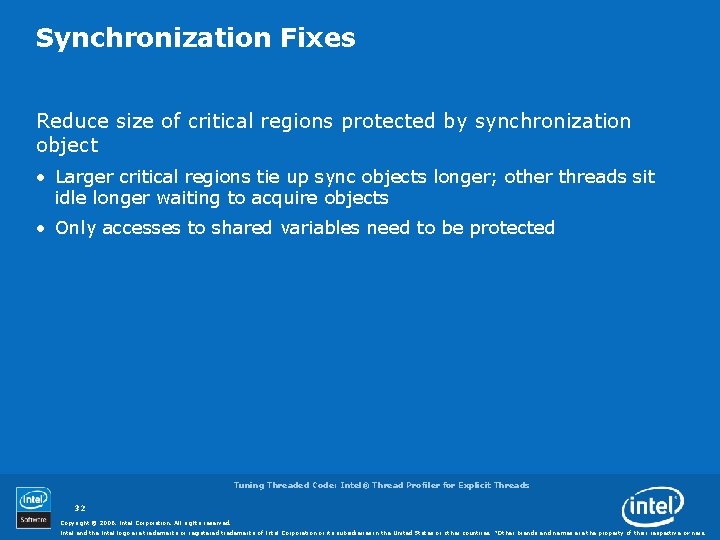
Synchronization Fixes Reduce size of critical regions protected by synchronization object • Larger critical regions tie up sync objects longer; other threads sit idle longer waiting to acquire objects • Only accesses to shared variables need to be protected Tuning Threaded Code: Intel® Thread Profiler for Explicit Threads 32 Copyright © 2006, Intel Corporation. All rights reserved. Intel and the Intel logo are trademarks or registered trademarks of Intel Corporation or its subsidiaries in the United States or other countries. *Other brands and names are the property of their respective owners.

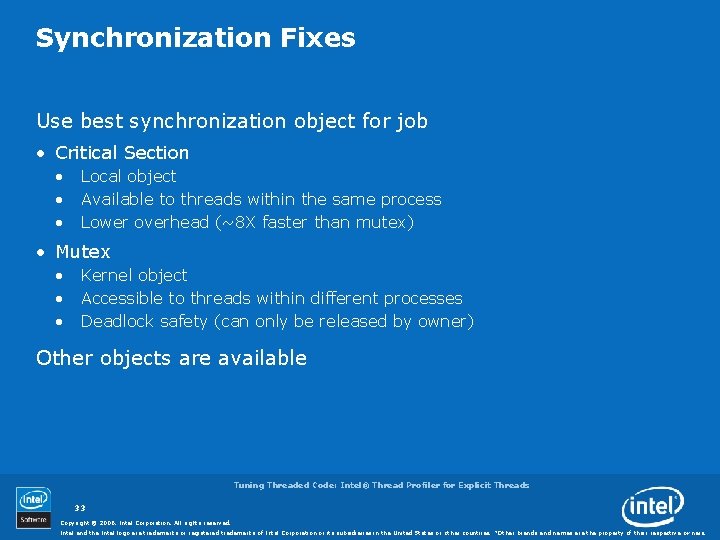
Synchronization Fixes Use best synchronization object for job • Critical Section • • • Local object Available to threads within the same process Lower overhead (~8 X faster than mutex) • Mutex • • • Kernel object Accessible to threads within different processes Deadlock safety (can only be released by owner) Other objects are available Tuning Threaded Code: Intel® Thread Profiler for Explicit Threads 33 Copyright © 2006, Intel Corporation. All rights reserved. Intel and the Intel logo are trademarks or registered trademarks of Intel Corporation or its subsidiaries in the United States or other countries. *Other brands and names are the property of their respective owners.

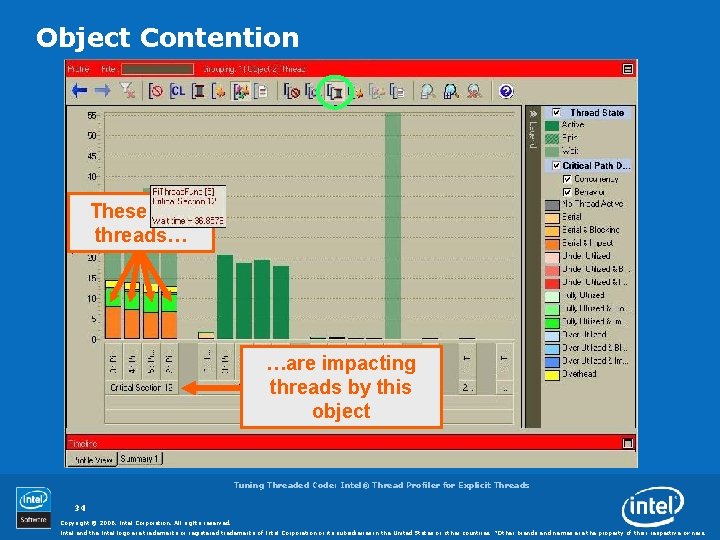
Object Contention These four threads… What is all this? This object caused all of the impact …are impacting threads by this object Tuning Threaded Code: Intel® Thread Profiler for Explicit Threads 34 Copyright © 2006, Intel Corporation. All rights reserved. Intel and the Intel logo are trademarks or registered trademarks of Intel Corporation or its subsidiaries in the United States or other countries. *Other brands and names are the property of their respective owners.

Activity 3 Threaded version of numerical integration • Has serious performance issues Goal • Understand thread activity • Use the Thread Profiler groupings • Examine synchronization and its effect on performance • Fix performance issue Tuning Threaded Code: Intel® Thread Profiler for Explicit Threads 35 Copyright © 2006, Intel Corporation. All rights reserved. Intel and the Intel logo are trademarks or registered trademarks of Intel Corporation or its subsidiaries in the United States or other countries. *Other brands and names are the property of their respective owners.

Review Activity 3 Grouping objects and threads provides the information on which objects impact what threads Apply the heuristics from labs for locating bottlenecks in the source code For longer running applications, the difference in first and second runtimes is negligible Tuning Threaded Code: Intel® Thread Profiler for Explicit Threads 36 Copyright © 2006, Intel Corporation. All rights reserved. Intel and the Intel logo are trademarks or registered trademarks of Intel Corporation or its subsidiaries in the United States or other countries. *Other brands and names are the property of their respective owners.

General Optimizations Serial Optimizations • Serial optimizations along the critical path should affect execution time Parallel Optimizations • Reduce synchronization object contention • Balance workload • Functional parallelism Analyze benefit of increasing number of processors Analyze the effect of increasing the number of threads on scaling performance Tuning Threaded Code: Intel® Thread Profiler for Explicit Threads 37 Copyright © 2006, Intel Corporation. All rights reserved. Intel and the Intel logo are trademarks or registered trademarks of Intel Corporation or its subsidiaries in the United States or other countries. *Other brands and names are the property of their respective owners.

Intel® Thread Profiler for Explicit Threads What’s Been Covered Identifying performance issues can be time consuming without tools Tools are required to understand to optimize parallel efficiency and hardware utilization Thread Profiler helps you understand your applications thread activity, system utilization, and scaling performance Tuning Threaded Code: Intel® Thread Profiler for Explicit Threads 38 Copyright © 2006, Intel Corporation. All rights reserved. Intel and the Intel logo are trademarks or registered trademarks of Intel Corporation or its subsidiaries in the United States or other countries. *Other brands and names are the property of their respective owners.

Tuning Threaded Code: Intel® Thread Profiler for Explicit Threads 39 Copyright © 2006, Intel Corporation. All rights reserved. Intel and the Intel logo are trademarks or registered trademarks of Intel Corporation or its subsidiaries in the United States or other countries. *Other brands and names are the property of their respective owners.