
Tuning Parallel Code on Solaris Lessons Learned from

- Slides: 39
Tuning Parallel Code on Solaris — Lessons Learned from HPC Dani Flexer dani@daniflexer. com Presentation to the London Open. Solaris User Group Based on a Sun White Paper of the same name published © 2009 Dani Flexer 09/09 dani@daniflexer. com�
Agenda • Background • Performance analysis on Solaris • Examples of using DTrace for performance analysis – Thread scheduling – I/O performance • Conclusion © 2009 Dani Flexer dani@daniflexer. com�
Background • Business processing increasingly requires parallel applications – Multicore CPUs dominant – Multi-server and multi-CPU applications prevalent – Both models perform best with parallel code • Performance tuning of parallel code is required in most environments © 2009 Dani Flexer dani@daniflexer. com�
Challenges • Due to the complex interactions in parallel systems, tuning parallel code in test environments is often ineffective • Conventional tools are not well suited to analysis of parallel code • Tuning production environments with most conventional tools is risky © 2009 Dani Flexer dani@daniflexer. com�
Some System Analysis Tools • intrstat — gathers and displays run-time interrupt statistics • busstat — reports memory bus related performance statistics • cputrack, cpustat — monitor system and/or application performance using CPU hardware counters • trapstat — reports trap statistics • prstat — reports active process statistics • vmstat — reports memory statistics © 2009 Dani Flexer dani@daniflexer. com�
Studio Performance Analyzer • Collector — collects performance related data for an application • Analyzer — analyzes and displays data • Can run directly on unmodified production code • Supports – Clock-counter and hardware-counter memory allocation tracing – Other hardware counters – MPI tracing © 2009 Dani Flexer dani@daniflexer. com�
DTrace • A framework that allows the dynamic instrumentation of both kernel and user level code • Permits users to trace system data safely without affecting performance • Programmable in D – No control statements — flow depends on state of specific data through predicates © 2009 Dani Flexer dani@daniflexer. com�
Observability — a key Solaris design goal • Observability is a measure for how well internal states of a system can be inferred by knowledge of its external Wikipedia outputs. • DTrace is arguably the best observability tool available © 2009 Dani Flexer dani@daniflexer. com�
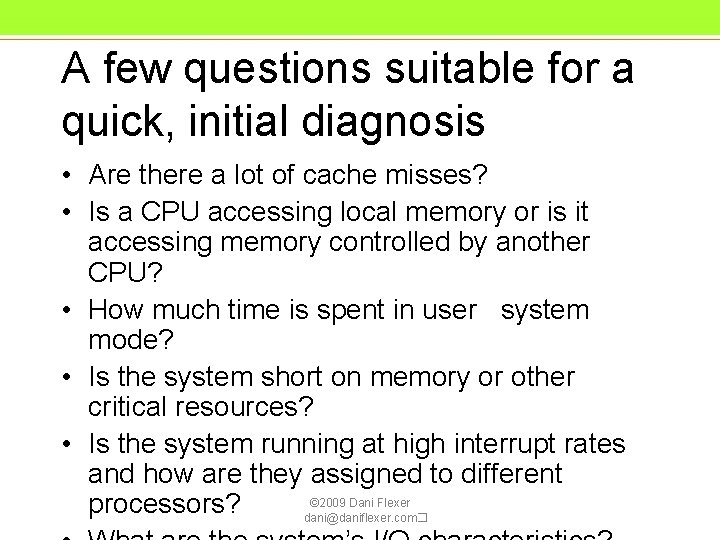
A few questions suitable for a quick, initial diagnosis • Are there a lot of cache misses? • Is a CPU accessing local memory or is it accessing memory controlled by another CPU? • How much time is spent in user system mode? • Is the system short on memory or other critical resources? • Is the system running at high interrupt rates and how are they assigned to different © 2009 Dani Flexer processors? dani@daniflexer. com�
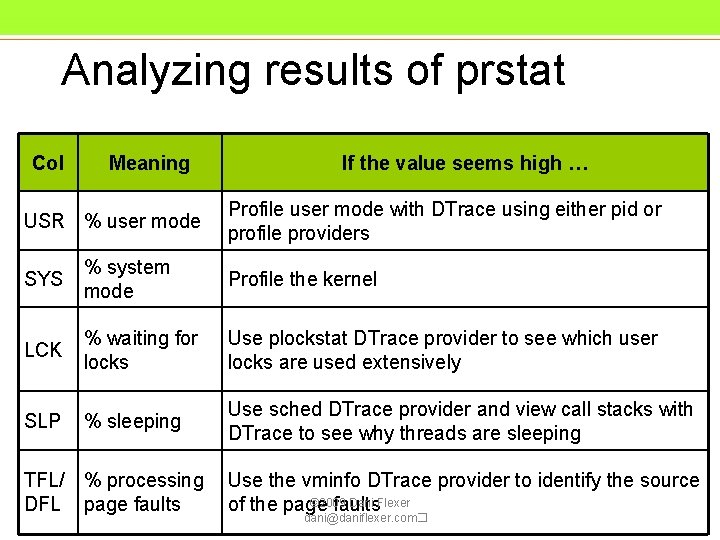
Analyzing results of prstat Col Meaning USR % user mode If the value seems high … Profile user mode with DTrace using either pid or profile providers SYS % system mode Profile the kernel LCK % waiting for locks Use plockstat DTrace provider to see which user locks are used extensively SLP % sleeping Use sched DTrace provider and view call stacks with DTrace to see why threads are sleeping TFL/ % processing DFL page faults Use the vminfo DTrace provider to identify the source © 2009 Dani Flexer of the page faults dani@daniflexer. com�
Two practical examples • Thread Scheduling Analysis • I/O Performance Problems • See the White Paper for more! © 2009 Dani Flexer dani@daniflexer. com�
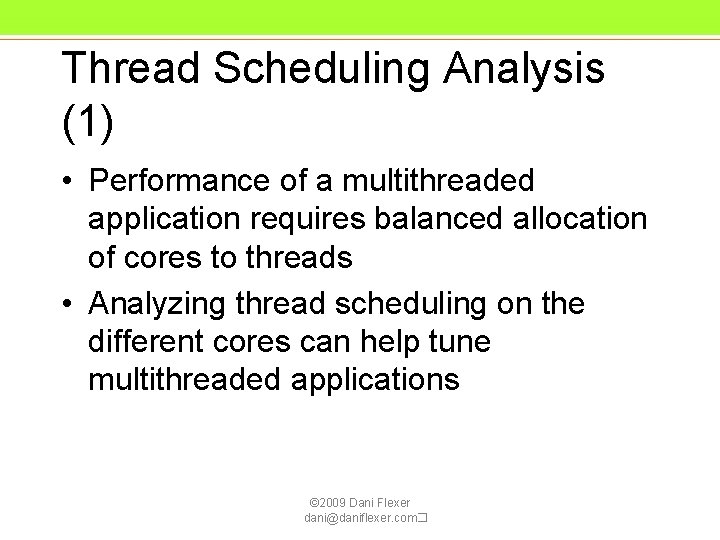
Thread Scheduling Analysis (1) • Performance of a multithreaded application requires balanced allocation of cores to threads • Analyzing thread scheduling on the different cores can help tune multithreaded applications © 2009 Dani Flexer dani@daniflexer. com�
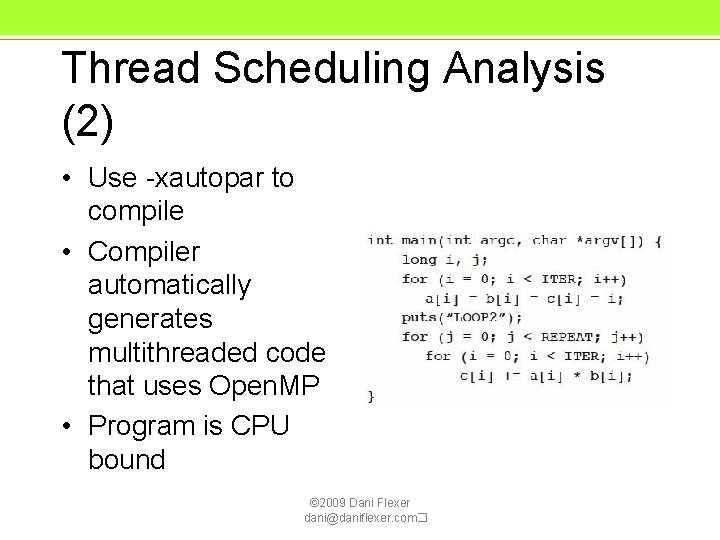
Thread Scheduling Analysis (2) • Use -xautopar to compile • Compiler automatically generates multithreaded code that uses Open. MP • Program is CPU bound © 2009 Dani Flexer dani@daniflexer. com�
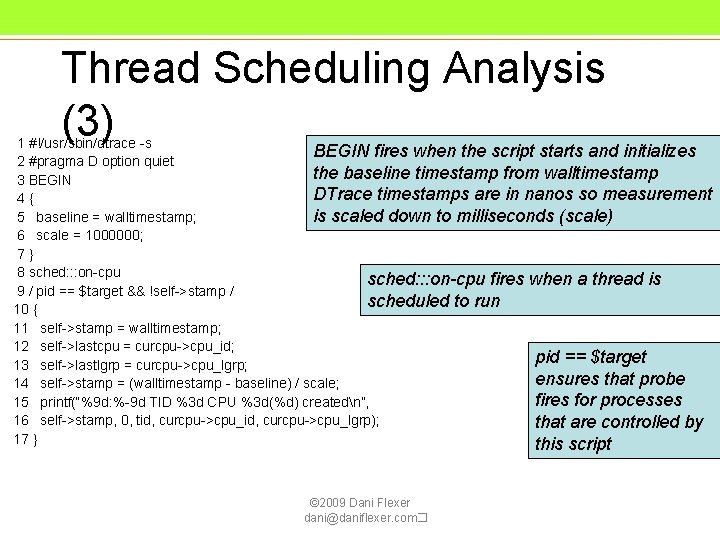
Thread Scheduling Analysis (3) BEGIN fires when the script starts and initializes 1 #!/usr/sbin/dtrace -s 2 #pragma D option quiet the baseline timestamp from walltimestamp 3 BEGIN DTrace timestamps are in nanos so measurement 4{ 5 baseline = walltimestamp; is scaled down to milliseconds (scale) 6 scale = 1000000; 7} 8 sched: : : on-cpu fires when a thread is 9 / pid == $target && !self->stamp / scheduled to run 10 { 11 self->stamp = walltimestamp; 12 self->lastcpu = curcpu->cpu_id; pid == $target 13 self->lastlgrp = curcpu->cpu_lgrp; ensures that probe 14 self->stamp = (walltimestamp - baseline) / scale; fires for processes 15 printf(“%9 d: %-9 d TID %3 d CPU %3 d(%d) createdn”, 16 self->stamp, 0, tid, curcpu->cpu_lgrp); that are controlled by 17 } this script © 2009 Dani Flexer dani@daniflexer. com�
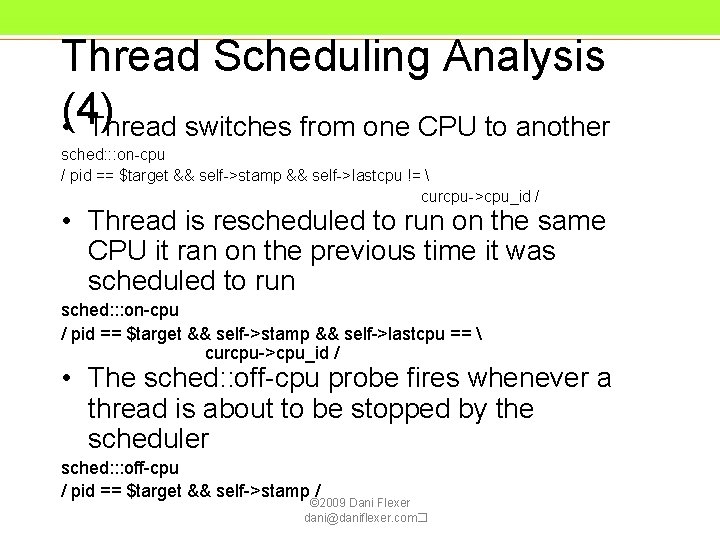
Thread Scheduling Analysis (4) • Thread switches from one CPU to another sched: : : on-cpu / pid == $target && self->stamp && self->lastcpu != curcpu->cpu_id / • Thread is rescheduled to run on the same CPU it ran on the previous time it was scheduled to run sched: : : on-cpu / pid == $target && self->stamp && self->lastcpu == curcpu->cpu_id / • The sched: : off-cpu probe fires whenever a thread is about to be stopped by the scheduler sched: : : off-cpu / pid == $target && self->stamp / © 2009 Dani Flexer dani@daniflexer. com�
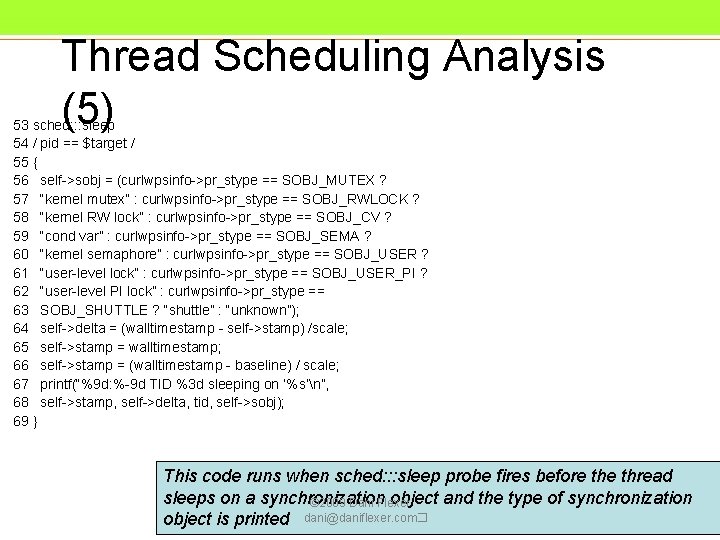
Thread Scheduling Analysis (5) 53 sched: : : sleep 54 / pid == $target / 55 { 56 self->sobj = (curlwpsinfo->pr_stype == SOBJ_MUTEX ? 57 “kernel mutex” : curlwpsinfo->pr_stype == SOBJ_RWLOCK ? 58 “kernel RW lock” : curlwpsinfo->pr_stype == SOBJ_CV ? 59 “cond var” : curlwpsinfo->pr_stype == SOBJ_SEMA ? 60 “kernel semaphore” : curlwpsinfo->pr_stype == SOBJ_USER ? 61 “user-level lock” : curlwpsinfo->pr_stype == SOBJ_USER_PI ? 62 “user-level PI lock” : curlwpsinfo->pr_stype == 63 SOBJ_SHUTTLE ? “shuttle” : “unknown”); 64 self->delta = (walltimestamp - self->stamp) /scale; 65 self->stamp = walltimestamp; 66 self->stamp = (walltimestamp - baseline) / scale; 67 printf(“%9 d: %-9 d TID %3 d sleeping on ‘%s’n”, 68 self->stamp, self->delta, tid, self->sobj); 69 } This code runs when sched: : : sleep probe fires before thread sleeps on a synchronization object and the type of synchronization © 2009 Dani Flexer object is printed dani@daniflexer. com�
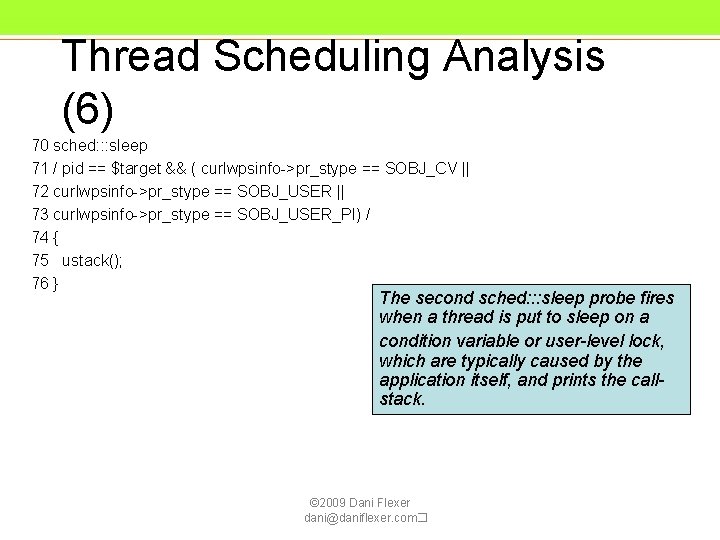
Thread Scheduling Analysis (6) 70 sched: : : sleep 71 / pid == $target && ( curlwpsinfo->pr_stype == SOBJ_CV || 72 curlwpsinfo->pr_stype == SOBJ_USER || 73 curlwpsinfo->pr_stype == SOBJ_USER_PI) / 74 { 75 ustack(); 76 } The second sched: : : sleep probe fires when a thread is put to sleep on a condition variable or user-level lock, which are typically caused by the application itself, and prints the callstack. © 2009 Dani Flexer dani@daniflexer. com�
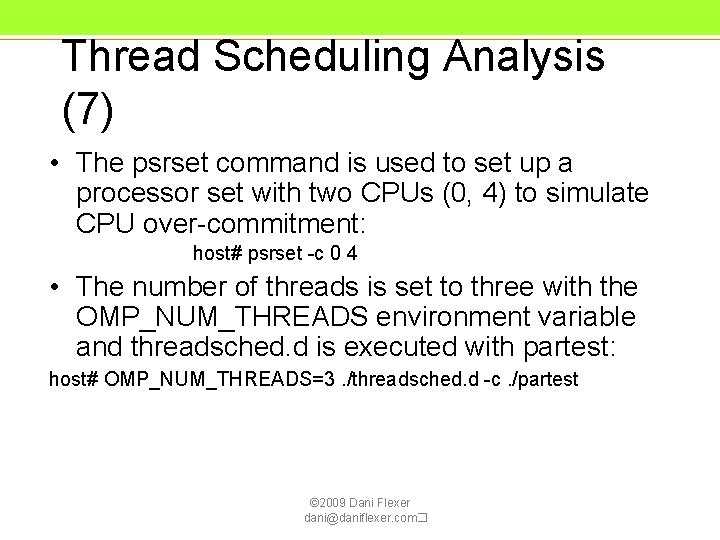
Thread Scheduling Analysis (7) • The psrset command is used to set up a processor set with two CPUs (0, 4) to simulate CPU over-commitment: host# psrset -c 0 4 • The number of threads is set to three with the OMP_NUM_THREADS environment variable and threadsched. d is executed with partest: host# OMP_NUM_THREADS=3. /threadsched. d -c. /partest © 2009 Dani Flexer dani@daniflexer. com�
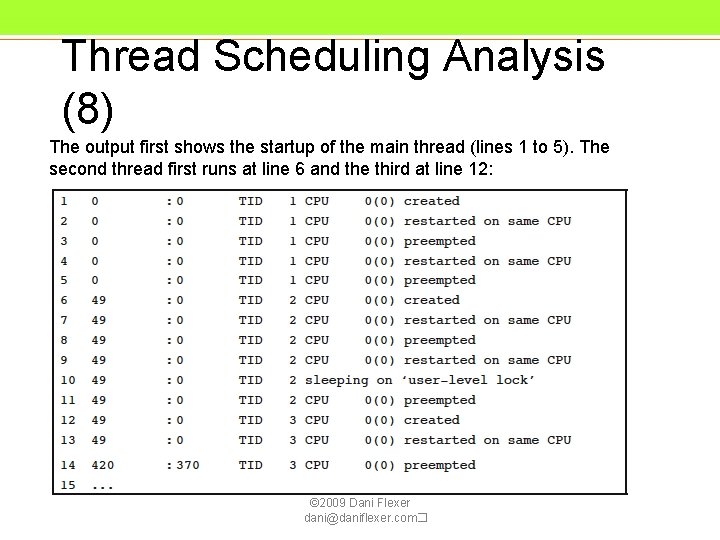
Thread Scheduling Analysis (8) The output first shows the startup of the main thread (lines 1 to 5). The second thread first runs at line 6 and the third at line 12: © 2009 Dani Flexer dani@daniflexer. com�
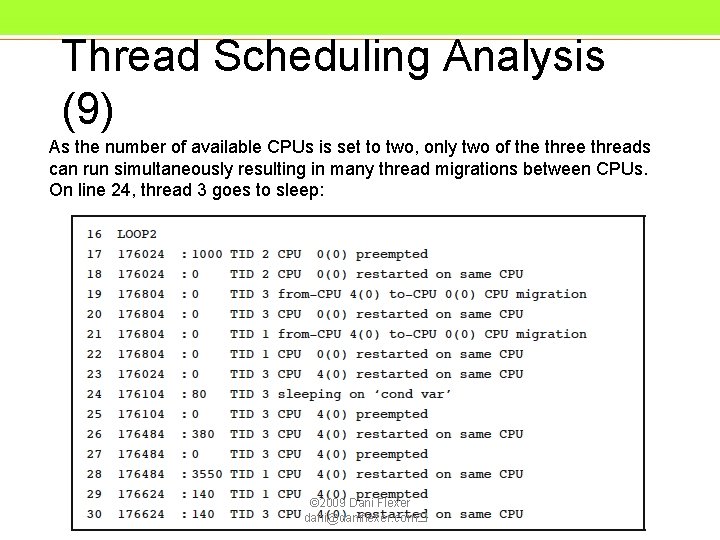
Thread Scheduling Analysis (9) As the number of available CPUs is set to two, only two of the threads can run simultaneously resulting in many thread migrations between CPUs. On line 24, thread 3 goes to sleep: © 2009 Dani Flexer dani@daniflexer. com�
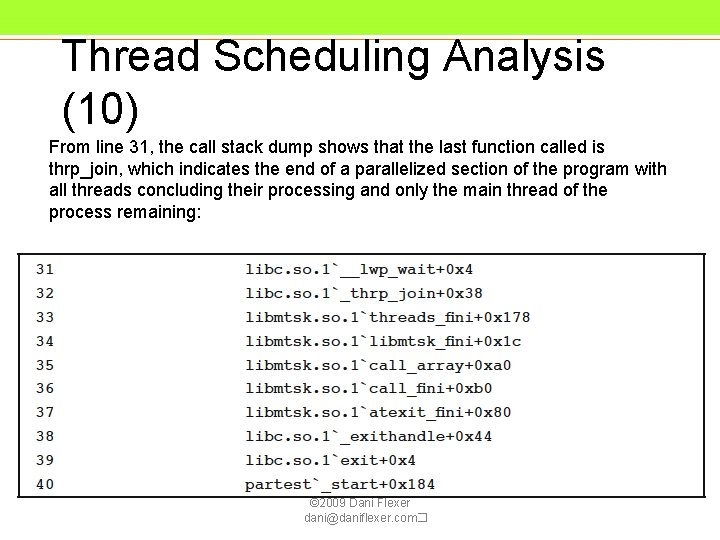
Thread Scheduling Analysis (10) From line 31, the call stack dump shows that the last function called is thrp_join, which indicates the end of a parallelized section of the program with all threads concluding their processing and only the main thread of the process remaining: © 2009 Dani Flexer dani@daniflexer. com�
I/O Performance Problems (1) • Sluggishness due to a high rate of I/O system calls is a common problem • To identify the cause it is necessary to determine: – Which system calls are called – What frequency – By which process – Why? • Good tools for initial analysis: vmstat, prstat © 2009 Dani Flexer dani@daniflexer. com�
I/O Performance Problems (2) • In this example: – A Windows 2008 server is virtualized on Open. Solaris using the Sun x. VM hypervisor for x 86 and runs fine – When the system is activated as an Active Directory domain controller, it becomes extremely sluggish © 2009 Dani Flexer dani@daniflexer. com�
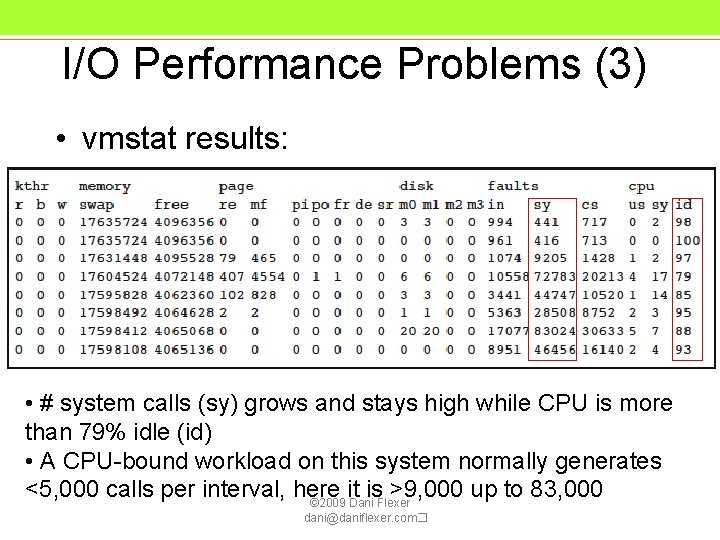
I/O Performance Problems (3) • vmstat results: • # system calls (sy) grows and stays high while CPU is more than 79% idle (id) • A CPU-bound workload on this system normally generates <5, 000 calls per interval, here it is >9, 000 up to 83, 000 © 2009 Dani Flexer dani@daniflexer. com�
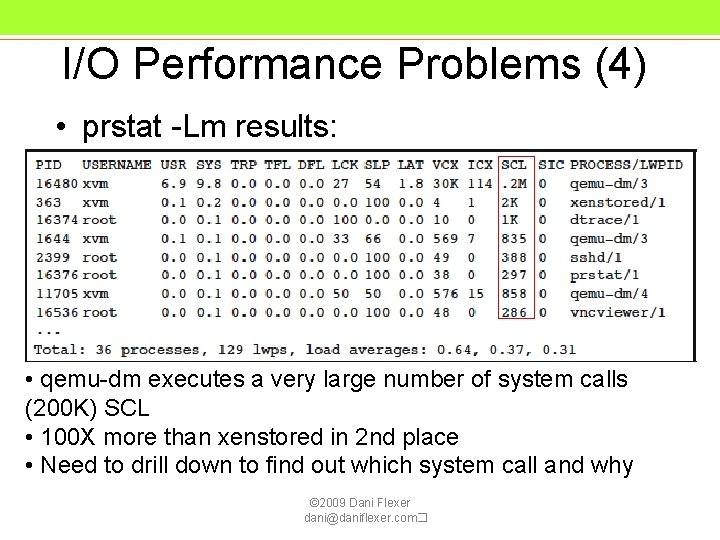
I/O Performance Problems (4) • prstat -Lm results: • qemu-dm executes a very large number of system calls (200 K) SCL • 100 X more than xenstored in 2 nd place • Need to drill down to find out which system call and why © 2009 Dani Flexer dani@daniflexer. com�
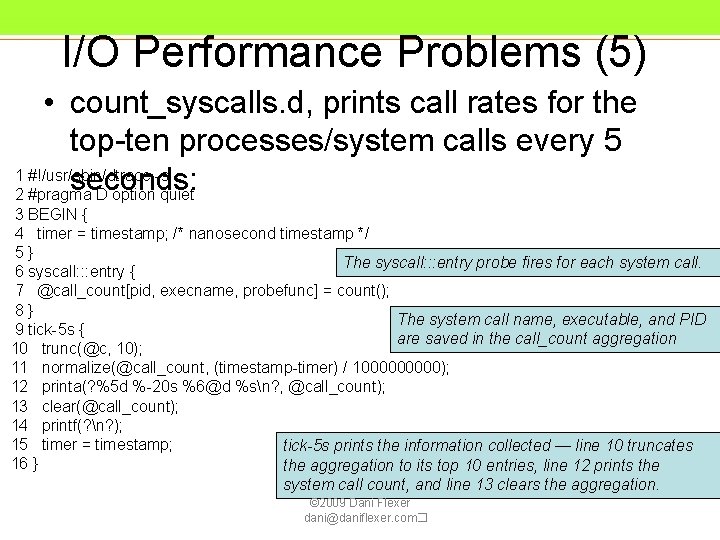
I/O Performance Problems (5) • count_syscalls. d, prints call rates for the top-ten processes/system calls every 5 1 #!/usr/sbin/dtrace -s seconds: 2 #pragma D option quiet 3 BEGIN { 4 timer = timestamp; /* nanosecond timestamp */ 5} The syscall: : : entry probe fires for each system call. 6 syscall: : : entry { 7 @call_count[pid, execname, probefunc] = count(); 8} The system call name, executable, and PID 9 tick-5 s { are saved in the call_count aggregation 10 trunc(@c, 10); 11 normalize(@call_count, (timestamp-timer) / 100000); 12 printa(? %5 d %-20 s %6@d %sn? , @call_count); 13 clear(@call_count); 14 printf(? n? ); 15 timer = timestamp; tick-5 s prints the information collected — line 10 truncates 16 } the aggregation to its top 10 entries, line 12 prints the system call count, and line 13 clears the aggregation. © 2009 Dani Flexer dani@daniflexer. com�
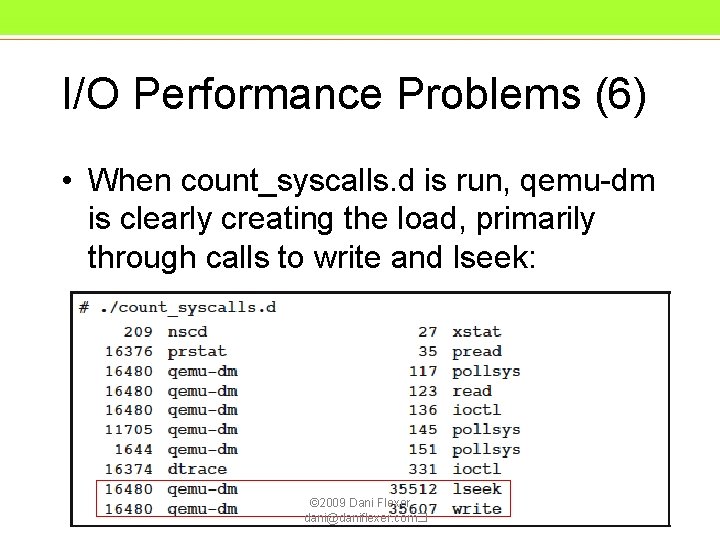
I/O Performance Problems (6) • When count_syscalls. d is run, qemu-dm is clearly creating the load, primarily through calls to write and lseek: © 2009 Dani Flexer dani@daniflexer. com�
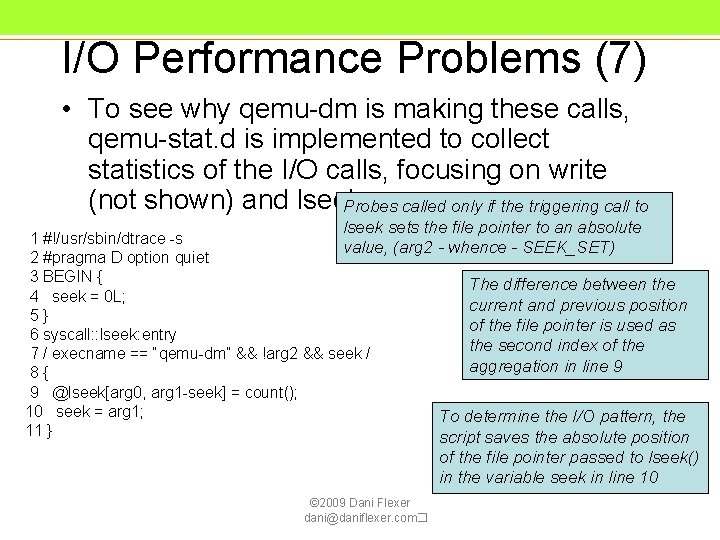
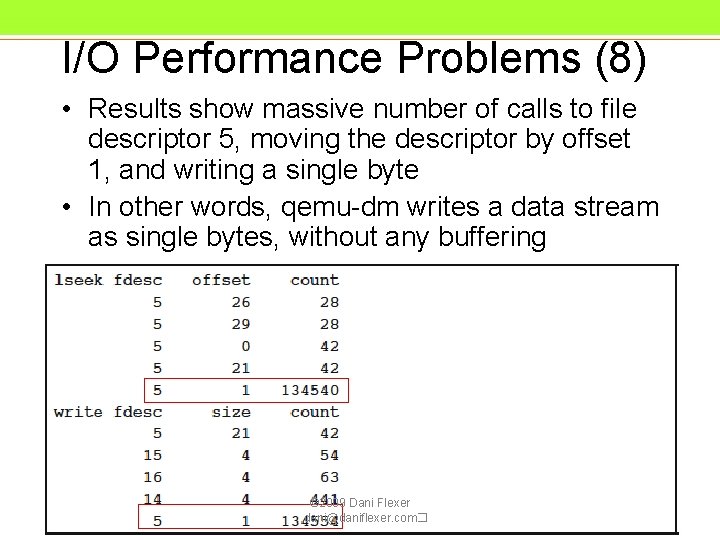
I/O Performance Problems (7) • To see why qemu-dm is making these calls, qemu-stat. d is implemented to collect statistics of the I/O calls, focusing on write (not shown) and lseek: Probes called only if the triggering call to lseek sets the file pointer to an absolute 1 #!/usr/sbin/dtrace -s value, (arg 2 - whence - SEEK_SET) 2 #pragma D option quiet 3 BEGIN { The difference between the 4 seek = 0 L; current and previous position 5} of the file pointer is used as 6 syscall: : lseek: entry the second index of the 7 / execname == “qemu-dm” && !arg 2 && seek / aggregation in line 9 8{ 9 @lseek[arg 0, arg 1 -seek] = count(); 10 seek = arg 1; To determine the I/O pattern, the 11 } script saves the absolute position of the file pointer passed to lseek() in the variable seek in line 10 © 2009 Dani Flexer dani@daniflexer. com�
I/O Performance Problems (8) • Results show massive number of calls to file descriptor 5, moving the descriptor by offset 1, and writing a single byte • In other words, qemu-dm writes a data stream as single bytes, without any buffering © 2009 Dani Flexer dani@daniflexer. com�
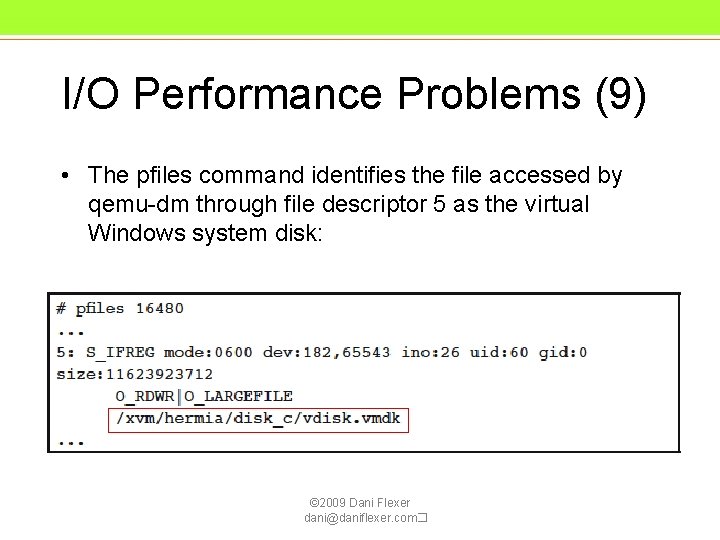
I/O Performance Problems (9) • The pfiles command identifies the file accessed by qemu-dm through file descriptor 5 as the virtual Windows system disk: © 2009 Dani Flexer dani@daniflexer. com�
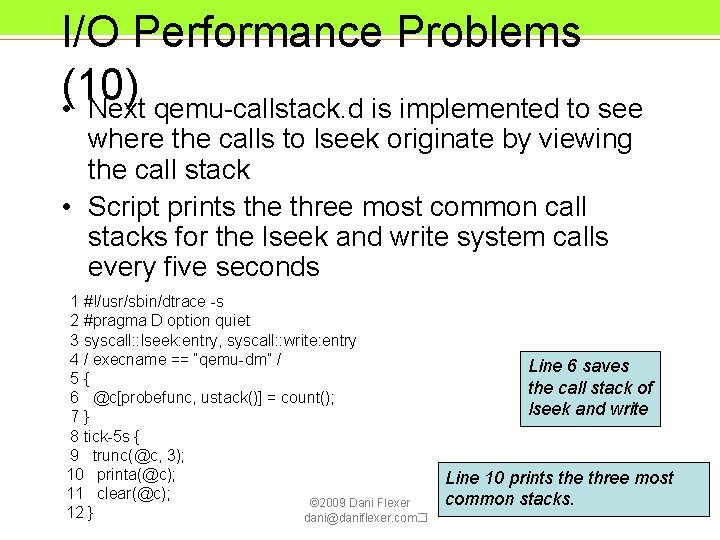
I/O Performance Problems (10) • Next qemu-callstack. d is implemented to see where the calls to lseek originate by viewing the call stack • Script prints the three most common call stacks for the lseek and write system calls every five seconds 1 #!/usr/sbin/dtrace -s 2 #pragma D option quiet 3 syscall: : lseek: entry, syscall: : write: entry 4 / execname == “qemu-dm” / 5{ 6 @c[probefunc, ustack()] = count(); 7} 8 tick-5 s { 9 trunc(@c, 3); 10 printa(@c); 11 clear(@c); © 2009 Dani Flexer 12 } dani@daniflexer. com� Line 6 saves the call stack of lseek and write Line 10 prints the three most common stacks.
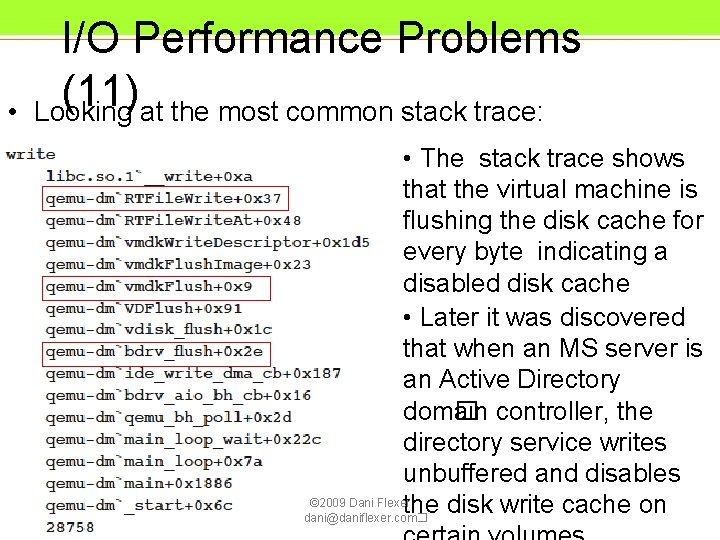
• I/O Performance Problems (11) Looking at the most common stack trace: • The stack trace shows that the virtual machine is flushing the disk cache for every byte indicating a disabled disk cache • Later it was discovered that when an MS server is an Active Directory dom� ain controller, the directory service writes unbuffered and disables © 2009 Dani Flexer the disk write cache on dani@daniflexer. com�
Other Examples in the Doc • Additional detailed examples: – Improving performance by reducing data cache misses – Improving scalability by avoiding memory stalls – Memory placement optimization with Open. MP – Using DTrace with MPI • These use a wider range of tools, including: – Sun Studio Performance Analyzer – busstat, cputrack – gnuplot © 2009 Dani Flexer dani@daniflexer. com�
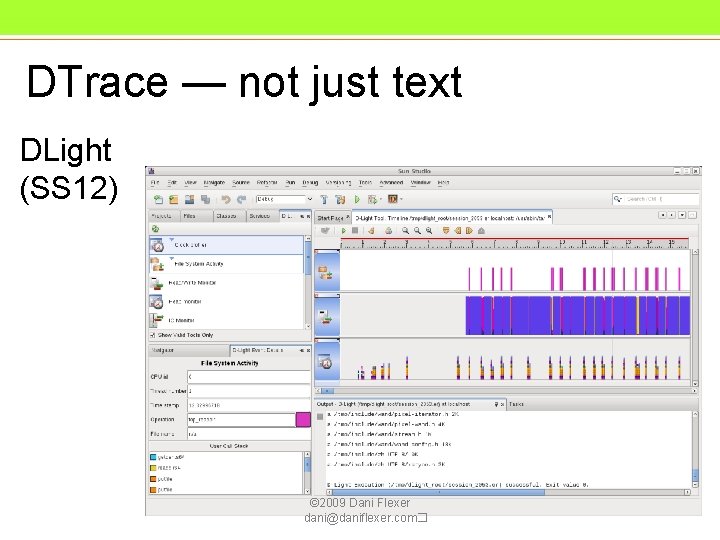
DTrace — not just text DLight (SS 12) © 2009 Dani Flexer dani@daniflexer. com�
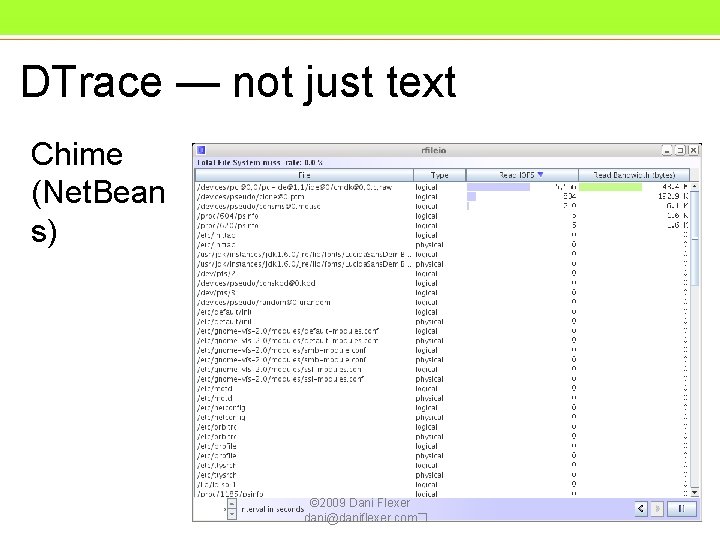
DTrace — not just text Chime (Net. Bean s) © 2009 Dani Flexer dani@daniflexer. com�
Conclusions • Computing is getting more complex – Multiple CPUs, cores, threads, virtualized operating systems, networking, and storage devices • Serious challenges to architects, administrators, developers, and users – Need high availability and reliability – Increasing pressure on datacenter infrastructure, budgets, and resources • Need to maintain systems at a high level of performance — without adding resources • Demand control through optimization is the most cost efficient way to grow DC © 2009 Dani Flexer dani@daniflexer. com�
Conclusions • To achieve these objectives, Open. Solaris has a comprehensive set of tools with DTrace at their core – Enable unprecedented levels of observability and insight into the workings of the operating system and the applications running on it – Tools allow you to quickly analyze and diagnose issues without increasing risk • Observability is a primary driver of consistent system performance and stability © 2009 Dani Flexer dani@daniflexer. com�
Thanks! • Technical content and experience provided by Thomas Nau of the Infrastructure Department, Ulm University, Germany – Except section on MPI • Paper recently published by Sun see: – http: //sun. com/solutions/hpc/resources. jsp (under White Papers) – http: //sun. com/solutions/hpc/development. jsp (under Sun Tools and Services) • Dani Flexer — dani@daniflexer. com © 2009 Dani Flexer dani@daniflexer. com�
Q&A dani@daniflexer. com © 2009 Dani Flexer dani@daniflexer. com�