Tulse Hill Low Traffic Neighbourhood Traffic Data This

Tulse Hill Low Traffic Neighbourhood Traffic Data: This document provides a summary of the pre-scheme traffic data that exists and could be used to assess what the change in traffic levels has been: 1. In 2015 and 2017 Lambeth undertook 2 weeks of automatic traffic counts across the borough. 2. The Df. T have carried out traffic counts in the area 3. Tf. L are carrying out ongoing traffic counts in the area 4. The borough commissioned analysis of telemetric data, from June 2018 - June 2019, to estimate traffic volumes on every road and to assess what proportion was locally generated/through traffic.

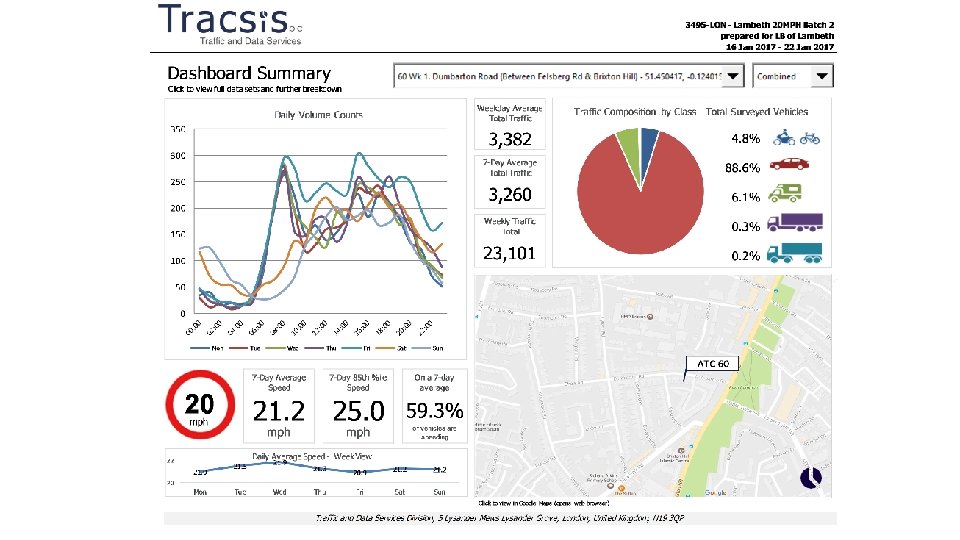
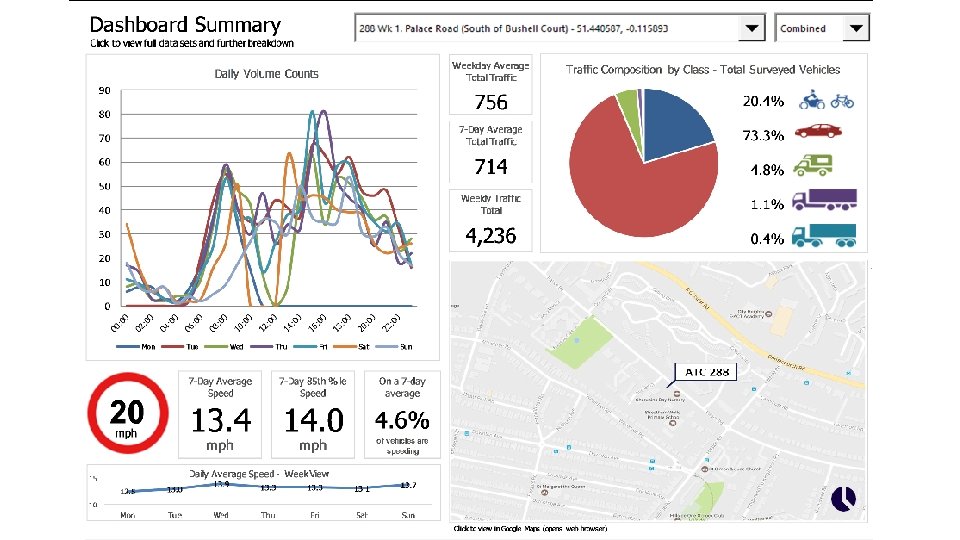
1. Location of 2015 and 2017 traffic counters Site number 60 106 129 143 144 145 161 162 164 180 255 278 288 Site name Group/ Zone Dumbarton Road Brixton Water Lane Elm Park Trelawn Road Arodene Road Athlone Road Leander Road Ostade Road Lanercost Road Tulse Hill Upper Tulse Hill Palace Road G F F F F B

1. b Headline figures from 2017 traffic counters Site No. Road Ward Direction Start Date End Date 60 60 106 129 143 144 161 162 164 255 278 288 Dumbarton Road Brixton Water Lane Elm Park Trelawn Road Arodene Road Leander Road Ostade Road Lanercost Road Upper Tulse Hill Palace Road Brixton Herne Hill Tulse Hill Coldharbour Tulse Hill Tulse Hill Streatham Hill Brixton / Tulse Hill / Thurlow Park Streatham Hill Eastbound Westbound Northbound Southbound Eastbound Westbound Northbound Southbound 16/01/2017 16/01/2017 16/01/2017 16/01/2017 16/01/2017 16/01/2017 29/01/2017 29/01/2017 29/01/2017 29/01/2017 29/01/2017 29/01/2017 Speed Limit As of 2017 20 20 20 20 20 5 Day Ave. 7 Day Ave. Total 85%ile Mean Volume Speed 1484 1898 3570 3817 1321 1508 137 255 378 595 673 661 349 252 210 2541 2264 7266 8012 370 386 26 24 26 27 18 18 26 22 26 23 23 21 19 26 22 21 25 27 27 15 13 22 21 23 23 16 16 20 20 21 19 19 20 17 20 18 19 22 23 23 14 13 1439 1821 3499 3791 1224 1455 116 267 395 578 649 623 350 229 183 2500 2045 7286 7859 348 366 26 24 28 26 18 19 23 21 26 23 23 22 19 26 22 21 23 27 28 15 13 22 21 23 23 16 16 20 20 21 19 19 20 17 20 18 19 20 23 24 14 13


2. Location of Df. T Traffic counts sites. Data available here.

Manual count points Site number: 16740 Year Count method Pedal cycles Two wheeled Cars and taxis motor vehicles Buses and coaches Light goods vehicles Heavy goods vehicles All motor vehicles 2019 Estimated using previous 669 year's AADF on this link 689 11535 754 2027 337 15343 2018 Estimated using previous 714 year's AADF on this link 653 11505 758 2028 342 15287 2017 Estimated using previous 723 year's AADF on this link 648 11515 788 1988 344 15284 2016 Estimated using previous 740 year's AADF on this link 626 11519 821 2004 352 15322 2015 Estimated using previous 715 year's AADF on this link 583 11762 776 1943 352 15416 Location of Df. T Traffic counts sites. Data available here

Manual count points Site number: 16743 Year Count method Pedal cycles Two wheeled motor vehicles Cars and taxis Buses and coaches Heavy Light goods vehicles All motor vehicles 2019 Automatic counter 258 866 20516 78 4723 672 26855 2018 Automatic counter 286 855 21256 82 4910 701 27803 2017 Manual count 299 872 22015 88 4973 744 28691 2016 Estimated using previous year's AADF on this link 324 851 20449 176 3242 651 25369 2015 Estimated using previous year's AADF on this link 314 793 20880 167 3143 638 25621 2014 Estimated using previous year's AADF on this link 310 797 20573 163 3203 643 25379 Location of Df. T Traffic counts sites. Data available here
. Site. No")
3. Location and data for Tf. L Traffic count site (Brixton Hill). Site. No DIRECN 2 298 SOUTH 298 NORTH 298 COMBINED WEEK 1 13. 01. 202019. 01. 2020 WEEK 2 27. 01. 202002. 02. 2020 27. 01. 202002. 2020 7 DAY AV HRLY VOL 7 DAY AV AM PEAK HRLY VOL 7 DAY AV PM PEAK HRLY VOL 7 DAY AV DLY VOL WEEKDAY AV DLY VOL 597 622 819 14323 14326 551 688 670 13221 13110 1148 1310 1489 27544 27436 7 DAY AV HRLY VOL 7 DAY AV AM PEAK HRLY VOL 7 DAY AV PM PEAK HRLY VOL 7 DAY AV DLY VOL WEEKDAY AV DLY VOL 580 607 777 13930 13761 539 685 644 12948 12778 1119 1292 1421 26878 26539

4. Telematric analysis- June 2018/ July 2019 The map on the left shows the volume of traffic, during the busiest period of the day, on each street The map on the right shows the proportion of traffic, during the busiest period that is through traffic (the vehicles journey did not originate or stop within the neighbourhood).
- Slides: 21