
Tubulin Monomer Mechanical Properties Obtained by Simulating Atomic
Tubulin Monomer Mechanical Properties Obtained by Simulating Atomic Force Microscopy Experiments Using Molecular Dynamics Ph. D student: Søren Enemark Supervisors: Prof. A. Redaelli Ing. S. Monica
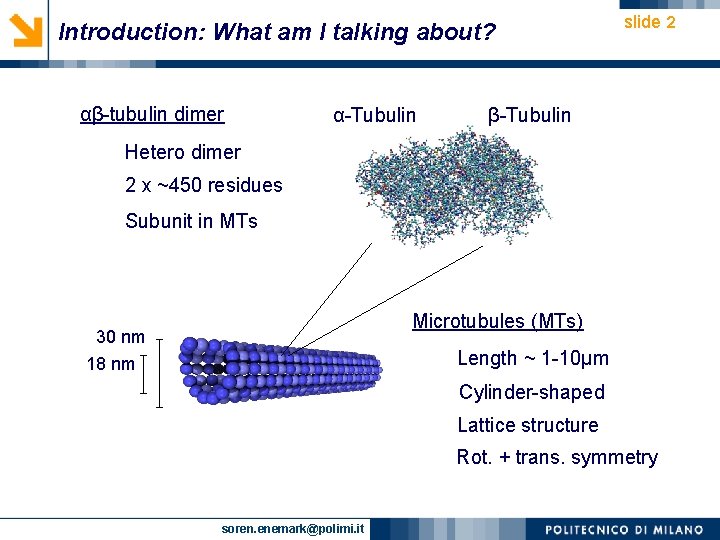
Introduction: What am I talking about? αβ-tubulin dimer α-Tubulin slide 2 β-Tubulin Hetero dimer 2 x ~450 residues Subunit in MTs Microtubules (MTs) 30 nm 18 nm Length ~ 1 -10μm Cylinder-shaped Lattice structure Rot. + trans. symmetry soren. enemark@polimi. it
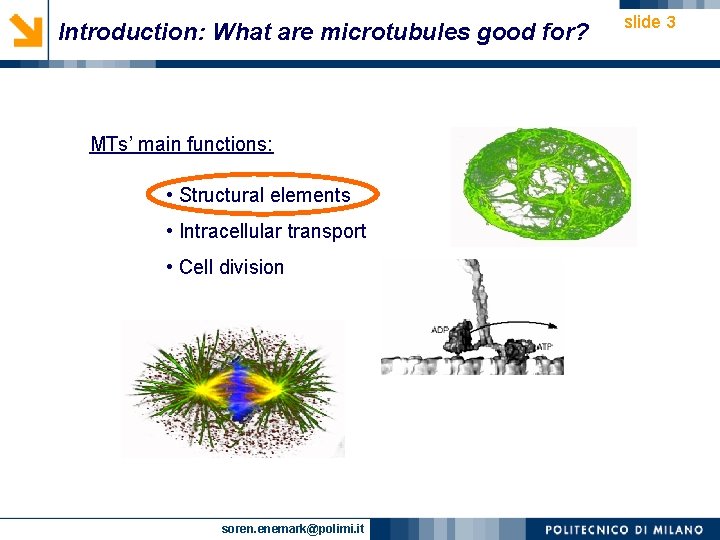
Introduction: What are microtubules good for? MTs’ main functions: • Structural elements • Intracellular transport • Cell division soren. enemark@polimi. it slide 3
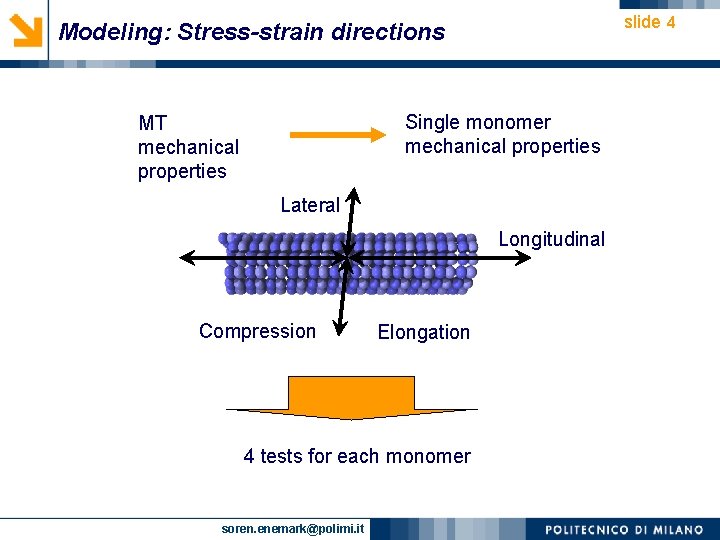
slide 4 Modeling: Stress-strain directions Single monomer mechanical properties MT mechanical properties Lateral Longitudinal Compression Elongation 4 tests for each monomer soren. enemark@polimi. it

slide 5 Modeling: Stress-strain directions (cont’d) Directions depend on the MT structure: Longitudinal interactions Along straight line Lateral interactions 13. 8° Atomic structure by K. Downing Basic structure 1 JFF. pdb Fitted to MT structure data Monomer centre-of-mass (CM) Along lines towards CM of lateral monomers soren. enemark@polimi. it End view on MT
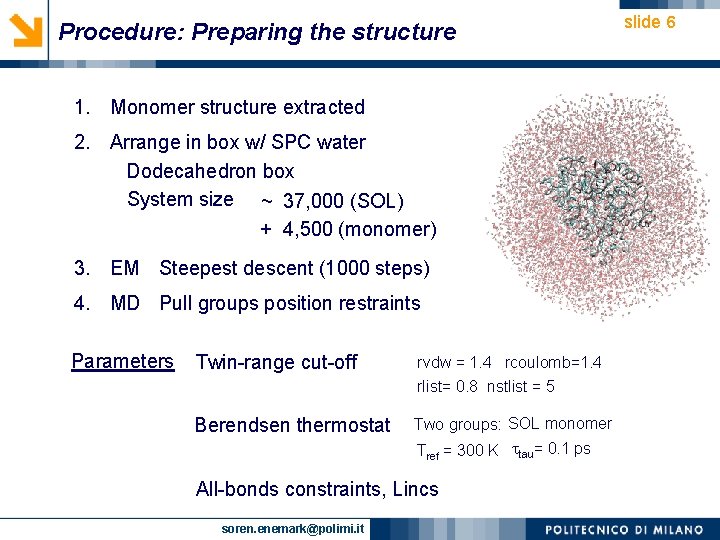
Procedure: Preparing the structure 1. Monomer structure extracted 2. Arrange in box w/ SPC water Dodecahedron box System size ~ 37, 000 (SOL) + 4, 500 (monomer) 3. EM Steepest descent (1000 steps) 4. MD Pull groups position restraints Parameters Twin-range cut-off rvdw = 1. 4 rcoulomb=1. 4 rlist= 0. 8 nstlist = 5 Berendsen thermostat Two groups: SOL monomer Tref = 300 K tau= 0. 1 ps All-bonds constraints, Lincs soren. enemark@polimi. it slide 6
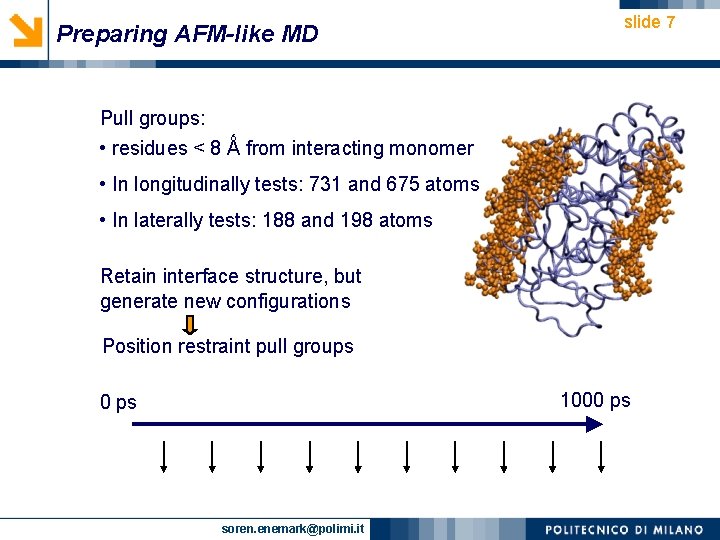
Preparing AFM-like MD slide 7 Pull groups: • residues < 8 Ǻ from interacting monomer • In longitudinally tests: 731 and 675 atoms • In laterally tests: 188 and 198 atoms Retain interface structure, but generate new configurations Position restraint pull groups 1000 ps soren. enemark@polimi. it
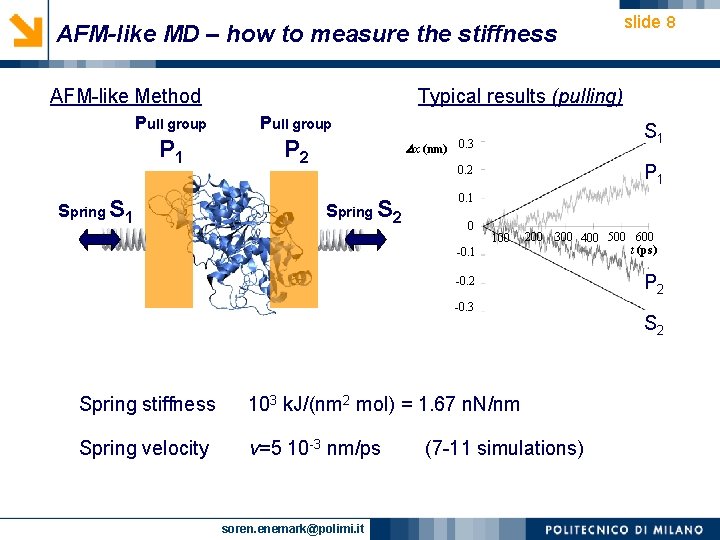
AFM-like MD – how to measure the stiffness AFM-like Method Typical results (pulling) Pull group P 1 P 2 Spring S 1 slide 8 S’ 1 S x (nm) 0. 3 P’ P 1 0. 2 Spring S 2 0. 1 0 100 -0. 1 200 300 400 500 600 t (ps) -0. 2 -0. 3 Spring stiffness 103 k. J/(nm 2 mol) = 1. 67 n. N/nm Spring velocity v=5 10 -3 nm/ps soren. enemark@polimi. it (7 -11 simulations) P P 2 S S 2
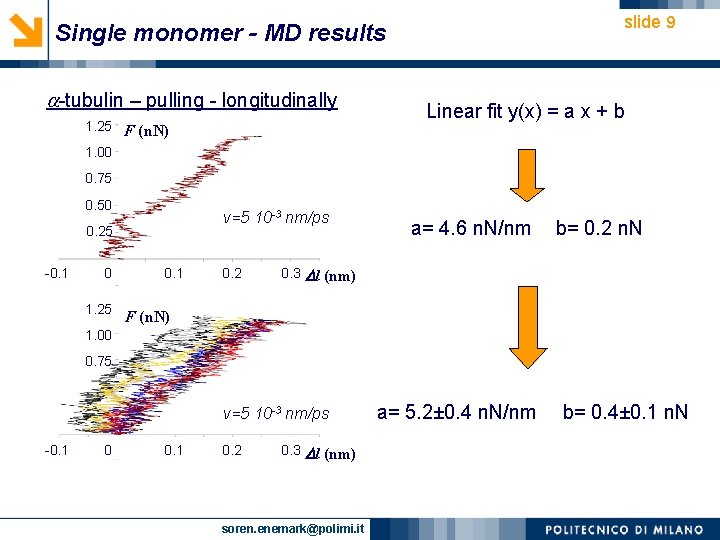
slide 9 Single monomer - MD results -tubulin – pulling - longitudinally 1. 25 F (n. N) Linear fit y(x) = a x + b 1. 00 0. 75 0. 50 v=5 10 -3 nm/ps 0. 25 -0. 1 0 1. 25 0. 1 0. 2 0. 3 a= 4. 6 n. N/nm b= 0. 2 n. N l (nm) F (n. N) 1. 00 0. 75 v=5 10 -3 nm/ps -0. 1 0. 2 0. 3 l (nm) soren. enemark@polimi. it a= 5. 2± 0. 4 n. N/nm b= 0. 4± 0. 1 n. N
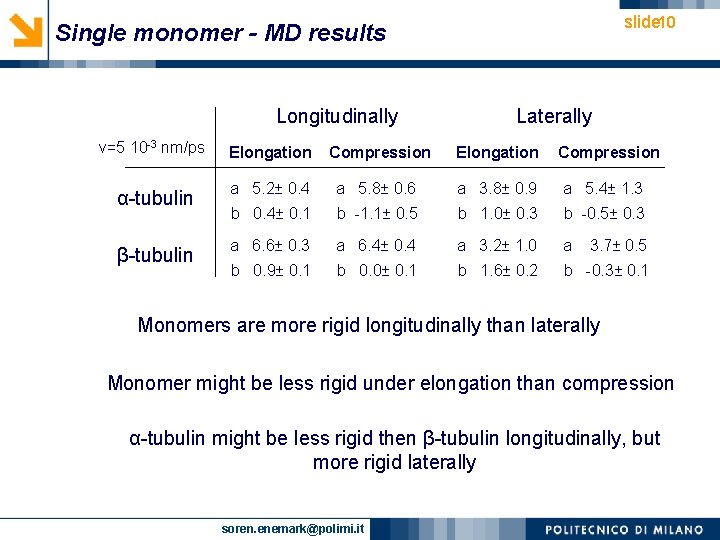
slide 10 Single monomer - MD results Longitudinally Laterally v=5 10 -3 nm/ps Elongation Compression Elongation α-tubulin a 5. 2± 0. 4 a 5. 8± 0. 6 a 3. 8± 0. 9 a 5. 4± 1. 3 b 0. 4± 0. 1 b -1. 1± 0. 5 b 1. 0± 0. 3 b -0. 5± 0. 3 β-tubulin a 6. 6± 0. 3 a 6. 4± 0. 4 a 3. 2± 1. 0 a b 0. 9± 0. 1 b 0. 0± 0. 1 b 1. 6± 0. 2 b -0. 3± 0. 1 Compression 3. 7± 0. 5 Monomers are more rigid longitudinally than laterally Monomer might be less rigid under elongation than compression α-tubulin might be less rigid then β-tubulin longitudinally, but more rigid laterally soren. enemark@polimi. it
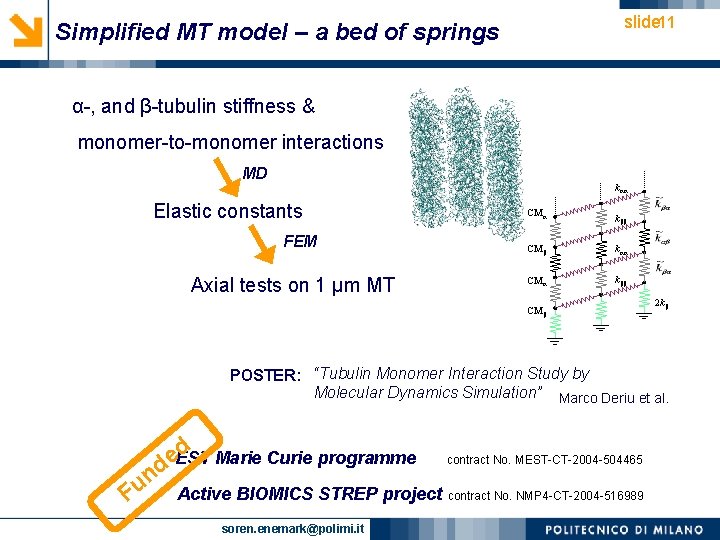
slide 11 Simplified MT model – a bed of springs α-, and β-tubulin stiffness & monomer-to-monomer interactions MD k Elastic constants FEM Axial tests on 1 μm MT CM k CM 2 k POSTER: “Tubulin Monomer Interaction Study by Molecular Dynamics Simulation” Marco Deriu et al. n u F d Marie Curie programme EST e d contract No. MEST-CT-2004 -504465 Active BIOMICS STREP project contract No. NMP 4 -CT-2004 -516989 soren. enemark@polimi. it
- Slides: 11