
ttests ANOVA Regression Andrea Banino Punit Shah Background
t-tests, ANOVA & Regression Andrea Banino & Punit Shah
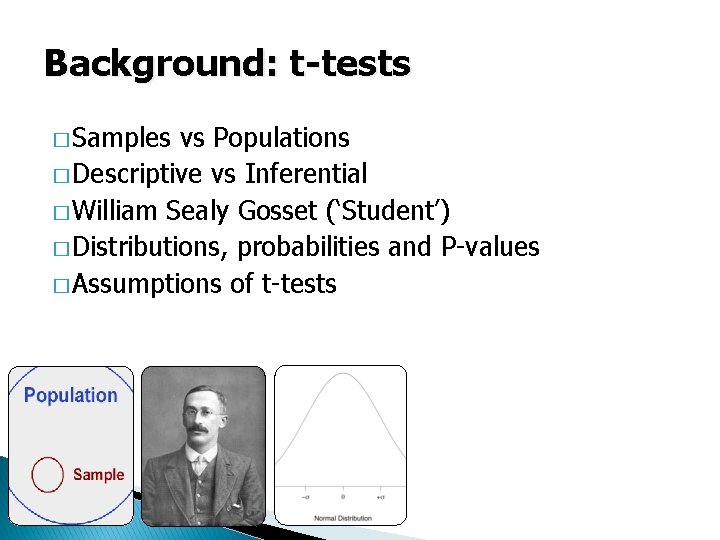
Background: t-tests � Samples vs Populations � Descriptive vs Inferential � William Sealy Gosset (‘Student’) � Distributions, probabilities and P-values � Assumptions of t-tests
P-values � P values = the probability that the observed result was obtained by chance ◦ i. e. when the null hypothesis is true � α level is set a priori (Usually. 05) � If p <. 05 level then we reject the null hypothesis and accept the experimental hypothesis ◦ 95% certain that our experimental effect is genuine � If however, p >. 05 level then we reject the experimental hypothesis and accept the null hypothesis
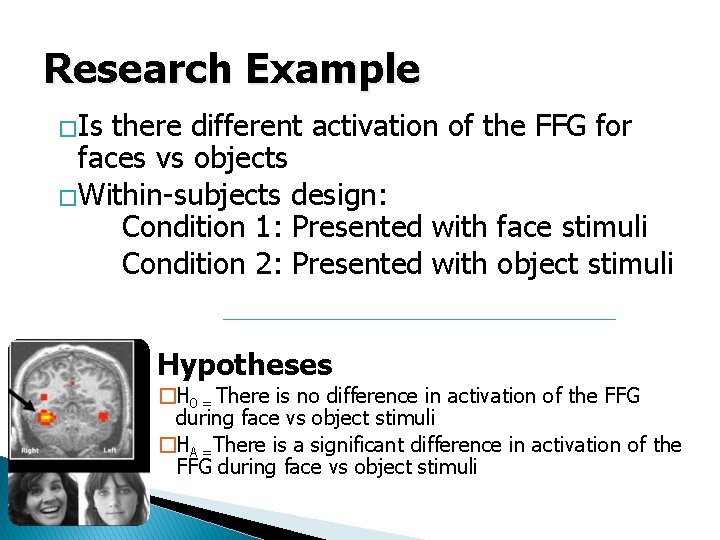
Research Example �Is there different activation of the FFG for faces vs objects �Within-subjects design: Condition 1: Presented with face stimuli Condition 2: Presented with object stimuli Hypotheses �H 0 = There is no difference in activation of the FFG during face vs object stimuli �HA =There is a significant difference in activation of the FFG during face vs object stimuli
Results- How to compare? � Mean BOLD signal change during object stimuli = +0. 001% � Mean BOLD signal change during facial stimuli = +4% � Great- there is a difference, but how do we know this was not just a fluke?
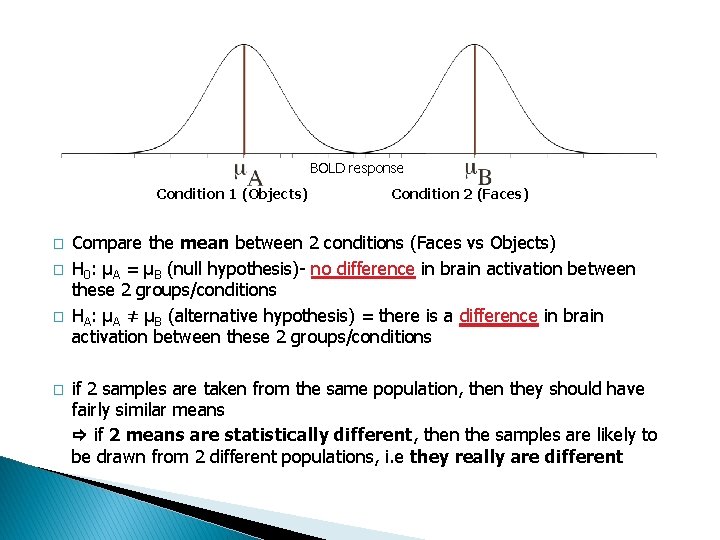
BOLD response Condition 1 (Objects) � � Condition 2 (Faces) Compare the mean between 2 conditions (Faces vs Objects) H 0: μA = μB (null hypothesis)- no difference in brain activation between these 2 groups/conditions HA: μA ≠ μB (alternative hypothesis) = there is a difference in brain activation between these 2 groups/conditions if 2 samples are taken from the same population, then they should have fairly similar means if 2 means are statistically different, then the samples are likely to be drawn from 2 different populations, i. e they really are different
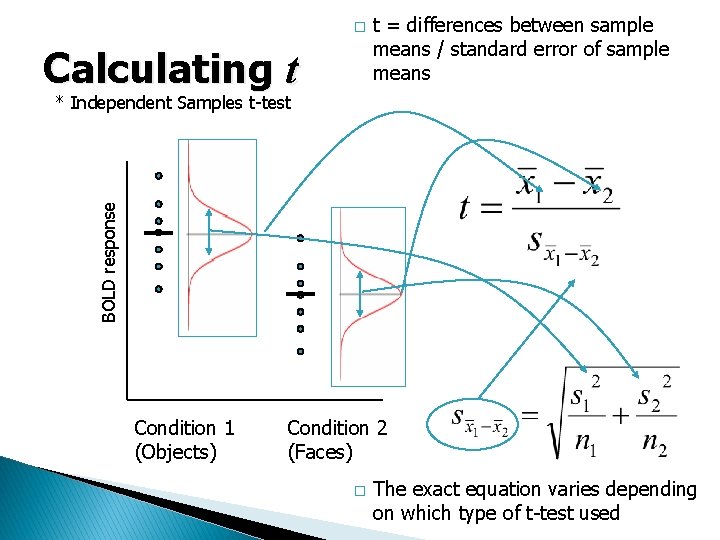
� Calculating t t = differences between sample means / standard error of sample means BOLD response * Independent Samples t-test Condition 1 (Objects) Condition 2 (Faces) � The exact equation varies depending on which type of t-test used
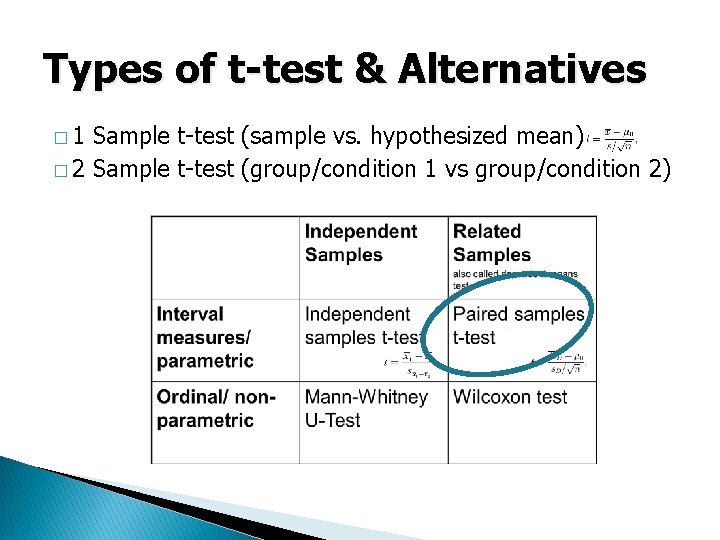
Types of t-test & Alternatives � 1 Sample t-test (sample vs. hypothesized mean) � 2 Sample t-test (group/condition 1 vs group/condition 2)
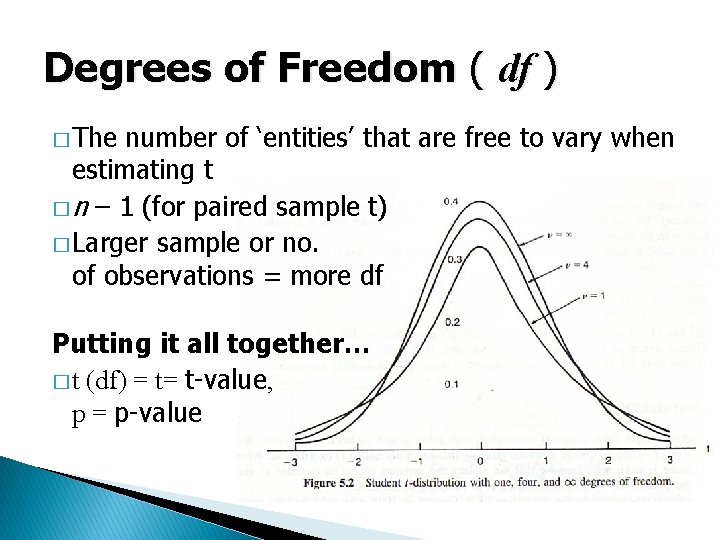
Degrees of Freedom ( df ) � The number of ‘entities’ that are free to vary when estimating t � n – 1 (for paired sample t) � Larger sample or no. of observations = more df Putting it all together… � t (df) = t= t-value, p = p-value
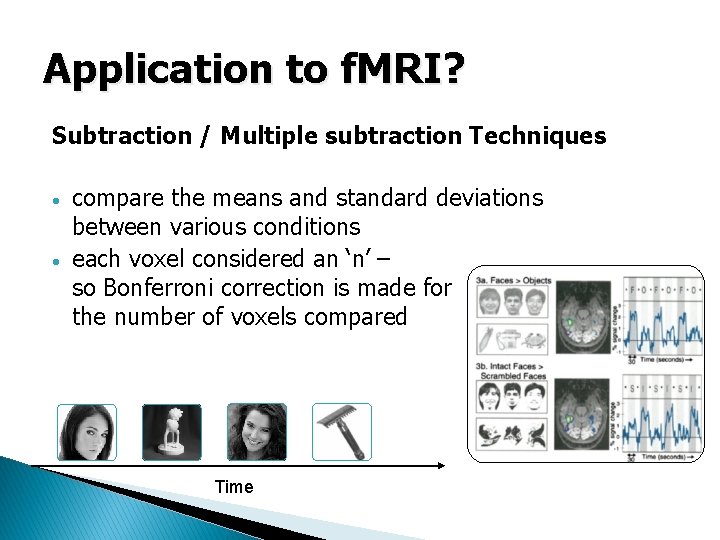
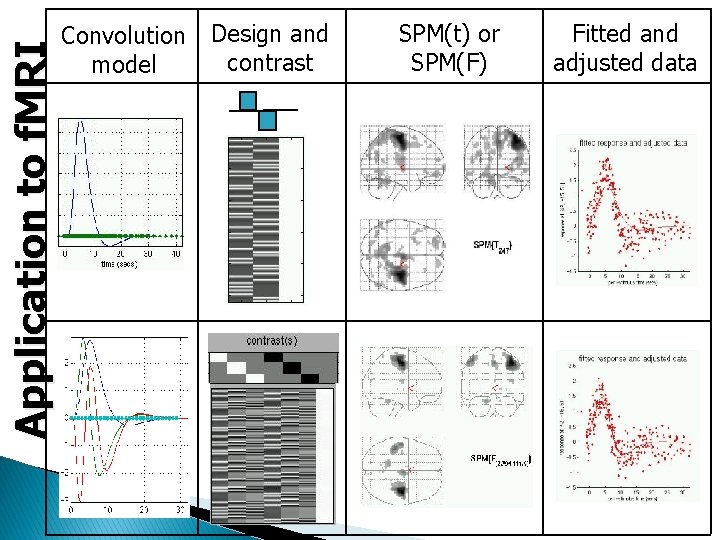
Application to f. MRI? Subtraction / Multiple subtraction Techniques • • compare the means and standard deviations between various conditions each voxel considered an ‘n’ – so Bonferroni correction is made for the number of voxels compared Time
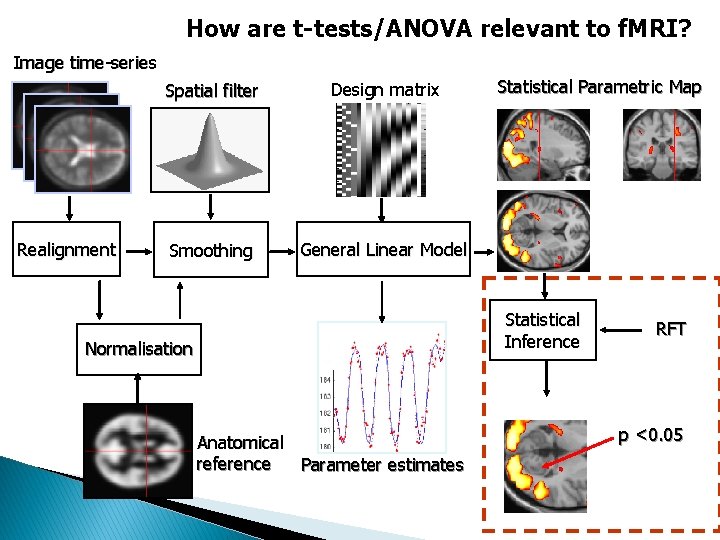
How are t-tests/ANOVA relevant to f. MRI? Image time-series Realignment Spatial filter Design matrix Smoothing General Linear Model Statistical Parametric Map Statistical Inference Normalisation Anatomical reference Parameter estimates RFT p <0. 05
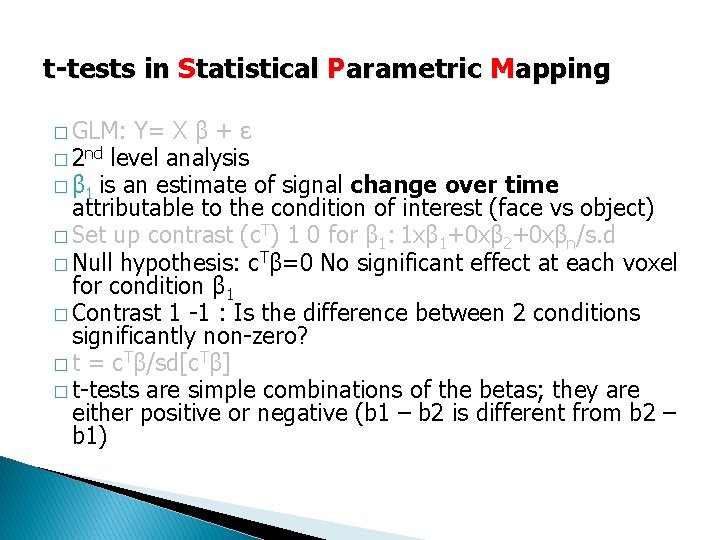
t-tests in Statistical Parametric Mapping � GLM: Y= X β + ε � 2 nd level analysis � β 1 is an estimate of signal change over time attributable to the condition of interest (face vs object) � Set up contrast (c. T) 1 0 for β 1: 1 xβ 1+0 xβ 2+0 xβn/s. d � Null hypothesis: c. Tβ=0 No significant effect at each voxel for condition β 1 � Contrast 1 -1 : Is the difference between 2 conditions significantly non-zero? � t = c. Tβ/sd[c. Tβ] � t-tests are simple combinations of the betas; they are either positive or negative (b 1 – b 2 is different from b 2 – b 1)
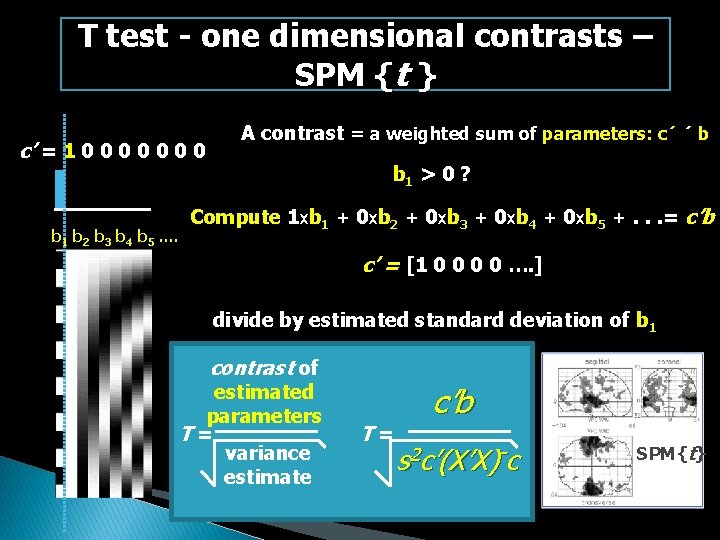
T test - one dimensional contrasts – SPM {t } c’ = 1 0 0 0 0 b 1 b 2 b 3 b 4 b 5. . A contrast = a weighted sum of parameters: c´ ´ b b 1 > 0 ? Compute 1 xb 1 + 0 xb 2 + 0 xb 3 + 0 xb 4 + 0 xb 5 +. . . = c’b c’ = [1 0 0 …. ] divide by estimated standard deviation of b 1 contrast of estimated parameters T = variance estimate T = c’b s 2 c’(X’X)-c SPM{t}
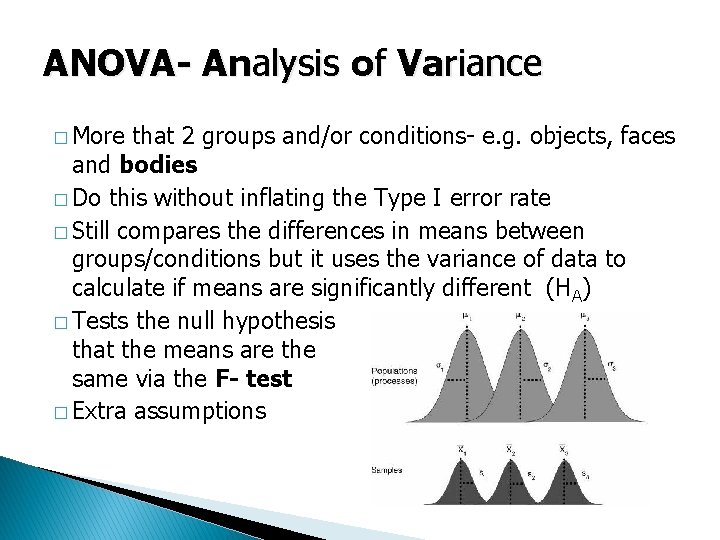
ANOVA- Analysis of Variance � More that 2 groups and/or conditions- e. g. objects, faces and bodies � Do this without inflating the Type I error rate � Still compares the differences in means between groups/conditions but it uses the variance of data to calculate if means are significantly different (HA) � Tests the null hypothesis that the means are the same via the F- test � Extra assumptions
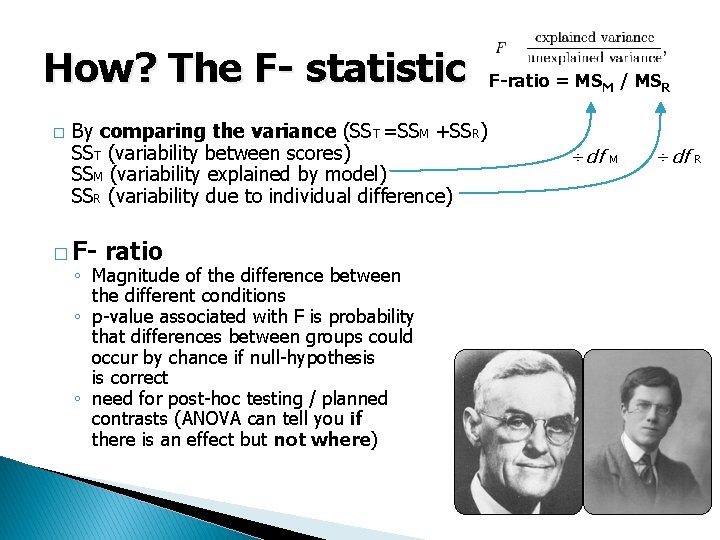
How? The F- statistic � By comparing the variance (SST =SSM +SSR) SST (variability between scores) SSM (variability explained by model) SSR (variability due to individual difference) � F- ratio ◦ Magnitude of the difference between the different conditions ◦ p-value associated with F is probability that differences between groups could occur by chance if null-hypothesis is correct ◦ need for post-hoc testing / planned contrasts (ANOVA can tell you if there is an effect but not where) F-ratio = MSM / MSR ÷df M ÷df R
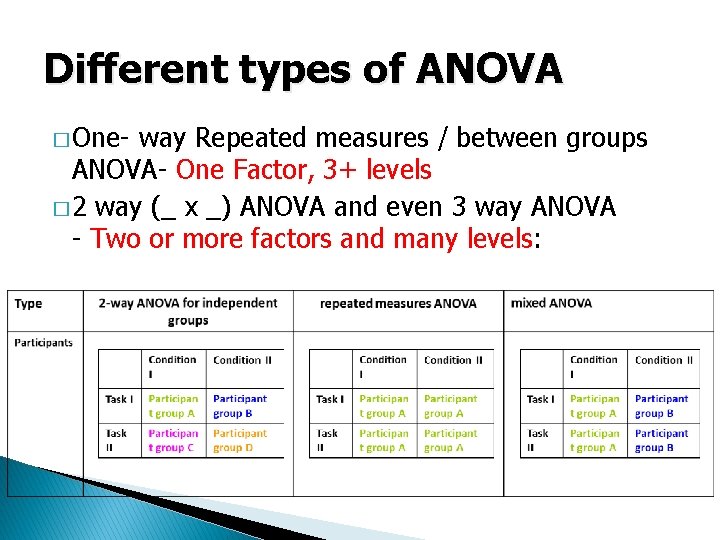
Different types of ANOVA � One- way Repeated measures / between groups ANOVA- One Factor, 3+ levels � 2 way (_ x _) ANOVA and even 3 way ANOVA - Two or more factors and many levels:
Application to f. MRI Convolution Design and contrast model SPM(t) or SPM(F) Fitted and adjusted data
PART 2 Correlation - How much linear is the relationship of two variables? (descriptive) Regression - How good is a linear model to explain my data? (inferential)
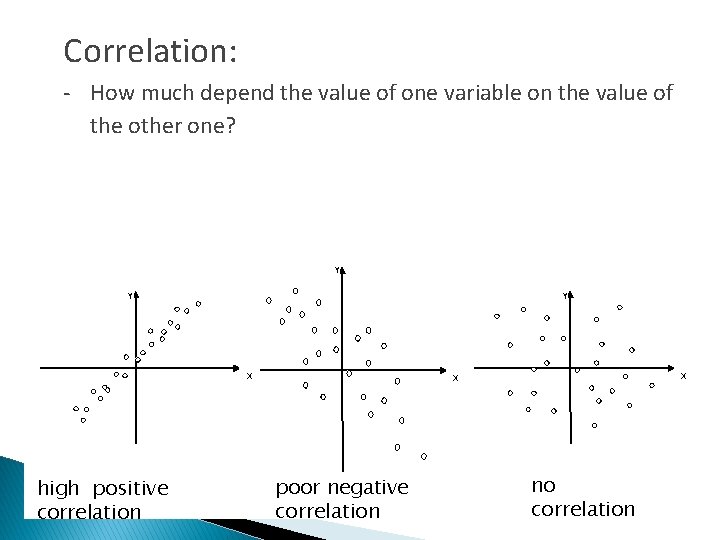
Correlation: - How much depend the value of one variable on the value of the other one? Y Y Y X high positive correlation X X poor negative correlation no correlation
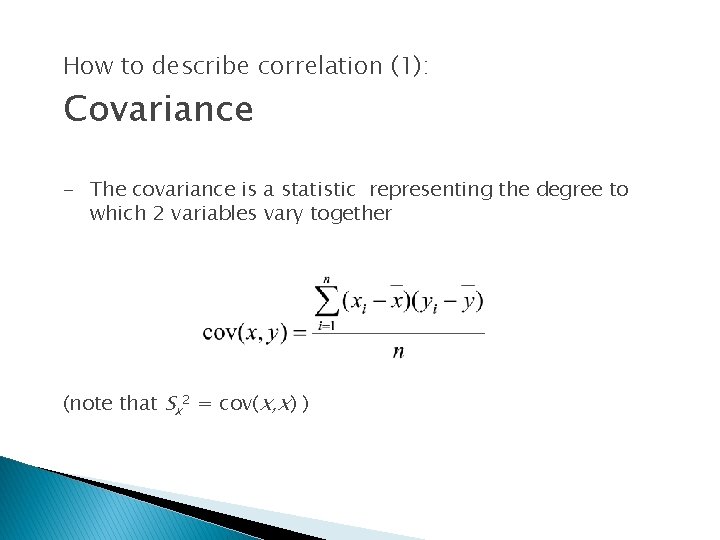
How to describe correlation (1): Covariance - The covariance is a statistic representing the degree to which 2 variables vary together (note that Sx 2 = cov(x, x) )
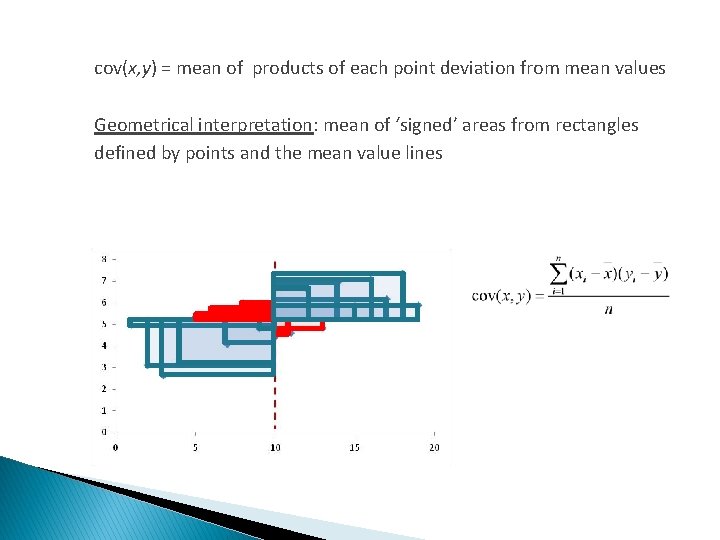
cov(x, y) = mean of products of each point deviation from mean values Geometrical interpretation: mean of ‘signed’ areas from rectangles defined by points and the mean value lines
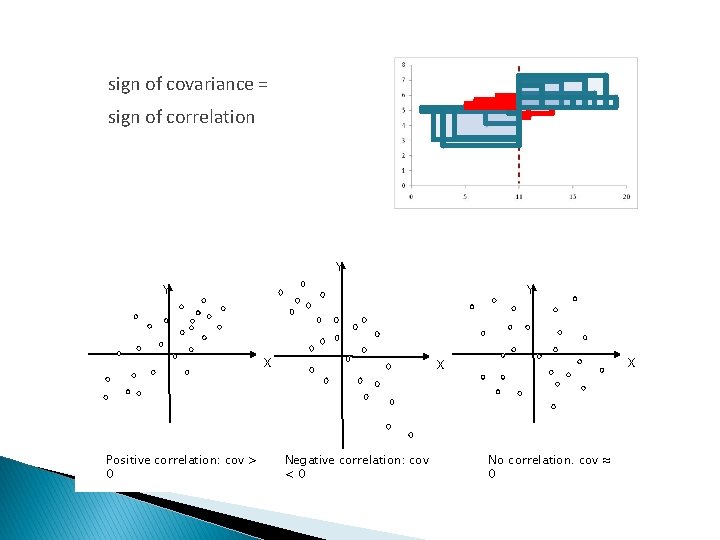
sign of covariance = sign of correlation Y Y Y X Positive correlation: cov > 0 X X Negative correlation: cov <0 No correlation. cov ≈ 0
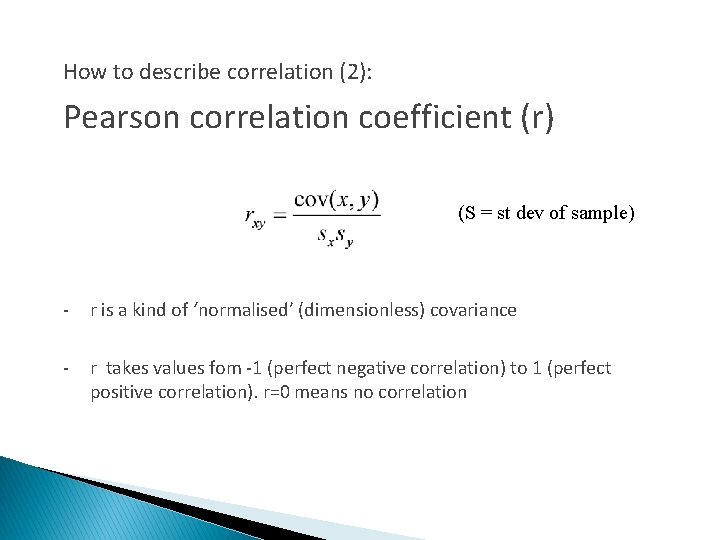
How to describe correlation (2): Pearson correlation coefficient (r) (S = st dev of sample) - r is a kind of ‘normalised’ (dimensionless) covariance - r takes values fom -1 (perfect negative correlation) to 1 (perfect positive correlation). r=0 means no correlation
Pearson correlation coefficient (r) Problems: - It is sensitive to outliers Limitations: - r is an estimate from the sample, but does it represent the population parameter?
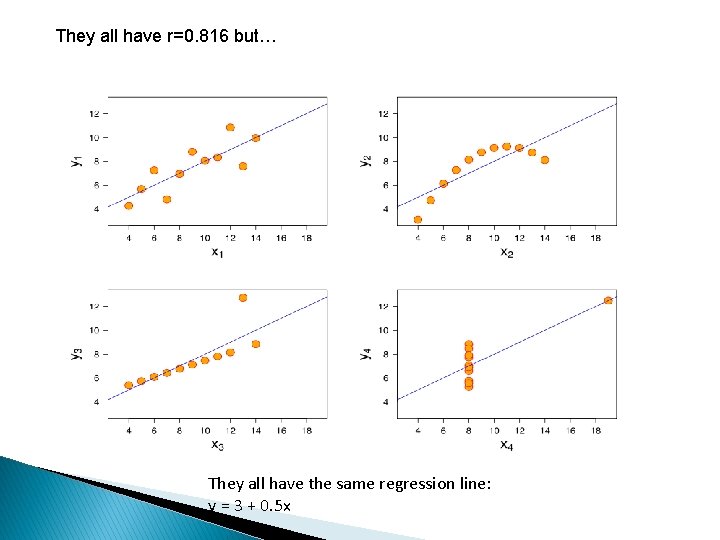
They all have r=0. 816 but… They all have the same regression line: y = 3 + 0. 5 x
But remember: • Not causality • Relationship not a prediction
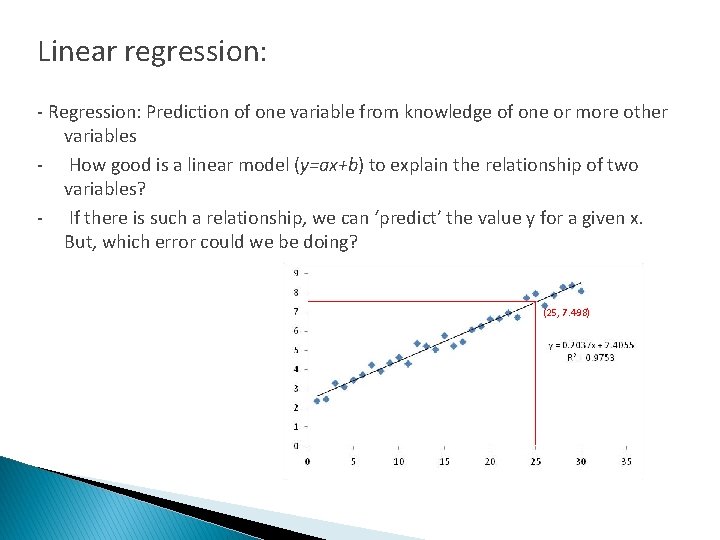
Linear regression: - Regression: Prediction of one variable from knowledge of one or more other variables - How good is a linear model (y=ax+b) to explain the relationship of two variables? - If there is such a relationship, we can ‘predict’ the value y for a given x. But, which error could we be doing? (25, 7. 498)
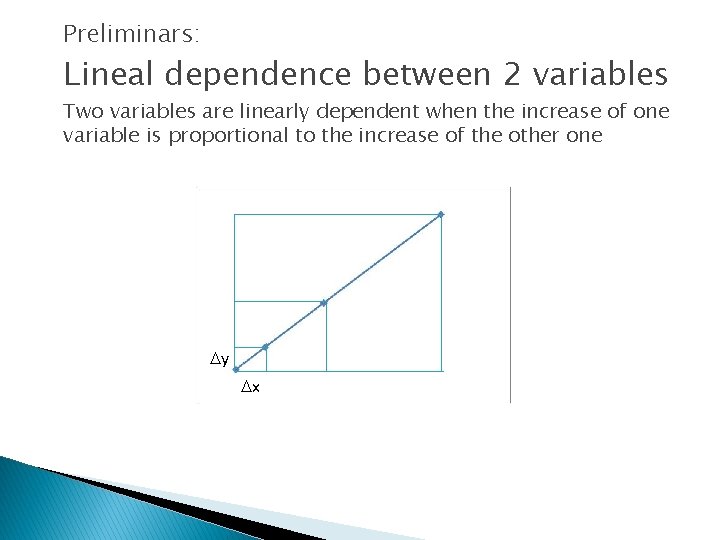
Preliminars: Lineal dependence between 2 variables Two variables are linearly dependent when the increase of one variable is proportional to the increase of the other one y x
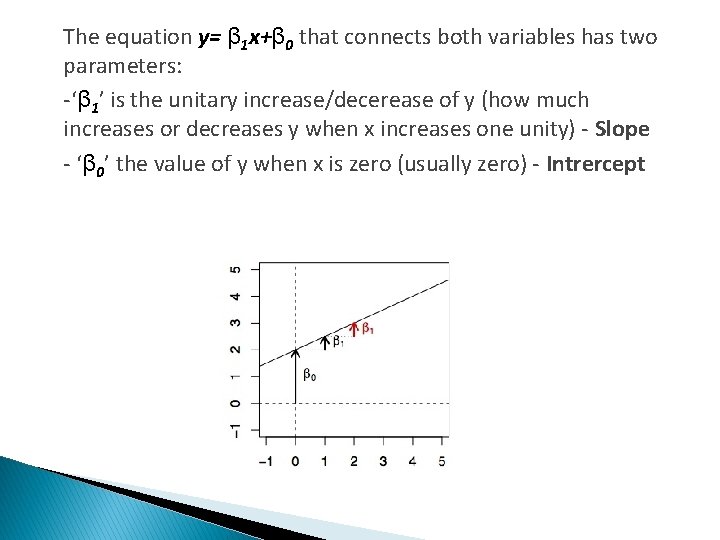
The equation y= β 1 x+β 0 that connects both variables has two parameters: -‘β 1’ is the unitary increase/decerease of y (how much increases or decreases y when x increases one unity) - Slope - ‘β 0’ the value of y when x is zero (usually zero) - Intrercept
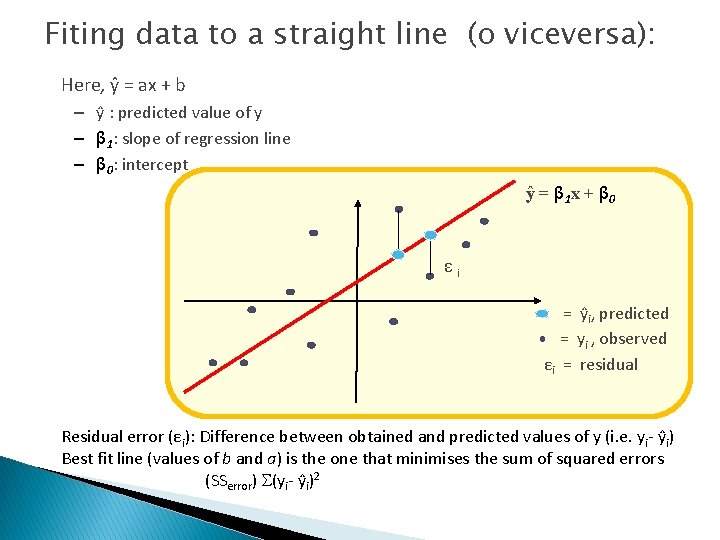
Fiting data to a straight line (o viceversa): Here, ŷ = ax + b – ŷ : predicted value of y – β 1: slope of regression line – β 0: intercept ŷ = β 1 x + β 0 εi = ŷi, predicted = yi , observed εi = residual Residual error (εi): Difference between obtained and predicted values of y (i. e. yi- ŷi) Best fit line (values of b and a) is the one that minimises the sum of squared errors (SSerror) (yi- ŷi)2
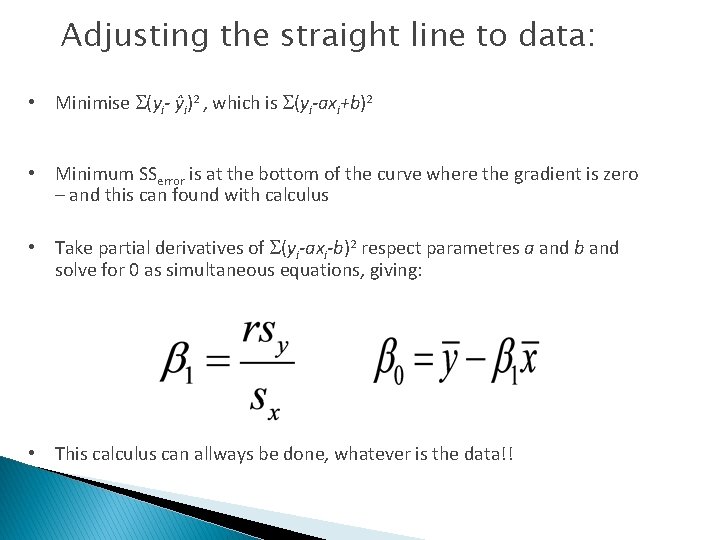
Adjusting the straight line to data: • Minimise (yi- ŷi)2 , which is (yi-axi+b)2 • Minimum SSerror is at the bottom of the curve where the gradient is zero – and this can found with calculus • Take partial derivatives of (yi-axi-b)2 respect parametres a and b and solve for 0 as simultaneous equations, giving: • This calculus can allways be done, whatever is the data!!
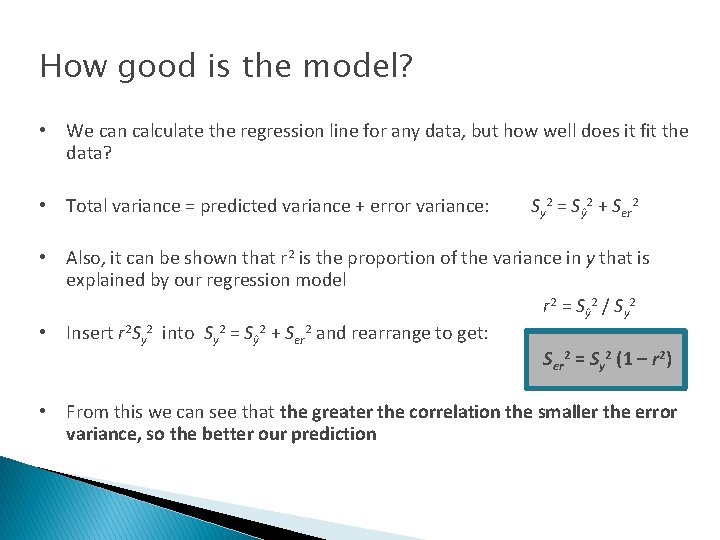
How good is the model? • We can calculate the regression line for any data, but how well does it fit the data? • Total variance = predicted variance + error variance: Sy 2 = Sŷ 2 + Ser 2 • Also, it can be shown that r 2 is the proportion of the variance in y that is explained by our regression model r 2 = Sŷ 2 / Sy 2 • Insert r 2 Sy 2 into Sy 2 = Sŷ 2 + Ser 2 and rearrange to get: Ser 2 = Sy 2 (1 – r 2) • From this we can see that the greater the correlation the smaller the error variance, so the better our prediction
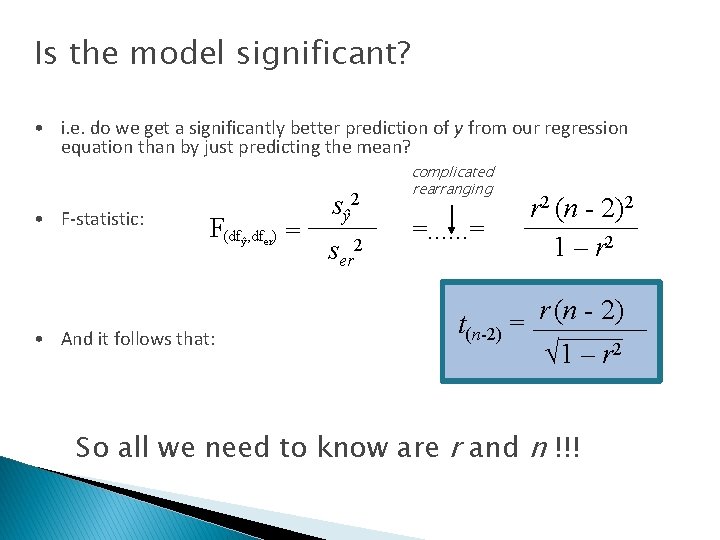
Is the model significant? • i. e. do we get a significantly better prediction of y from our regression equation than by just predicting the mean? • F-statistic: F(df , df ) = ŷ • And it follows that: er sŷ 2 ser 2 complicated rearranging =. . . = t(n-2) = r 2 (n - 2)2 1 – r 2 r (n - 2) √ 1 – r 2 So all we need to know are r and n !!!
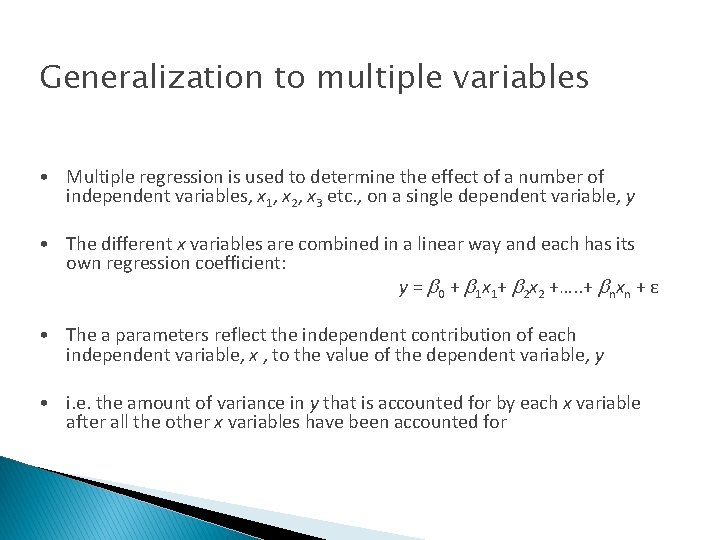
Generalization to multiple variables • Multiple regression is used to determine the effect of a number of independent variables, x 1, x 2, x 3 etc. , on a single dependent variable, y • The different x variables are combined in a linear way and each has its own regression coefficient: y = b 0 + b 1 x 1+ b 2 x 2 +…. . + bnxn + ε • The a parameters reflect the independent contribution of each independent variable, x , to the value of the dependent variable, y • i. e. the amount of variance in y that is accounted for by each x variable after all the other x variables have been accounted for
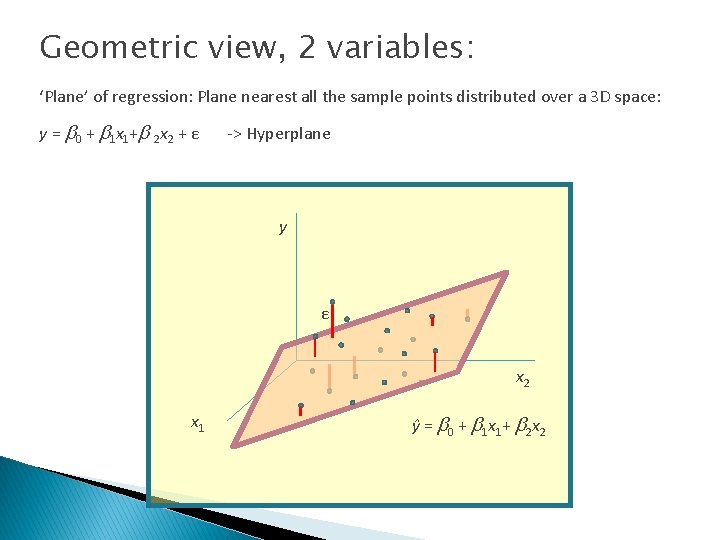
Geometric view, 2 variables: ‘Plane’ of regression: Plane nearest all the sample points distributed over a 3 D space: y = b 0 + b 1 x 1+b 2 x 2 + ε -> Hyperplane y ε x 2 x 1 ŷ = b 0 + b 1 x 1+ b 2 x 2
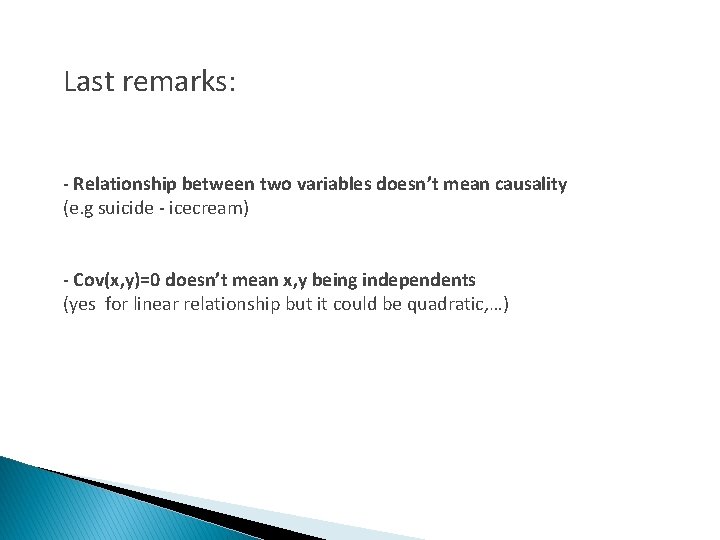
Last remarks: - Relationship between two variables doesn’t mean causality (e. g suicide - icecream) - Cov(x, y)=0 doesn’t mean x, y being independents (yes for linear relationship but it could be quadratic, …)
References � Field, A. (2009). Discovering Statistics Using SPSS (2 nd ed). London: Sage Publications Ltd. � Various Mf. D Slides 2007 -2010 � SPM Course slides � Wikipedia � � Judd, C. M. , Mc. Clelland, G. H. , Ryan, C. S. Data Analysis: A Model Comparison Approach, Second Edition. Routledge; Slide from PSYCGR 01 Statistic course - UCL (dr. Maarten Speekenbrink)
- Slides: 37