Tsunami Formation As a tsunami leaves the deep


 Describe the characteristics and explain")


 • Look")


 39 buoys are now deployed")

")


- Slides: 23
Tsunami Formation • As a tsunami leaves the deep ocean and travels toward the shallow coast, it transforms. • A tsunami moves at a speed related to the water depth, therefore the tsunami slows as the water depth decreases. • As a result, the tsunami's speed decreases as it travels into shallower water, and its height increases. • Because of this ‘shoaling effect’, a tsunami, unobvious at sea, may heighten to several meters or more near the coast. • When it reaches the coast, it may appear as a rapidly rising or falling tide or a series of breaking waves. Think. Quest Team 01724 (Oct 04 – May 05)
As they approach shallower water they slow down but the height of tsunami waves increase- this is called a ‘shoaling effect’
Tsunami Formation • As a tsunami reaches the shore, it begins to lose energy whereby part of its wave energy is reflected offshore, while the shoreward-propagating wave energy is dissipated through friction and turbulence. • In spite of this, tsunamis still reach the coast with tremendous amounts of energy Think. Quest Team 01724 (Oct 04 – May 05)
H/W : Example Question • June 2013 • 02) Describe the characteristics and explain the causes of tsunamis. ( 8 marks) • Level 1: • Simple statements of characteristics/causes, lacking detail or sophistication of either features or processes. • Level 2: • Both elements must be present, detailed statements of characteristics and/or explanation, possibly with some use of supportive material. The answer progresses through the level as more is added at this level. Full mark answers show breadth of knowledge. Think. Quest Team 01724 (Oct 04 – May 05)
Tsunami Time Travel Maps These give a better understanding of how an event may occur and the potential RISKS for people living within a tsunami’s reach • See P. 12 Hodder fig 1. 16 • A tsunami travel time map centred on an event in Hawaii.
Japan, March 11 2011: Tsunami time- travel map to show the speed at which the wave spreads across the Pacific Ocean
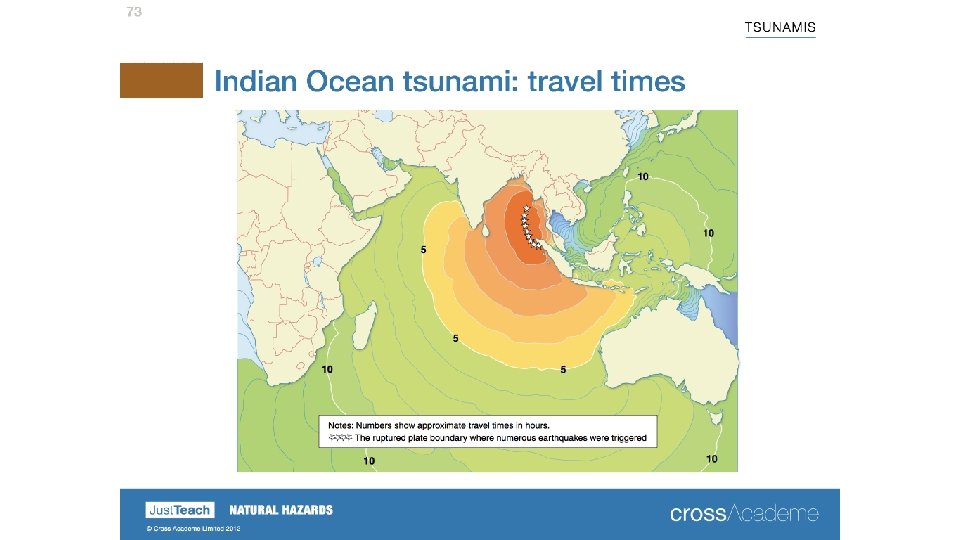
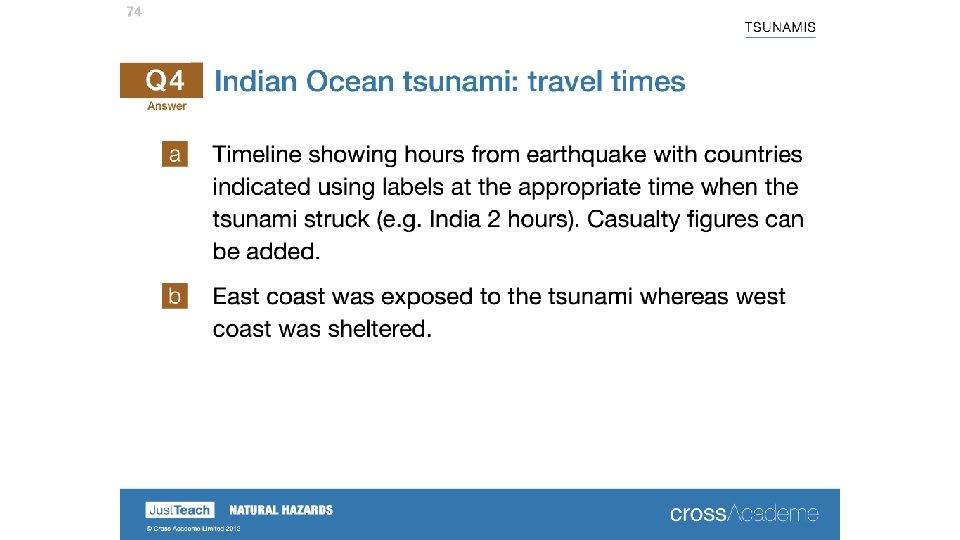
Time travel map to show the arrival times of the Indian Ocean Tsunami’s first wave, Boxing day 2004
Time travel map showing the expected travel times of a tsunami centred on the location of an 8. 6 magnitude earthquake off the coast of Indonesia Nov 11 2012
TASK • Ref Oxford (Geography for Edexcel A level Year 1 book) • Look at fig 6 p 22 • Answer question 2 ONLY on p. 23 • (you will need a pair of compasses) • EXTENSION Q • How useful do you think tsunami time travel maps • are with regard to minimising the risk for people • living within a tsunami’s reach?
WHITEBOARD THINKING … What do you think can be done to PREPARE, WARN OR REDUCE THE IMPACTS OF A TSUNAMI? ?
Tsunami warning sign
Warning Signs- Tsunami • Quite often, the first warning given to local coastal populations is the wave trough in front of the tsunami which results in a reduction in sea level known as the ‘drawdown/drawback’( ie the sea seems to have been ‘sucked backwards away from the shore) If you are ever on holiday and notice the sea behaving in this way- RUN TO HIGH GROUND!! Think. Quest Team 01724 (Oct 04 – May 05)
Warning sign on sea wall at kamakura, Japan
Sea wall defence at Tsu, Japan. These were overtopped in the recent tsunami.
What has happened since 2004? (Management strategies. . ) 39 buoys are now deployed worldwide with nearly two dozen in the north Pacific. It is costly and difficult to establish and maintain an observational network in deep water. NOAA DART® real-time tsunami monitoring systems
What has happened since 2004? 2005 - Indian Ocean Tsunami Warning and Mitigation System (IOTWS) Although the expected frequency of this magnitude event in the Indian Ocean is 1 in 600 years, the scale of disaster meant immediate action. IOTWS is very advanced– it has taken advantage of leapfrogging technology. It uses earthquake information, tide gauges and tsunami detection buoys. Driven by USA but taken up by Australia, Chile, Indonesia and Thailand. blog. petaflop. de
The DART Pacific Ocean tsunami warning system. (Deep-ocean Assessment and Reporting of Tsunamis)
Timeline post 2004 We cannot forecast a tsunami event, but once generated, we can model its arrival and impact NOAA
It’s not just technology that is needed if future tsunamis are to be less devastating… Communications systems and integration 26 national tsunami centres in Indian Ocean 25 new seismographic centres sending data 3 deep ocean sensors Warnings Warned area: prepare for imminent flooding within 2 hours Watch area: For earthquakes over 7. 0+ stay alert for I hour For earthquakes over 7. 5+ stay alert for 3 hours Geohaz. org Hazard mapping and modelling Local preparedness Development of resilient communities. http: //www. discovertsunamis. org/
An accurate final death toll may never be known but is estimated to be around 20, 000. Prayer signpost
� Watch excellent Ian Stewart programme on the Japanese earthquake and tsunami � (shared area. . )