TSS Project Update WRAP Ao H Meeting Seattle


 • Task 6: Perform TSS requirements analysis")
 • Task 9: Develop data exchange protocols")


 • Items in red are/will be directly supported by")


 • Metadata Browser provides site information/maps to support:")
 • Composition Tool supports: – IWG: sec. 2.")


")


")
")
: A lightweight, embeddable component")


- Slides: 34
TSS Project Update WRAP Ao. H Meeting Seattle, WA April 26, 2006
Outline • TSS task and budget update • Crosswalk of TSS tools and SIP requirements • TSS documentation • Metadata • “Template Tool” overview • GIS topics • TSS version control
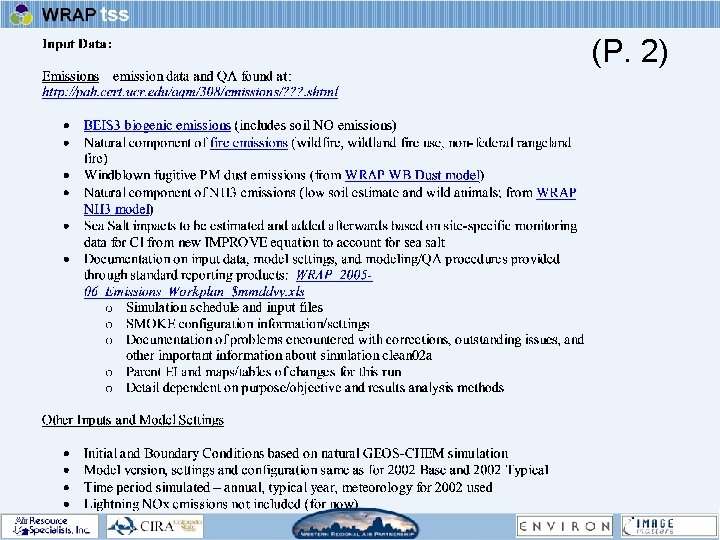
Work Plan Tasks – TSS Project (1) • Task 6: Perform TSS requirements analysis and scoping study. Completed; serves as basis for ongoing development. • Task 7 a: Acquire and prepare the relevant databases. New IMPROVE equation implemented in TSS. Site-specific model results in TSS (version a). Emissions layers currently being uploaded to GIS tools (version b). • Task 8: Develop data review interfaces based on user requirements. Ongoing – data tools include “dynamic” and “static” tools. Significant work expected on this task 1/06 – 10/06
Work Plan Tasks – TSS Project (2) • Task 9: Develop data exchange protocols and guidelines. Will likely be scoped during this phase of work but not implemented until after 10/06. • Task 10: Develop method to capture on-line user feedback. Web site feedback mechanism in place; will require some enhancement. • Task 11: Travel. Ongoing as required. • Task 12: Additional project support. New task designed to cover: - Tracking WRAP work projects for inclusion in the TSS - Project management responsibilities - Additional travel
Ao. H Phase 2/TSS Budget Update
Regional Technical Work for Haze Planning • Technical analyses & displays are to support December 2007 haze plans that show “reasonable progress on emissions reductions” toward visibility improvement goals for each Class I area • Technical Support System characteristics: – Transparent results for key technical data – Addresses RHR-required elements of haze plans requiring regional technical support – “Agnostic” with respect to any particular haze plan
TSS Tools and SIP Requirements • TSS tools designed to: – Produce specific products required in SIPs – Provide for independent investigation of TSS data sets and support an overall understanding of visibility issues, while not necessarily fitting into the SIP outline • Review of product requirements: – IWG SIP outline (Fall 2005) – Tom Moore (TM) Technical Support System Background Document (March 2006)
IWG SIP Outline (Fall 2005) • Items in red are/will be directly supported by the TSS • The IWG SIP Outline has been modified since Fall 2005, but these products are still required • IWG will have opportunity to comment at April 27 training
TSS Background Doc – Tom Moore
Regional Analysis Results • Regional overview of monitoring, modeling, and emissions data supports: – IWG: not specified, sec. 4. x – TM: bullets 5 and 8 • Regional overview of attribution results supports: – IWG: sec. 2. 3. 1 and 2. 3. 2 – TM: bullets 16 and 17 • Regional WOE analyses will support regional understanding of how emissions changes affect visibility changes
Class I Area Analysis Tools (1) • Metadata Browser provides site information/maps to support: – IWG: sec. 1. 2 – TM: not specified • Analysis Browser (regional and Class I area “static”) supports: – IWG: sec. 2. 6. 1 – TM: bullets 11, 12, 14, 15, 16, 17 – Also allows for review of model performance • Data Query Wizard supports: – User direct download of data types • Trends Tool supports: – IWG: sec. 2. 6. 1 (WOE analysis; e. g. , sulfate/nitrate trends) – TM: bullet 15
Class I Area Analysis Tools (2) • Composition Tool supports: – IWG: sec. 2. 2. 1, 2. 2. 2, 4. x (2. 4 – emissions by pollutant? ) – TM: bullets 1, 2, 3, 4 • Data Browser supports: – IWG: sec. 2. 2. 3, 4. x – TM: bullets 11, 12, 14, 15 • Offsite Resources support: – Additional contextual information, particularly in terms of GIS layers – Will be used in general understanding of visibility and emissions either regionally or locally
TSS Documentation • Roughly level of detail offered in the Ao. H Phase I project – links to more detailed information • IMPROVE monitoring – – – Network description Important species and why Old and new extinction equations Discussion of tracers Discussion of known uncertainties/problems • Emission inventory preparation – Method of preparing inventories by pollutant and source category – Specification sheets for each version housed on the TSS • Modeling work – Overview of modeling techniques – Concise, practical discussion of overall model performance – Specification sheets for each version housed on the TSS (see example) • Other analyses – Attribution or assessments (PSAT, PMF, other) – Weight of evidence tutorial
Location of TSS Documentation • Documentation of data and analyses types will be place in the Methods section, accessible from the lefthand navigation pane in the TSS • This documentation will be accessible through hyperlinks elsewhere on the TSS – Wherever users can download data (e. g. , Query Wizard, other tools) – As links from Metadata files
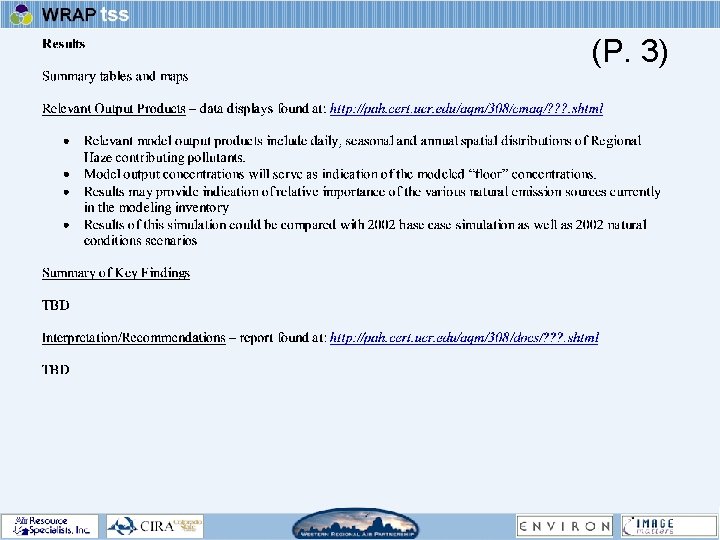
Sample Model Spec. Sheet (P. 1)
TSS Metadata Following established metadata standards allows us to: • • • Preserve organizational data investments Instill data accountability and liability Facilitate data sharing Make our datasets discoverable through national infrastructure Prepare for post-October data download and upload functionality Start with suggested “minimum” set of core elements, and add those that are necessary to maintain value of dataset and serve state/tribal users.
TSS Metadata Outline Proposed minimum set of elements (from Content Standard for Digital Geospatial Metadata): • <origin> Data Originator [author] • <pubdate> Date of Publication • <title> Title • <abstract> Abstract • <purpose> Purpose • <timeperd> Time period for data content [single date or date range] • <current> Currentness reference (e. g. , ground condition) • <progress> whether data product is preliminary or complete • <update> maintenance and update (e. g. , “no update planned”) • <bounding> bounding box coordinates in long/lat • <themekt> theme keyword thesaurus used (e. g. , ISO 19115 Topic Category) • <themekey> keywords [usually multiple] • <accconst> presence/absence of access constraint • <useconst> use constraint (place to put a disclaimer) • <metd> date that metadata was generated • [Metadata Contact information] • <addrtype> mailing and physical address • <cntorg> Organization • <city> city • <state> state • <postal> ZIP code • <cntvoice> phone number • <metstdn> metadata standard used • <metstdv> version of metadata standard Proposed additions to the minimum set of metadata elements: • Multiple Online_Linkage values (URLs) for navigation to: – data viewing i. e. , IMAT client and/or Arc. IMS site – data download (when ready, and if different than viewing location) – in-depth documentation, etc. • Spatial Reference System (Projection) • Attribute Labels, and Attribute Definitions
Tools: “Static” vs. “Dynamic” Static resources: “Hard-copy”, non-interactive products that can simply be accessed, browsed, and downloaded. The user has little or no control over manipulating the base data or formatting the output – they simply take what they are given. Dynamic resources: Interactive tools that can be used to select base data, format output, and create static products. Such tools usually consist of web forms with controls and “widgets” to enable various degrees of user interaction. More flexible and powerful than static products, dynamic tools usually require substantial time and effort to develop. Our goal is to find the right balance between static and dynamic in order to get the most “bang for our buck” by 2006
“Template Tool” Concept • User selects a graphic type (dynamic charts, but not dynamic maps) • User selects data set (monitoring, modeling, emissions, etc. ) • TSS loads selected data fields into a pre-defined Excel template • Template can be “run” on the web to produce one or more graphics with selected data – process is transparent to user • Template can be downloaded as an Excel file so the user can customize graphics (scales, colors, formatting, etc. )
“Template Tool” Rationale • Many tools can be created fairly easily – more options available than relying on programming individual tools • Templates can be modified/replaced by the TSS team easily • Templates will generate user-friendly graphics in standard formats • User upload of data to the template is possible • User created templates may also be possible
Simple Template (Emissions Data)
Complex Template (Glide Slope/Emissions/Attribution)
GIS in the TSS Integrated Mapping and Analysis Tool (IMAT): A lightweight, embeddable component Can be used to construct composite web pages Can be “driven” by other components (responds to events) Can “drive” other components (raises its own events) Can be used to access arbitrary, remote GIS layers Arc/IMS website: A standalone application Cannot be used to construct composite web pages Cannot easily interact with other components Cannot easily provide access to arbitrary, remote GIS layers Our first line of defense for offering access to new spatial layers
IMAT Functionality - Existing
IMAT – Current Work aka “Cycle 1” • “Interactive Scaling” and other client-side controls (operated by users) ü collaborative task by ENVIRON and Image Matters ü provides capability to shade features (e. g. , county polygons or model output grid cells) for local-scale area based on values of a continuous variable ü allows changing colors and other symbology for layer features • Metadata Catalog ü Implement Catalog Service for the Web (CSW) ü Storage location for metadata from WRAP layers ü Provides connectivity to National Spatial Distribute Infrastructure (NSDI) distributed Clearinghouse network – allows discovery of WRAP geodata from any of the 6 Clearinghouse Gateways ü Metadata management through Cat. Man tool • Direct Access (“one-click-away”) to metadata from IMAT viewer
IMAT – Planned Work and associated functionality Iterative process with 2 - to 3 -week cycles planned (currently in Cycle 1) q Web Feature Service (WFS) – provides access to WRAP vector data at the feature level. Makes data available for display, analysis, & export from TSS, and accessible to external systems as appropriate. -C yc le 2 ----- q Feature Selection Capability – single or multiple mouse clicks q Feature Selection Capability – box, polygon, and circle/ellipse q Feature Selection Capability – on basis of attribute values (logical statement with boolean operators) q “Add layer” button – provides access to layers that are present in the metadata catalog (can be extended to layers from web services) C yc le 3 ---- q Web Mapping Service (WMS) – provides service to be ingested for display through IMAT, or through an external web mapping system. q “Create AOI layer” button – makes a temporary (cached) layer that serves as the user’s Area-of-Interest for analysis and/or data export.
IMAT – Planned Work and associated functionality q Support for multiple projections C yc le 4 ----- Ø reprojection capability – allows display of layers whose native projection differs from the RPO Lambert or GCS (Long/Lat) Ø implemented as Web Processing Service (WPS) q Capability to perform summary statistics on set of vector features from layers (accessed locally or through WFS) for user-defined region (i. e. , the AOI layer) -C yc le 5 ----- q Web Coverage Service (WCS) – provides access to WRAP raster data at the cell or nodal level. Makes data available for display, analysis, & export. Allows access to external systems as appropriate. q Style Layer Descriptor (SLD) – provides access to WRAP data with symbology dictated by requesting client, either by IMAT, or through an external web mapping system. Extends current work. q Summary statistics capability for raster layers for user-defined AOI.
IMAT – Future Work & associated functionality Potential Post-October 2006 development: q Provision of Cat. Man and Meta. Man tools as appropriate. Metaman provides metadata editing and validation capabilities. q Design and Implement Registry (Catalog) for contextual geospatial data and other key WRAP layers available through web services. C yc le 6 ------- q Identify key web services of interest (WMS, WFS, WCS) and populate the web service Registry with service info and capabilities. q Data download capability – site with “ftp from HTTP” transfer capability – develop tools and web pages that utilize the AOI functionality and the indexed data. Potential output formats include shapefiles, SDTS format, GML, and ASCII. q Metadata upload tools q Data upload tool – allow States and Tribes to upload data to TSS
TSS Version Control – Purpose • Periodic updates to the TSS databases and tools will occur after October 2006 for the following reasons: – Additional information (new model runs or user-uploaded analyses? ) – Corrections to existing information • SIP writers must be able to access the EXACT data set and tool set used in their SIPs
TSS Version Control – Method • Periodically take a “snapshot” of the TSS databases and tools, including: – Current monitoring, modeling, emissions data and associated documentation – Tools as they currently exist (versions may have different-looking tools) – Relevant in-house GIS layers and URLs to relevant outside GIS layers – External analyses uploaded to the TSS • Keep each version (“snapshot”) of the TSS untouched under a unique URL – changes to underlying data will not be made even if data sets are revised (e. g. , IMPROVE corrects flows which affect concentrations) • At any time there will exist these versions of the TSS available on-line: – Current (contains most up-to-date data/tools, but may change without notice) – Version 1 (date specified) – Version 2 (date specified) – … Version N (date specified) • All TSS products will ultimately be branded with the TSS version number/date
Anticipated Version Schedule • Current – This option will always be available and will include most recent updates as they occur • Version 1 – October 2006 – State of TSS at the end of this phase of the project • Version 2 – Spring 2007? – Anticipated after all final updates to emissions and modeling • Version 3 – December 2007? – Anticipated after SIP process is complete • Annual versions thereafter
Implications of Version Control • Users can always look at most recent data, but must be aware that it could change without notice • TSS Versions will remain intact, essentially as separate (though transparent) web sites, so SIP reviewers can always look up original data products • States need to understand the differences between versions, and should select the most recent Version number (not “Current”) when beginning their SIPS • What are implications with EPA and stakeholders if different states use different versions? – States may start their SIPs at different times – Interpretation of data not expected to change significantly between versions