Truckee River Water Quality Current Conditions and Trends

 www. truckeeriverinfo. org • City of Reno – Mahmood")


")
 Impaired Waters List – Total Maximum Daily Load (TMDL)")
 • amount of loading that the water body can")

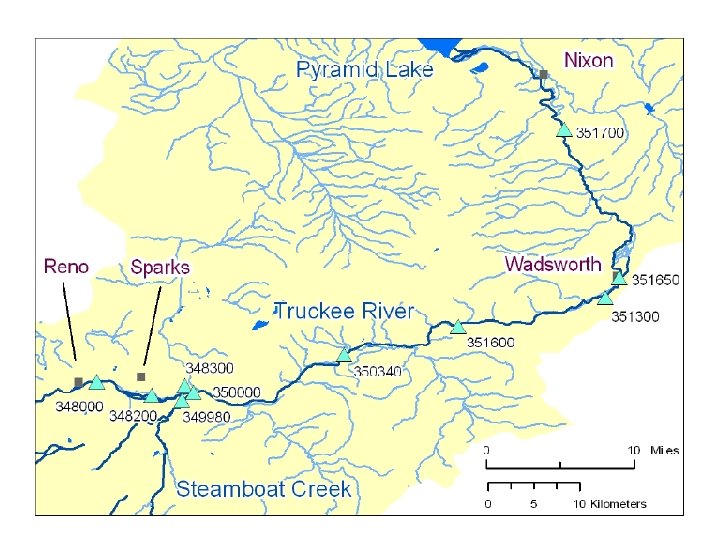
 monitoring stations used in study")
")

, and")

 at Lockwood Bridge during 1995 – 2006.")


 during 1998 – 2006.")


- Slides: 33
Truckee River Water Quality: Current Conditions and Trends Relevant to TMDLs and WLAs Prepared for: Truckee Meadows Water Reclamation Facility. City of Reno and City of Sparks, Nevada Prepared by: Alan Jassby Ph. D, Ted Daum MS, and Charles Goldman Ph. D, Ecological Research Associates, Davis, CA.
Truckee River Info Gateway (TRIG) www. truckeeriverinfo. org • City of Reno – Mahmood Azad, Program Manager • City of Sparks – Mike Brisbin, WQ Coordinator, TMWRF • Ecological Research Associates – Dr. Charles Goldman – Dr. Alan Jassby – Ted Daum (currently at EDAW, Inc. ) • UC Davis – David Waetjen
Truckee River Basin
Study Goals • Provide a description of the conditions and trends for TMDL water quality constituents • Estimate loads of these constituents at key points in the Truckee River • Relative impact of TMWRF effluent compared with other sources
Regulatory Background • Clean Water Act – The Clean Water Act of 1972 (CWA) is the primary federal law that governs and authorizes water quality control activities by the EPA as well as the states. – The law requires point-source effluent limits for industry and publicly owned treatment works (POTWs) and water quality standards for contaminants in surface waters.
Regulatory Background • Section 303(d) Impaired Waters List – Total Maximum Daily Load (TMDL) – Waste Load Allocation (WLA) • Nevada Division of Environmental Protection (NDEP) Bureau of Water Quality Planning water quality protection functions including: – developing water quality standards for surface waters, contained in the Nevada Administrative Code (NAC)
Total Maximum Daily Load (TMDL) • amount of loading that the water body can receive and still meet water quality standards • can also act as a plan to reduce loading of a specific pollutant from various sources to achieve compliance with water quality objectives • Waste Load Allocations (WLA) - must include an allocation of allowable loadings to point and non-point sources, with consideration of background loadings and a margin of safety.
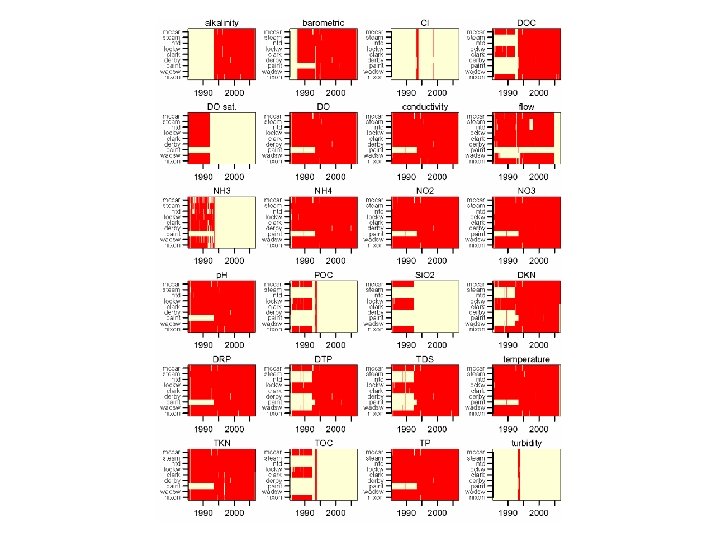
Data Sources • Most data used in study from Truckee Meadows Water Reclamation Facility (TMWRF) monitoring stations, 1985 – 2006. Names, station codes, locations, and distance (km) from Lake Tahoe.
Truckee Meadows Water Reclamation Facility (TMWRF) monitoring stations used in study
Truckee Meadows Water Reclamation Facility (TMWRF)
Steamboat Creek Upstream of TMWRF
USGS gage stations used in study, gage site numbers, drainage areas (km 2), and corresponding monitoring stations for calculation purposes
Gaging Station Schematic and Associated TMWRF Monitoring Station
TMDL-related Truckee River water quality constituents (mg/l) at Lockwood Bridge during 1995 – 2006.
Distributions of Monthly Mean Concentrations at TMWRF Stations relative to the Monthly Mean at mccarran, the Most Upstream Station 1995 - 2006
DIN: DRP molar ratios versus DRP at TMWRF stations during summers of 1998 – 2006.
Seasonal distributions of total and inorganic N: P ratios at TMWRF stations during 1995 – 2006
Monthly Averages of Daily Constituent Loads in TMWRF Effluent
TMWRF Effluent Trends and Loads
Trends in TMWRF effluent concentrations and loads during 1995 --2006.
Population of Washoe County and of Reno and Sparks combined.
Monthly Average Nitrogen Fractions at Lockwood
Monthly Average P Fractions, TDS, and DOC at Lockwood
River Trends in Water Quality Constituents 1995 2006
Mean Daily Loads of Water Quality Constituents (kg/day) during 1998 – 2006.
Median Ratio of Daily TMWRF Loads to TMWRF + mccarran + steamboat + ntd in Summers of 1998 – 2006.
Conclusions • N Loadings Above Lockwood: Truckee River > Steamboat Creek > TMWRF > North Truckee Drain • No trends in loading of any N fraction since WLAs adopted despite increase in service area population, likely due to TMWRF N treatment advances • Strong N limitation for plant growth, especially downstream
Conclusions • TN and TP loadings between wadsworth and nixon, and between lockwood and clark, exceed TMWRF effluent contributions • TP and DRP loadings from TMWRF have increased since 1995. Increase similar to population increase. • TP and DRP loadings have also increased upstream of TMWRF and in North Truckee Drain
Conclusions • Map lower watershed areas for potential N and P sources, synoptic study to compare contributions • TMDL and WLA revisions should take into account relevant timescales – Integrated loading for Pyramid Lake impacts – Median daily loading during summer for nutrient loading to the Truckee River
TRIG and ERA Truckee River Water Quality Report • TRIG Potential – Loading Calculations – TMDLs and WLAs – Contaminant Status and Trends – Data Gaps – Other