Troubleshooting Techniques Extraction and Analysis of Performance Indicators
Troubleshooting Techniques (*) • Extraction and Analysis of Performance Indicators – Consumer-producer chain framework – Tools • Query plan monitors • Performance monitors • Event monitors (*) From Alberto Lerner’s chapter 9 - Troubleshooting 1
Event Monitors to Identify Critical Queries • If no user complains. . . • Capture usage measurements at specific events (eg, end of each query) and then sort by usage • Less overhead than other type of tools because indicators are usually by-product of events monitored • Typical measures include CPU used, IO used, locks obtained etc. 9 - Troubleshooting 2
Non-clustering indexes can be trouble For a low selectivity predicate, each access to the index generates a random access to the table – possibly duplicate! It ends up that the number of pages read from the table is greater than its size, i. e. , a table scan is way better Table Scan CPU time data logical reads data physical reads index logical reads index physical reads 9 - Troubleshooting 5 sec 143, 075 pages 6, 777 pages 136, 319 pages 7 pages Index Scan 76 sec 272, 618 pages 131, 425 pages 273, 173 pages 552 pages 3
An example Performance Monitor (query level) • Buffer and CPU consumption for a query according to DB 2’s Benchmark tool • Similar tools: MSSQL’s SET STATISTICS switch and Oracle’s SQL Analyze Tool Statement number: 1 select C_NAME, N_NAME from DBA. CUSTOMER join DBA. NATION on C_NATIONKEY = N_NATIONKEY where C_ACCTBAL > 0 Number of rows retrieved is: 136308 Number of rows sent to output is: 0 Elapsed Time is: 76. 349 seconds … Buffer pool data logical reads = 272618 Buffer pool data physical reads = 131425 Buffer pool data writes =0 Buffer pool index logical reads = 273173 Buffer pool index physical reads = 552 Buffer pool index writes =0 Total buffer pool read time (ms) = 71352 Total buffer pool write time (ms) =0 … Summary of Results ========= Elapsed Agent CPU Rows Statement # Time (s) Fetched Printed 1 76. 349 6. 670 136308 0
Investigating Primary Resources • Answer question 3: “Are there enough primary resources available for a DBMS to consume? ” • Primary resources are: CPU, disk & controllers, memory, and network Analyze specific OS-level indicators to discover bottlenecks. A system-level Performance Monitor is the right tool here • • 9 - Troubleshooting 5
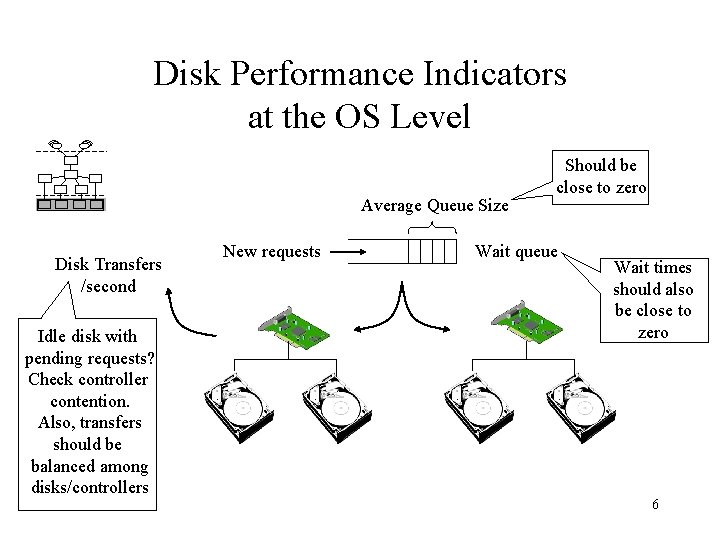
Disk Performance Indicators at the OS Level Average Queue Size Disk Transfers /second Idle disk with pending requests? Check controller contention. Also, transfers should be balanced among disks/controllers New requests Should be close to zero Wait queue Wait times should also be close to zero 6
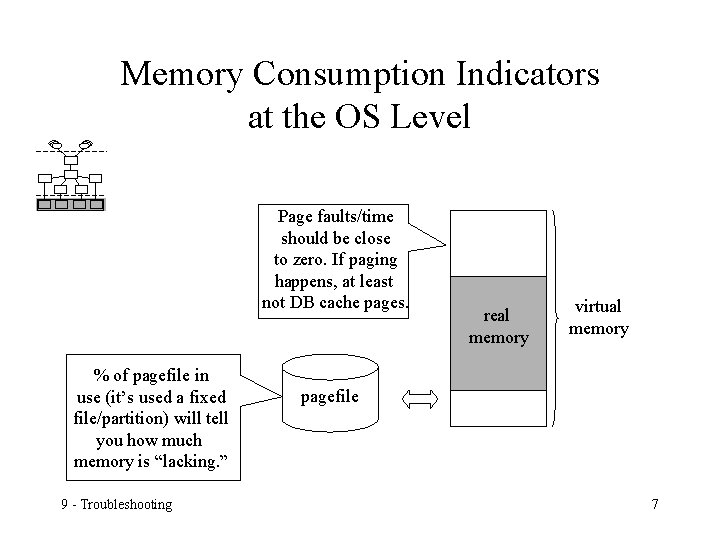
Memory Consumption Indicators at the OS Level Page faults/time should be close to zero. If paging happens, at least not DB cache pages. % of pagefile in use (it’s used a fixed file/partition) will tell you how much memory is “lacking. ” 9 - Troubleshooting real memory virtual memory pagefile 7
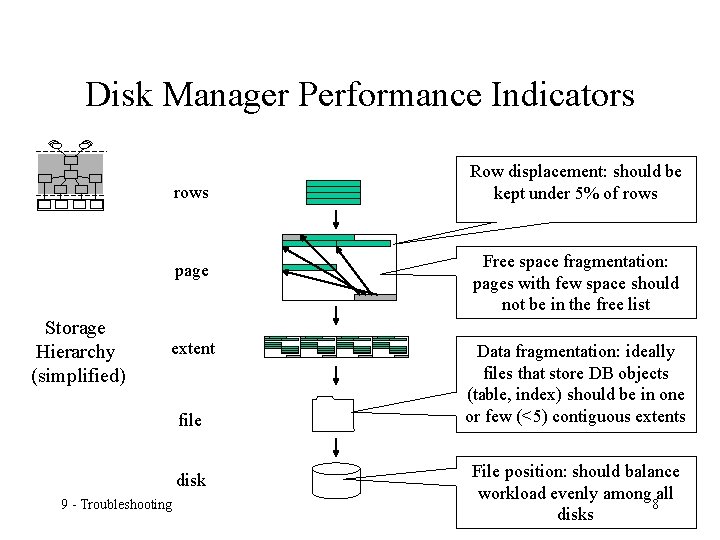
Disk Manager Performance Indicators rows page Storage Hierarchy (simplified) extent file disk 9 - Troubleshooting Row displacement: should be kept under 5% of rows Free space fragmentation: pages with few space should not be in the free list Data fragmentation: ideally files that store DB objects (table, index) should be in one or few (<5) contiguous extents File position: should balance workload evenly among all 8 disks
- Slides: 8