
Tropospheric Air Quality Smog PM Acid Deposition Air




- Slides: 51
Tropospheric Air Quality Smog, PM, Acid Deposition
Air Quality Problems • Question – What are the air quality problems caused by pollution? – For each problem, state the pollutant being emitted and the activity that results in the emission.
U. S. Air Pollutant Trends (The Good News) GDP VMT Energy Consumption US Population Aggregate Emissions Source: EPA, Latest Findings on National Air Quality, “ 2001 Status and Trends” summary report.
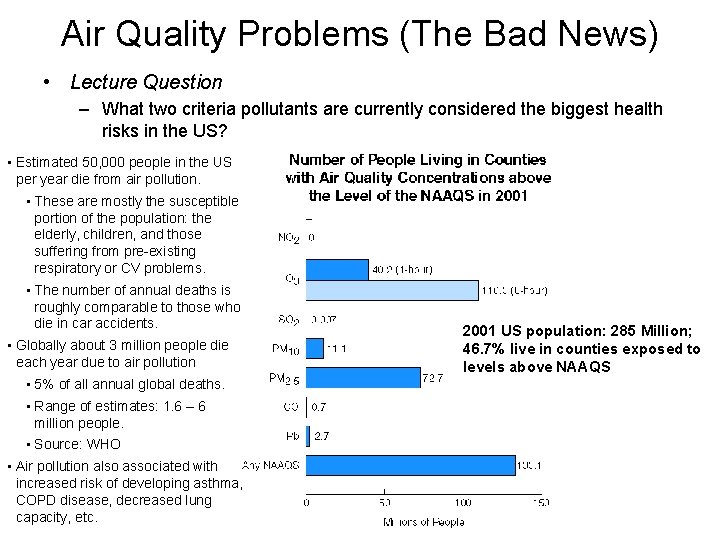
Air Quality Problems (The Bad News) • Lecture Question – What two criteria pollutants are currently considered the biggest health risks in the US? • Estimated 50, 000 people in the US per year die from air pollution. • These are mostly the susceptible portion of the population: the elderly, children, and those suffering from pre-existing respiratory or CV problems. • The number of annual deaths is roughly comparable to those who die in car accidents. • Globally about 3 million people die each year due to air pollution • 5% of all annual global deaths. • Range of estimates: 1. 6 – 6 million people. • Source: WHO • Air pollution also associated with increased risk of developing asthma, COPD disease, decreased lung capacity, etc. 2001 US population: 285 Million; 46. 7% live in counties exposed to levels above NAAQS
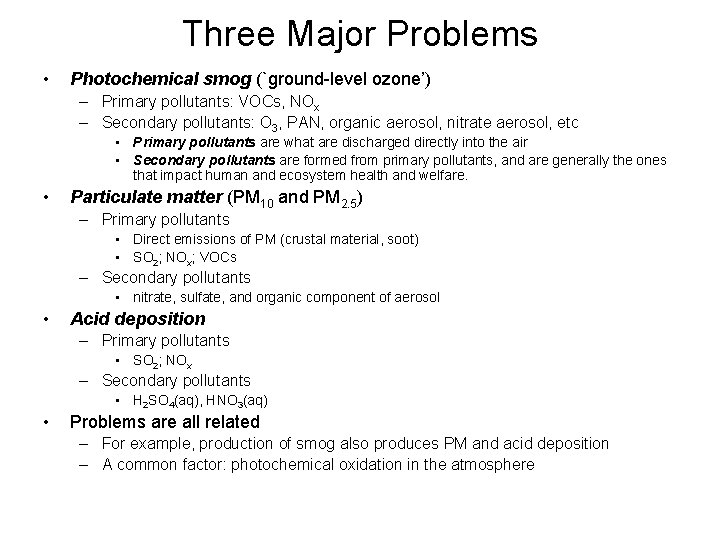
Three Major Problems • Photochemical smog (`ground-level ozone’) – Primary pollutants: VOCs, NOx – Secondary pollutants: O 3, PAN, organic aerosol, nitrate aerosol, etc • Primary pollutants are what are discharged directly into the air • Secondary pollutants are formed from primary pollutants, and are generally the ones that impact human and ecosystem health and welfare. • Particulate matter (PM 10 and PM 2. 5) – Primary pollutants • Direct emissions of PM (crustal material, soot) • SO 2; NOx; VOCs – Secondary pollutants • nitrate, sulfate, and organic component of aerosol • Acid deposition – Primary pollutants • SO 2; NOx – Secondary pollutants • H 2 SO 4(aq), HNO 3(aq) • Problems are all related – For example, production of smog also produces PM and acid deposition – A common factor: photochemical oxidation in the atmosphere
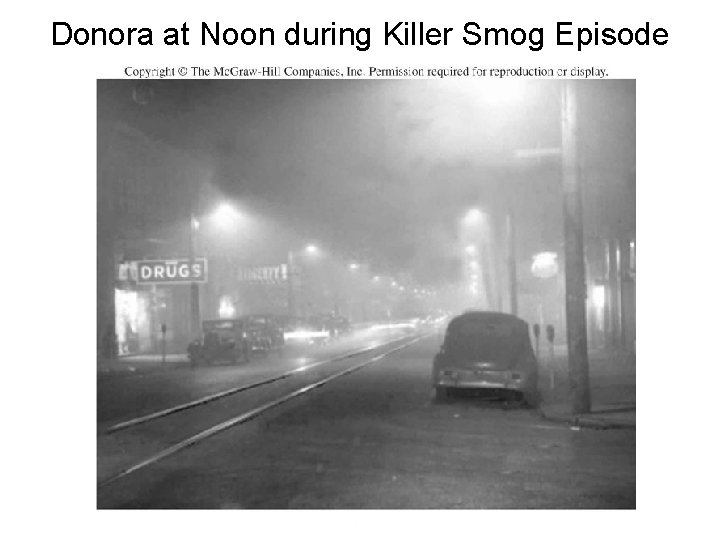
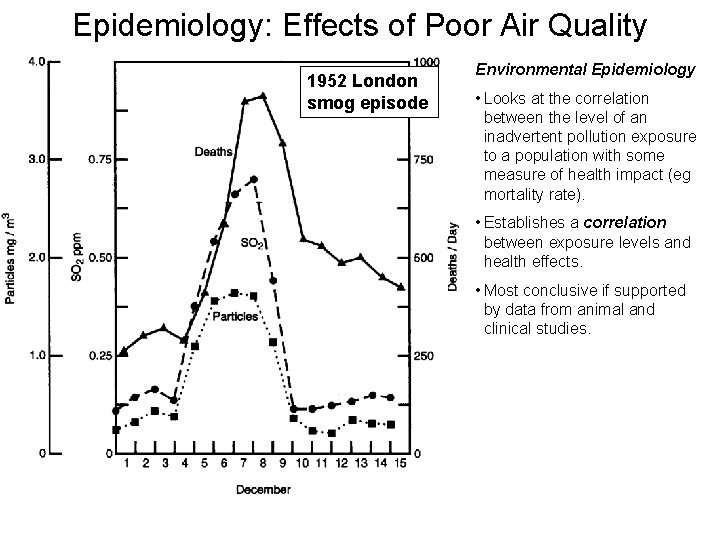
Killer Smog Episodes • 1930: 63 die in Meuse Valley, Belgium – prophetic: “Proportionally the public services of London, e. g. , might be faced with the responsibility of 3200 sudden deaths if such a phenomenon occurred there. ” • 1948: 20 die in Donora, PA – one-third residents ill; see http: //www. westol. com/~shawley/dhs/smog. pdf • 1952: 4000 die in London – leads to UK’s first Clean Air Act • 1962: 700 die in London – meteorological conditions similar to those in 1952 episode but with far fewer deaths • Sulfurous Smogs – The above severe smog episodes are all examples of “London smog, ” or sulfurous smogs. • Distinguished from current smog problems, called photochemical or “LA” smog.
Donora at Noon during Killer Smog Episode
Epidemiology: Effects of Poor Air Quality 1952 London smog episode Environmental Epidemiology • Looks at the correlation between the level of an inadvertent pollution exposure to a population with some measure of health impact (eg mortality rate). • Establishes a correlation between exposure levels and health effects. • Most conclusive if supported by data from animal and clinical studies.
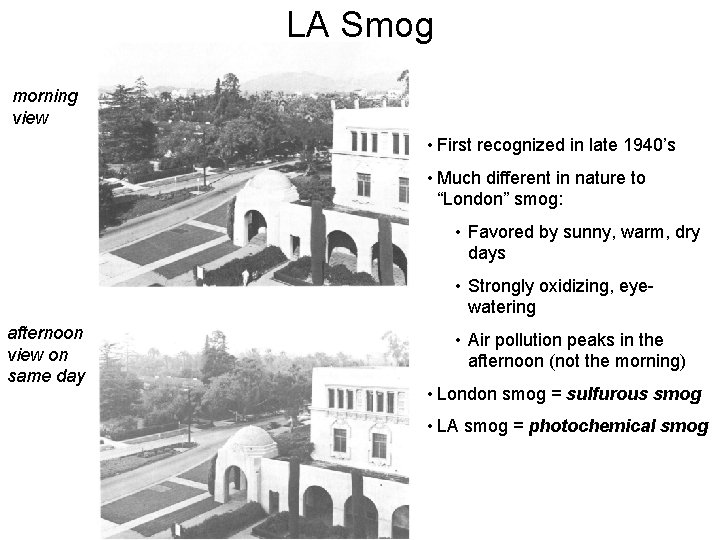
LA Smog morning view • First recognized in late 1940’s • Much different in nature to “London” smog: • Favored by sunny, warm, dry days • Strongly oxidizing, eyewatering afternoon view on same day • Air pollution peaks in the afternoon (not the morning) • London smog = sulfurous smog • LA smog = photochemical smog
Photochemical Smog • What exactly is photochemical smog? – Main component is ozone, O 3 • Smog often referred to as “ground-level ozone” or “bad ozone” – To distinguish it from the “good ozone” in the stratospheric ozone layer – There is, of course, no chemical difference other than location. Ozone is toxic (bad if we breathe it) but also shields us from harmful uv light – It is a complicated mixture (secondary pollutants) • Ozone • Partially oxidized organics – – – Alcohols (eg methanol, ethanol) Organic acids (eg acetic acid, formic acid) Ketones (eg acetone) Aldehydes (eg formaldehyde) Organic nitrates (eg peroxyacyl nitrates, PANs) • Nitrogen dioxide, NO 2 – A brown-colored gas; the source of the ozone • Particulate matter, PM – With high nitrate and organic components
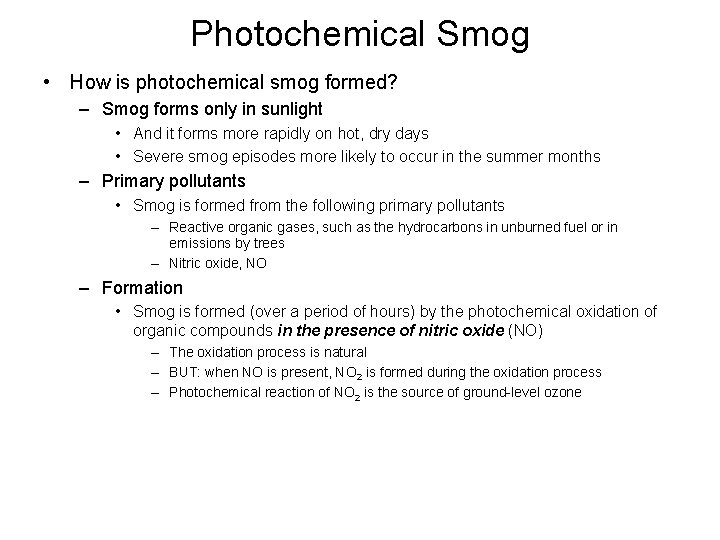
Photochemical Smog • How is photochemical smog formed? – Smog forms only in sunlight • And it forms more rapidly on hot, dry days • Severe smog episodes more likely to occur in the summer months – Primary pollutants • Smog is formed from the following primary pollutants – Reactive organic gases, such as the hydrocarbons in unburned fuel or in emissions by trees – Nitric oxide, NO – Formation • Smog is formed (over a period of hours) by the photochemical oxidation of organic compounds in the presence of nitric oxide (NO) – The oxidation process is natural – BUT: when NO is present, NO 2 is formed during the oxidation process – Photochemical reaction of NO 2 is the source of ground-level ozone
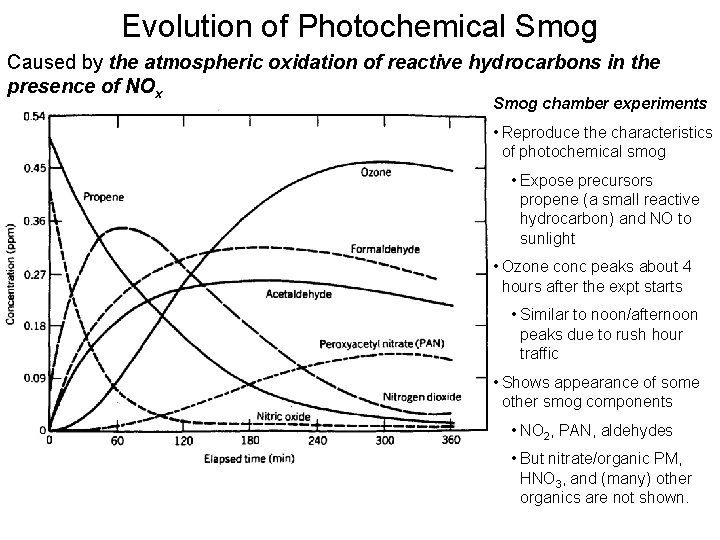
Evolution of Photochemical Smog Caused by the atmospheric oxidation of reactive hydrocarbons in the presence of NOx Smog chamber experiments • Reproduce the characteristics of photochemical smog • Expose precursors propene (a small reactive hydrocarbon) and NO to sunlight • Ozone conc peaks about 4 hours after the expt starts • Similar to noon/afternoon peaks due to rush hour traffic • Shows appearance of some other smog components • NO 2, PAN, aldehydes • But nitrate/organic PM, HNO 3, and (many) other organics are not shown.
Photochemical Oxidants • OH – The major oxidant during daylight hours (for most molecules) – Formed by the photodissociation of a number of compounds (O 3, HONO, H 2 O 2, aldehydes) – Disappears at night • NO 3 – Most important nighttime oxidant, especially in polluted areas – Formed by NO 2 + O 3 NO 3 + O 2 • O 3 – Major source: photodissociation of NO 2 – Attacks unsaturated HCs (day and night) • “Unsaturated HCs contain double bonds • Usually does not attack aromatic HCs • Cl – Powerful oxidant in the marine boundary layer, MBL, where it acts much like OH – Really only a factor in coastal areas, or over oceans
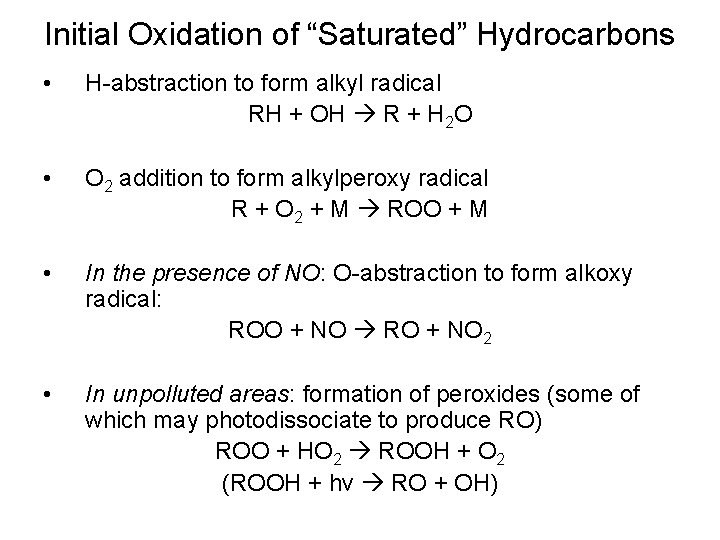
Initial Oxidation of “Saturated” Hydrocarbons • H-abstraction to form alkyl radical RH + OH R + H 2 O • O 2 addition to form alkylperoxy radical R + O 2 + M ROO + M • In the presence of NO: O-abstraction to form alkoxy radical: ROO + NO RO + NO 2 • In unpolluted areas: formation of peroxides (some of which may photodissociate to produce RO) ROO + HO 2 ROOH + O 2 (ROOH + hv RO + OH)
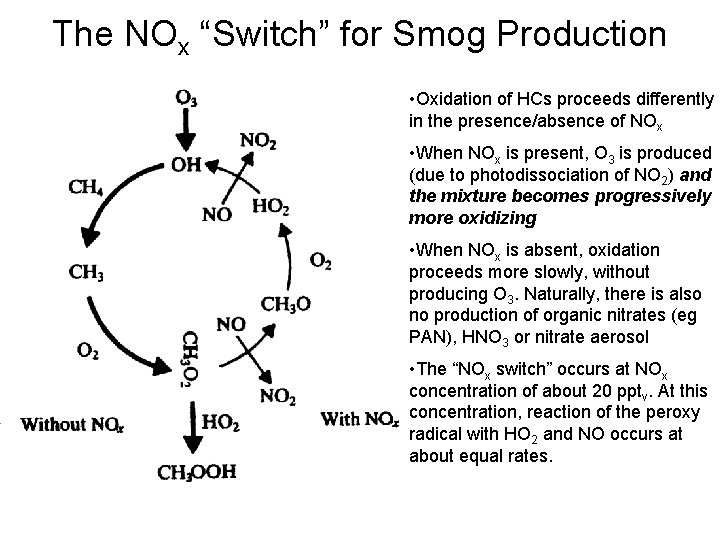
The NOx “Switch” for Smog Production • Oxidation of HCs proceeds differently in the presence/absence of NOx • When NOx is present, O 3 is produced (due to photodissociation of NO 2) and the mixture becomes progressively more oxidizing • When NOx is absent, oxidation proceeds more slowly, without producing O 3. Naturally, there is also no production of organic nitrates (eg PAN), HNO 3 or nitrate aerosol • The “NOx switch” occurs at NOx concentration of about 20 pptv. At this concentration, reaction of the peroxy radical with HO 2 and NO occurs at about equal rates.
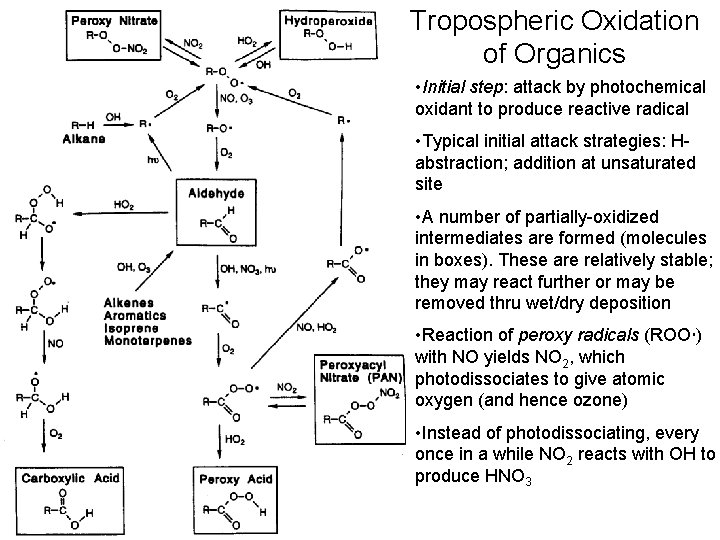
Tropospheric Oxidation of Organics • Initial step: attack by photochemical oxidant to produce reactive radical • Typical initial attack strategies: Habstraction; addition at unsaturated site • A number of partially-oxidized intermediates are formed (molecules in boxes). These are relatively stable; they may react further or may be removed thru wet/dry deposition • Reaction of peroxy radicals (ROO ) with NO yields NO 2, which photodissociates to give atomic oxygen (and hence ozone) • Instead of photodissociating, every once in a while NO 2 reacts with OH to produce HNO 3
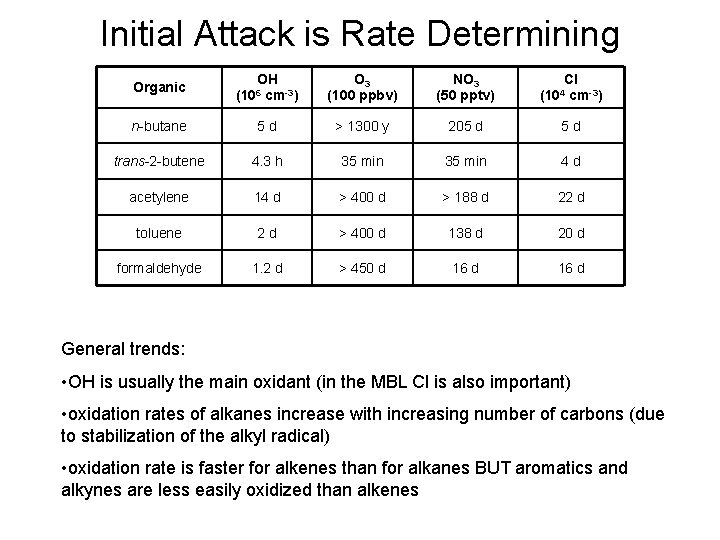
Initial Attack is Rate Determining Organic OH (106 cm-3) O 3 (100 ppbv) NO 3 (50 pptv) Cl (104 cm-3) n-butane 5 d > 1300 y 205 d 5 d trans-2 -butene 4. 3 h 35 min 4 d acetylene 14 d > 400 d > 188 d 22 d toluene 2 d > 400 d 138 d 20 d formaldehyde 1. 2 d > 450 d 16 d General trends: • OH is usually the main oxidant (in the MBL Cl is also important) • oxidation rates of alkanes increase with increasing number of carbons (due to stabilization of the alkyl radical) • oxidation rate is faster for alkenes than for alkanes BUT aromatics and alkynes are less easily oxidized than alkenes
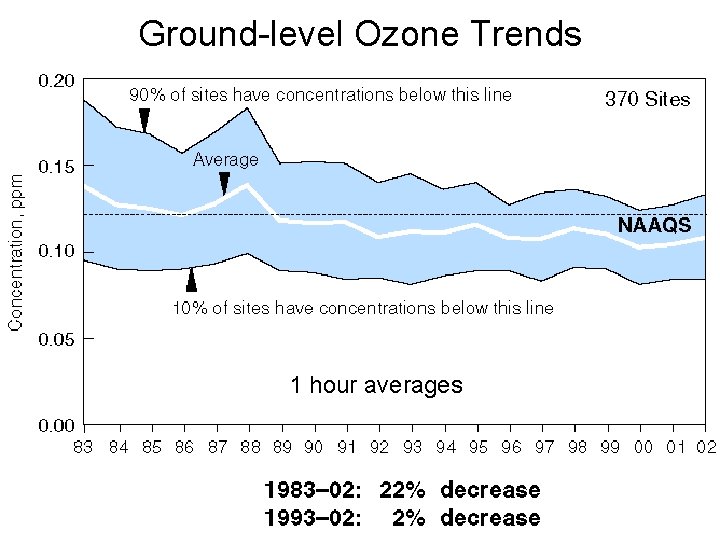
Ground-level Ozone Trends 1 hour averages
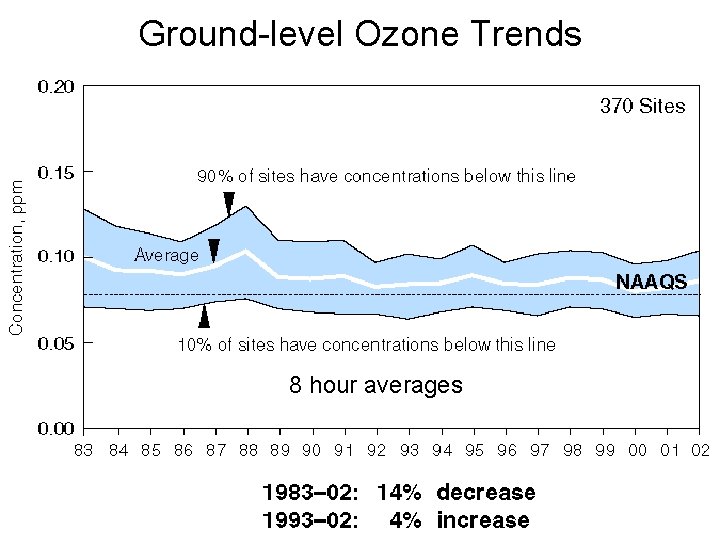
Ground-level Ozone Trends 8 hour averages
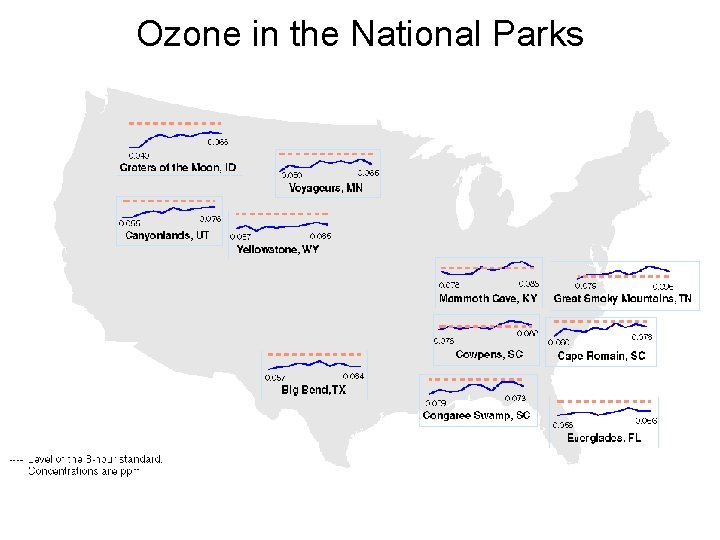
Ozone in the National Parks
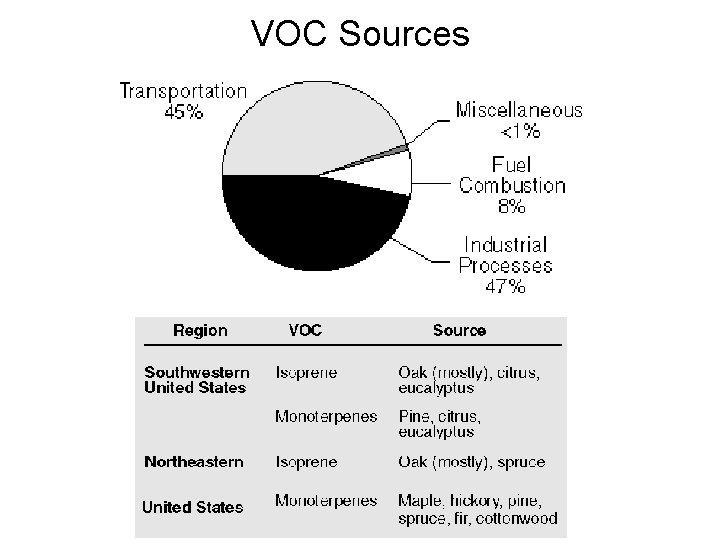
VOC Sources
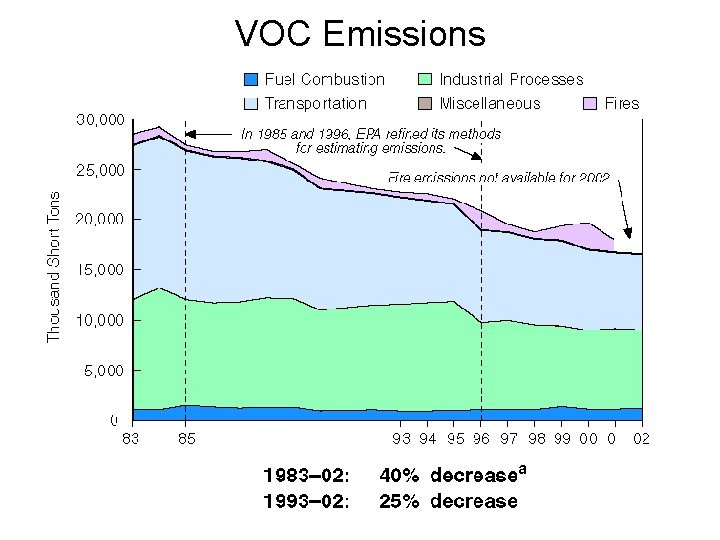
VOC Emissions
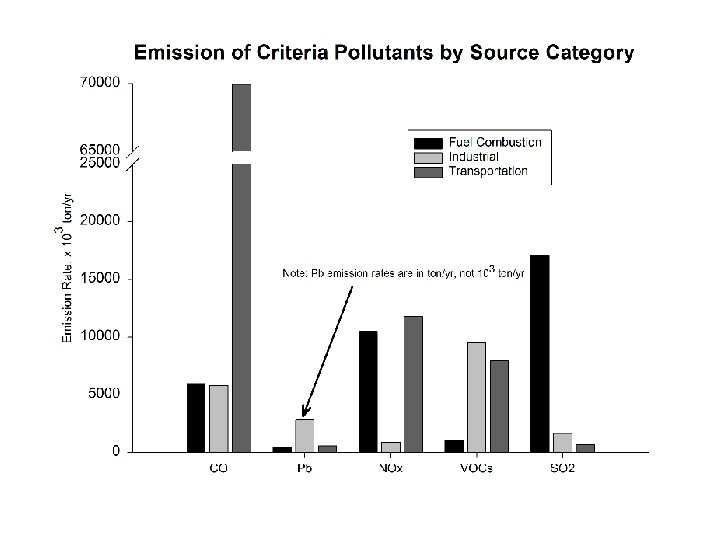
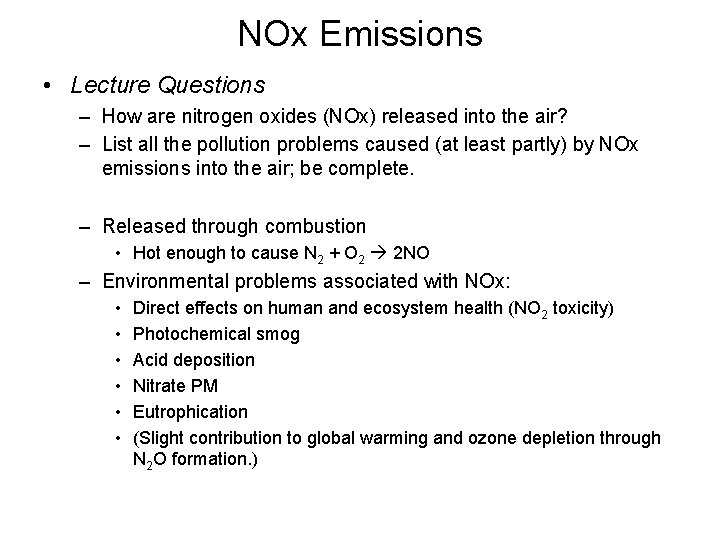
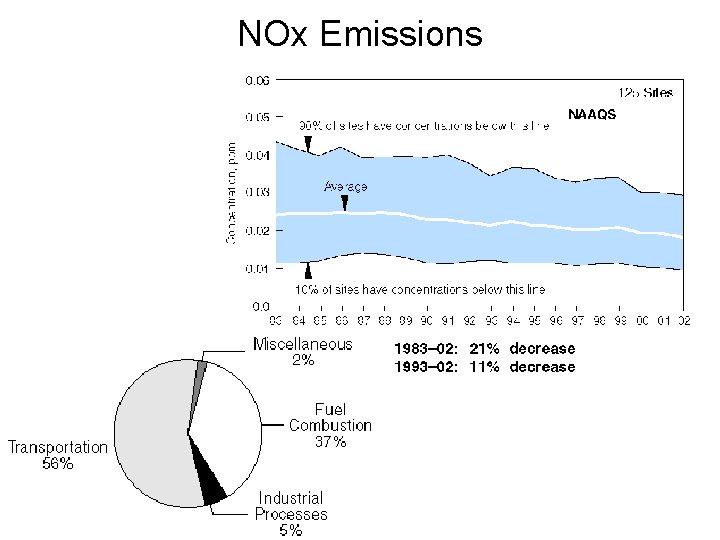
NOx Emissions • Lecture Questions – How are nitrogen oxides (NOx) released into the air? – List all the pollution problems caused (at least partly) by NOx emissions into the air; be complete. – Released through combustion • Hot enough to cause N 2 + O 2 2 NO – Environmental problems associated with NOx: • • • Direct effects on human and ecosystem health (NO 2 toxicity) Photochemical smog Acid deposition Nitrate PM Eutrophication (Slight contribution to global warming and ozone depletion through N 2 O formation. )
NOx Emissions
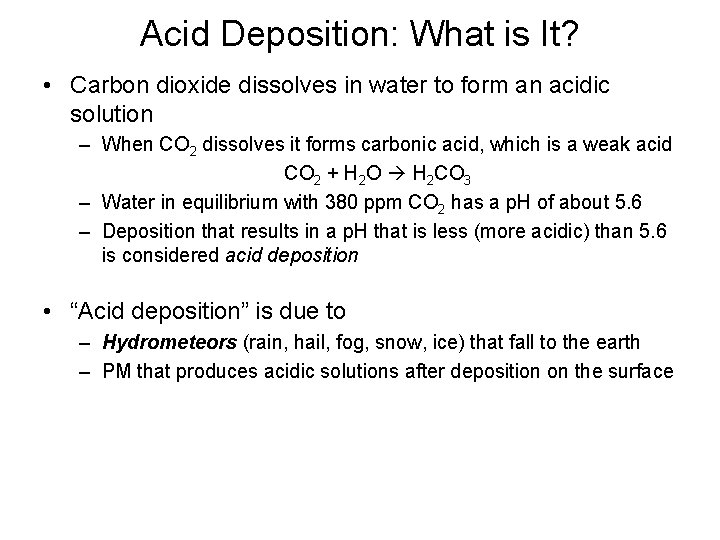
Acid Deposition: What is It? • Carbon dioxide dissolves in water to form an acidic solution – When CO 2 dissolves it forms carbonic acid, which is a weak acid CO 2 + H 2 O H 2 CO 3 – Water in equilibrium with 380 ppm CO 2 has a p. H of about 5. 6 – Deposition that results in a p. H that is less (more acidic) than 5. 6 is considered acid deposition • “Acid deposition” is due to – Hydrometeors (rain, hail, fog, snow, ice) that fall to the earth – PM that produces acidic solutions after deposition on the surface
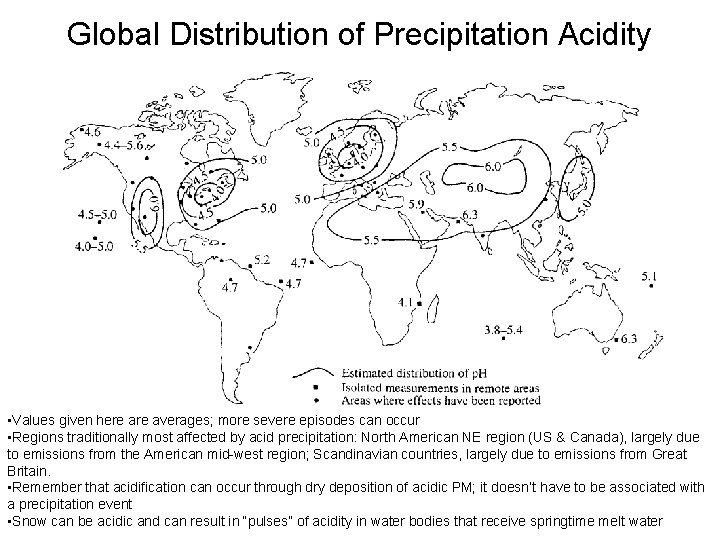
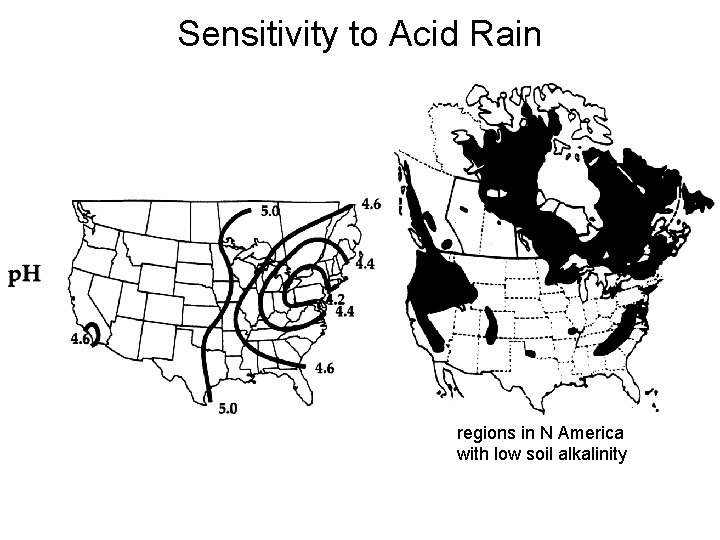
Global Distribution of Precipitation Acidity • Values given here averages; more severe episodes can occur • Regions traditionally most affected by acid precipitation: North American NE region (US & Canada), largely due to emissions from the American mid-west region; Scandinavian countries, largely due to emissions from Great Britain. • Remember that acidification can occur through dry deposition of acidic PM; it doesn’t have to be associated with a precipitation event • Snow can be acidic and can result in “pulses” of acidity in water bodies that receive springtime melt water
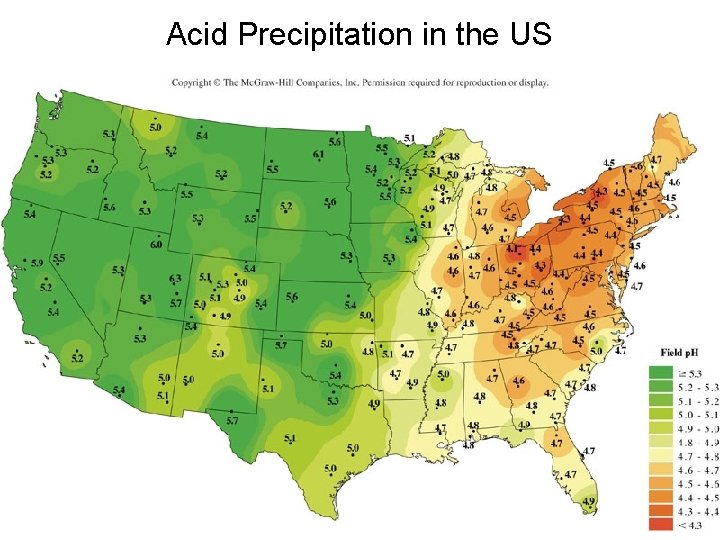
Acid Precipitation in the US
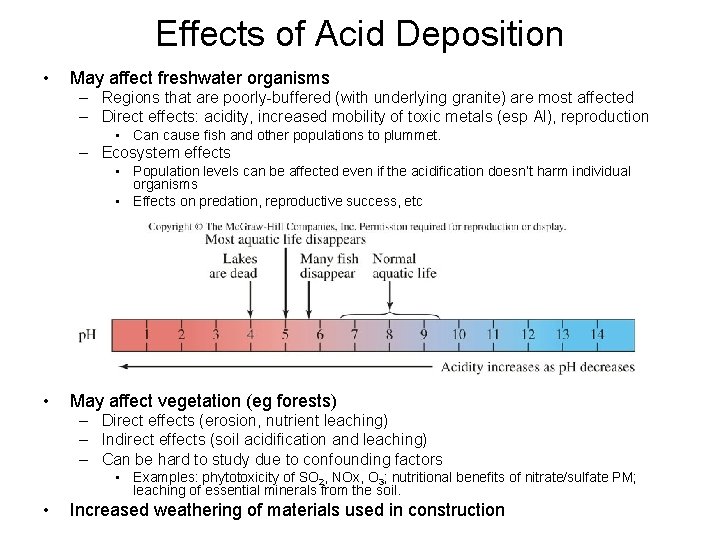
Effects of Acid Deposition • May affect freshwater organisms – Regions that are poorly-buffered (with underlying granite) are most affected – Direct effects: acidity, increased mobility of toxic metals (esp Al), reproduction • Can cause fish and other populations to plummet. – Ecosystem effects • Population levels can be affected even if the acidification doesn’t harm individual organisms • Effects on predation, reproductive success, etc • May affect vegetation (eg forests) – Direct effects (erosion, nutrient leaching) – Indirect effects (soil acidification and leaching) – Can be hard to study due to confounding factors • Examples: phytotoxicity of SO 2, NOx, O 3; nutritional benefits of nitrate/sulfate PM; leaching of essential minerals from the soil. • Increased weathering of materials used in construction
Sensitivity to Acid Rain regions in N America with low soil alkalinity
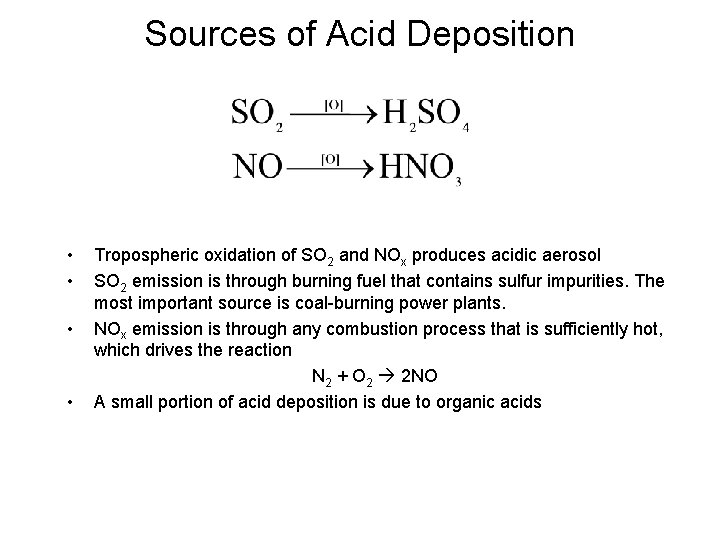
Sources of Acid Deposition • • Tropospheric oxidation of SO 2 and NOx produces acidic aerosol SO 2 emission is through burning fuel that contains sulfur impurities. The most important source is coal-burning power plants. NOx emission is through any combustion process that is sufficiently hot, which drives the reaction N 2 + O 2 2 NO A small portion of acid deposition is due to organic acids
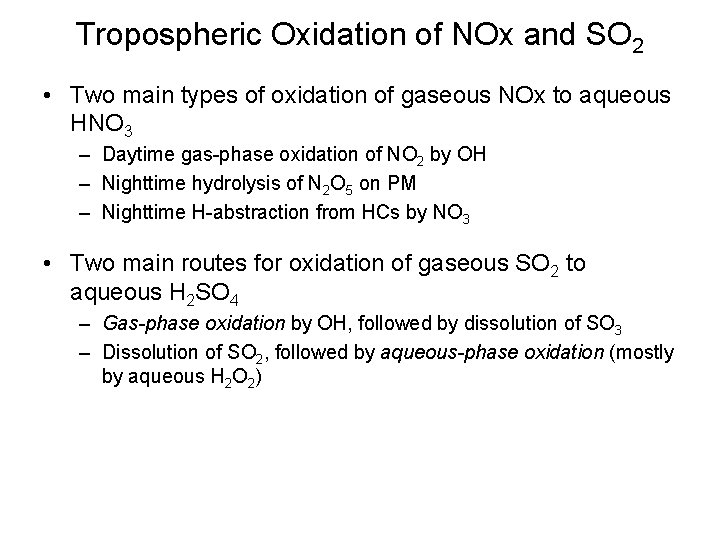
Tropospheric Oxidation of NOx and SO 2 • Two main types of oxidation of gaseous NOx to aqueous HNO 3 – Daytime gas-phase oxidation of NO 2 by OH – Nighttime hydrolysis of N 2 O 5 on PM – Nighttime H-abstraction from HCs by NO 3 • Two main routes for oxidation of gaseous SO 2 to aqueous H 2 SO 4 – Gas-phase oxidation by OH, followed by dissolution of SO 3 – Dissolution of SO 2, followed by aqueous-phase oxidation (mostly by aqueous H 2 O 2)
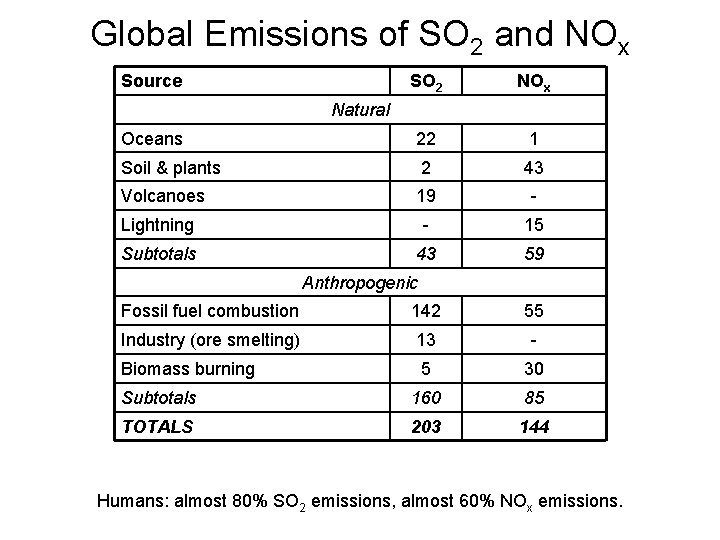
Global Emissions of SO 2 and NOx Source SO 2 NOx Oceans 22 1 Soil & plants 2 43 Volcanoes 19 - Lightning - 15 Subtotals 43 59 Natural Anthropogenic Fossil fuel combustion 142 55 Industry (ore smelting) 13 - Biomass burning 5 30 Subtotals 160 85 TOTALS 203 144 Humans: almost 80% SO 2 emissions, almost 60% NOx emissions.
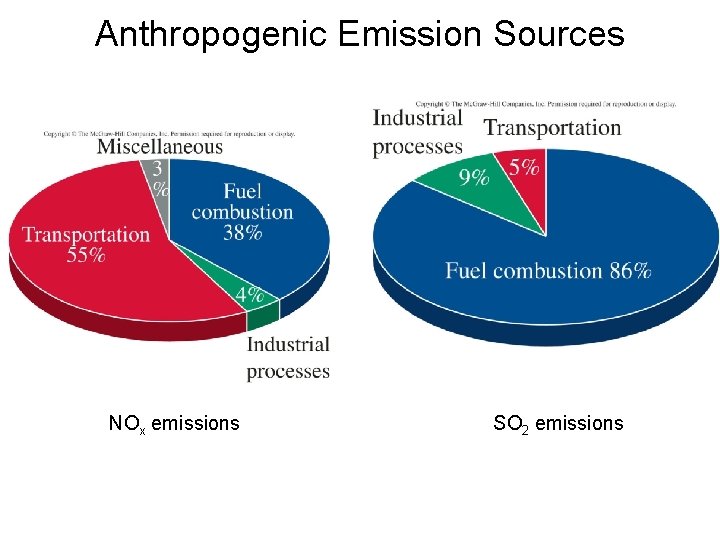
Anthropogenic Emission Sources NOx emissions SO 2 emissions
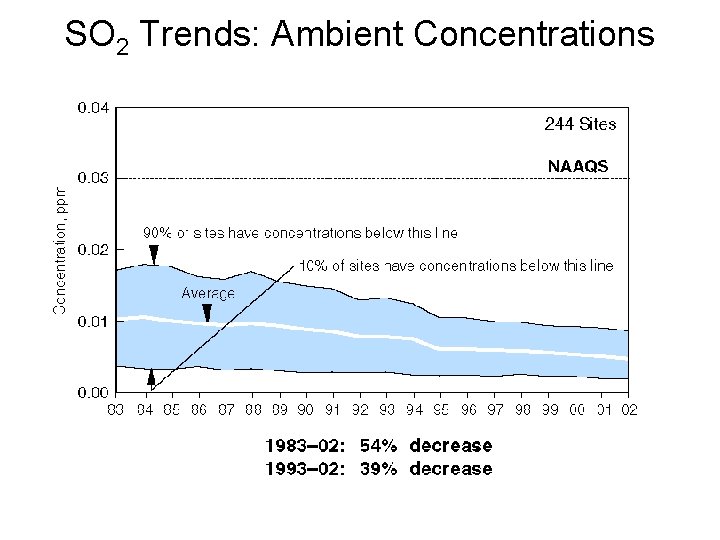
SO 2 Trends: Ambient Concentrations
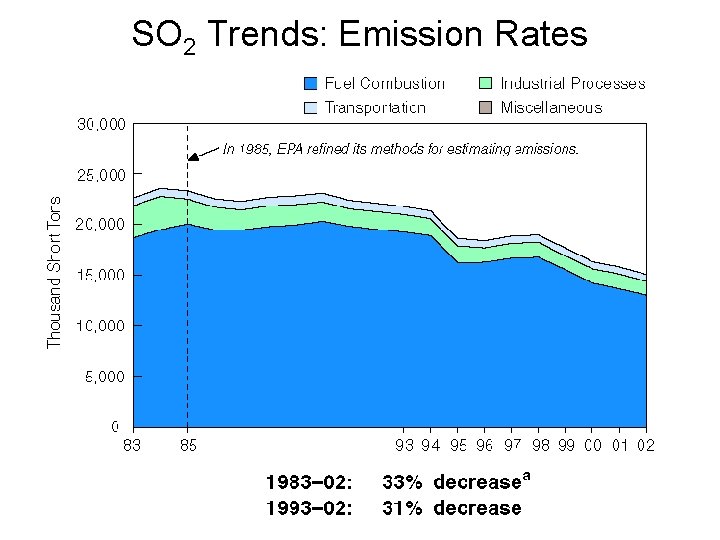
SO 2 Trends: Emission Rates
Significance of Atmospheric Aerosol (PM) • • • Atmospheric composition & reactions Cloud formation and properties Absorption & scattering of light Climate Health – PM-10 has been shown in many epidemiological studies to be strongly related to mortality rates. Some show a 1% increase in mortality for as little as a 10 mg/m 3 increase in PM-10. • Visibility
Important Properties of PM • Concentration (diameter, surface area) • Size distribution • Chemical composition Important questions: • What are the processes by which the atmospheric aerosol is formed? • How do human activities impact the nature (concentration, size distribution, composition) of the atmospheric aerosol?
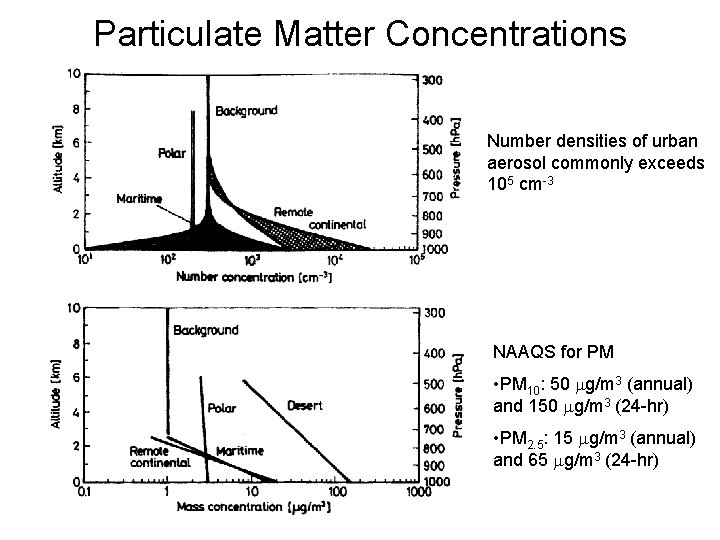
Particulate Matter Concentrations Number densities of urban aerosol commonly exceeds 105 cm-3 NAAQS for PM • PM 10: 50 mg/m 3 (annual) and 150 mg/m 3 (24 -hr) • PM 2. 5: 15 mg/m 3 (annual) and 65 mg/m 3 (24 -hr)
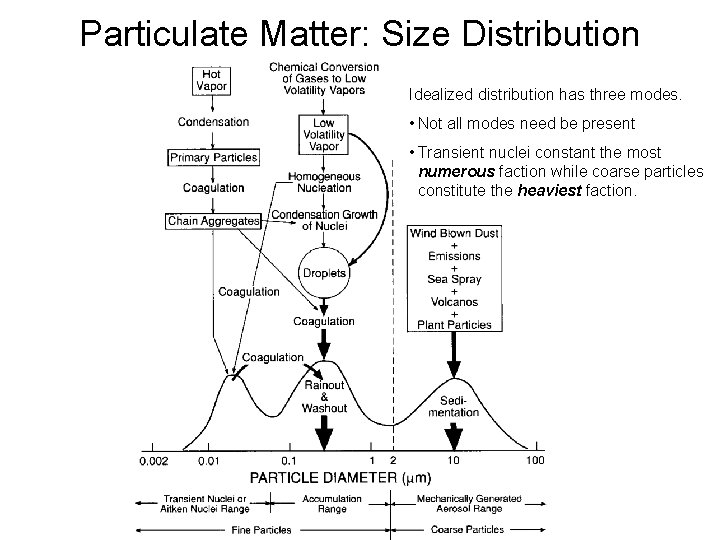
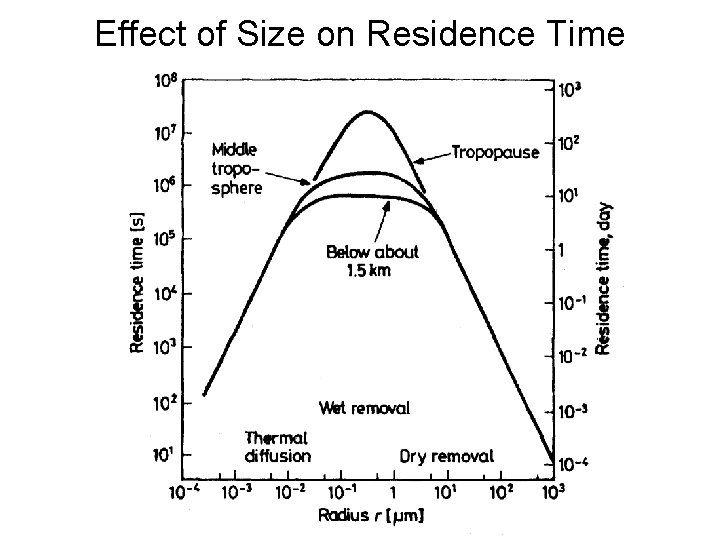
Particulate Matter Size • PM is classified by size and composition – Diameter < 2. 5 mm: fine PM • Formation – Coagulation of still smaller particules – Condensation of gases on smaller particles – Much fine PM is a secondary pollutant • Removal – Sedimentation (removal by gravity) is slow – Main removal mechanisms: scavenging, coagulation, adsorption • Effects – More important in atmospheric chemistry – More important in terms of health effects – Diameter > 2. 5 mm : coarse PM • Formation – Mechanical breaking up of larger particles – Both natural and direct anthropogenic sources • Removal by sedimentation is rapid
Particulate Matter: Size Distribution Idealized distribution has three modes. • Not all modes need be present • Transient nuclei constant the most numerous faction while coarse particles constitute the heaviest faction.
Effect of Size on Residence Time
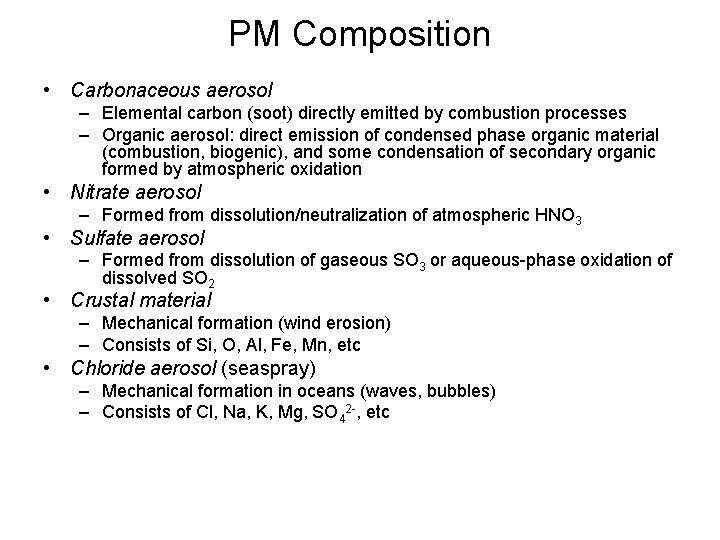
PM Composition • Carbonaceous aerosol – Elemental carbon (soot) directly emitted by combustion processes – Organic aerosol: direct emission of condensed phase organic material (combustion, biogenic), and some condensation of secondary organic formed by atmospheric oxidation • Nitrate aerosol – Formed from dissolution/neutralization of atmospheric HNO 3 • Sulfate aerosol – Formed from dissolution of gaseous SO 3 or aqueous-phase oxidation of dissolved SO 2 • Crustal material – Mechanical formation (wind erosion) – Consists of Si, O, Al, Fe, Mn, etc • Chloride aerosol (seaspray) – Mechanical formation in oceans (waves, bubbles) – Consists of Cl, Na, K, Mg, SO 42 -, etc
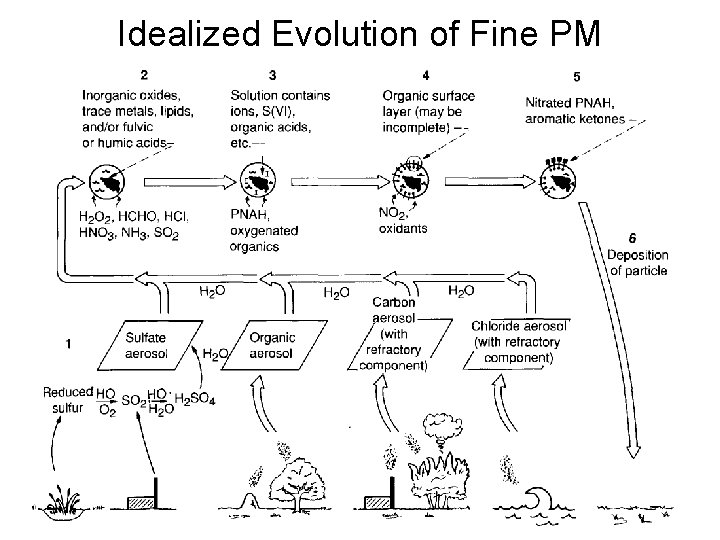
Idealized Evolution of Fine PM
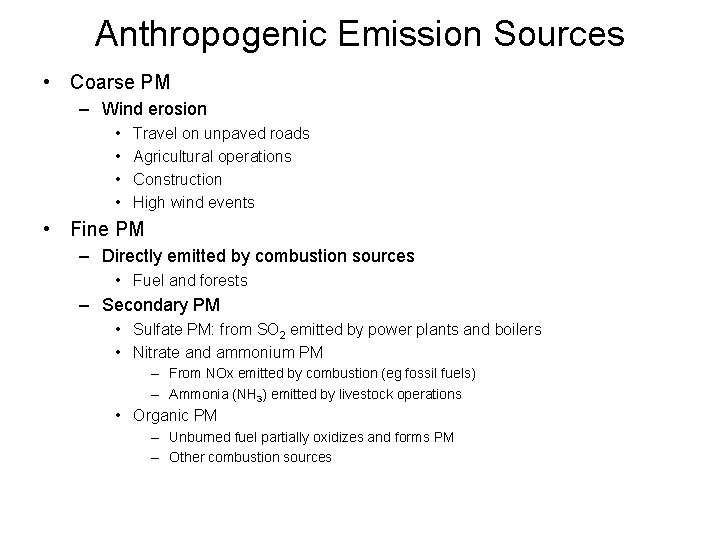
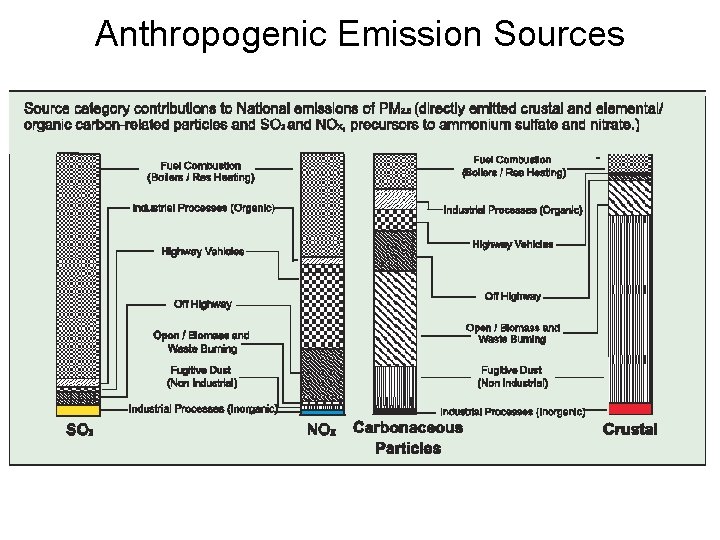
Anthropogenic Emission Sources • Coarse PM – Wind erosion • • Travel on unpaved roads Agricultural operations Construction High wind events • Fine PM – Directly emitted by combustion sources • Fuel and forests – Secondary PM • Sulfate PM: from SO 2 emitted by power plants and boilers • Nitrate and ammonium PM – From NOx emitted by combustion (eg fossil fuels) – Ammonia (NH 3) emitted by livestock operations • Organic PM – Unburned fuel partially oxidizes and forms PM – Other combustion sources
Anthropogenic Emission Sources
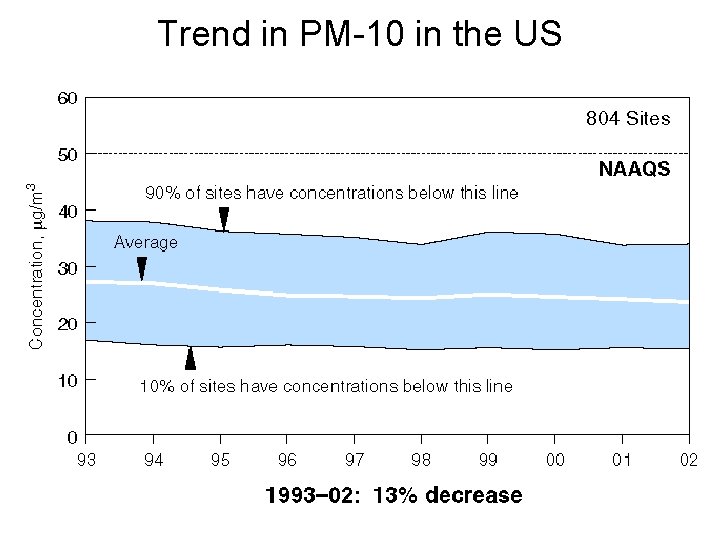
Trend in PM-10 in the US
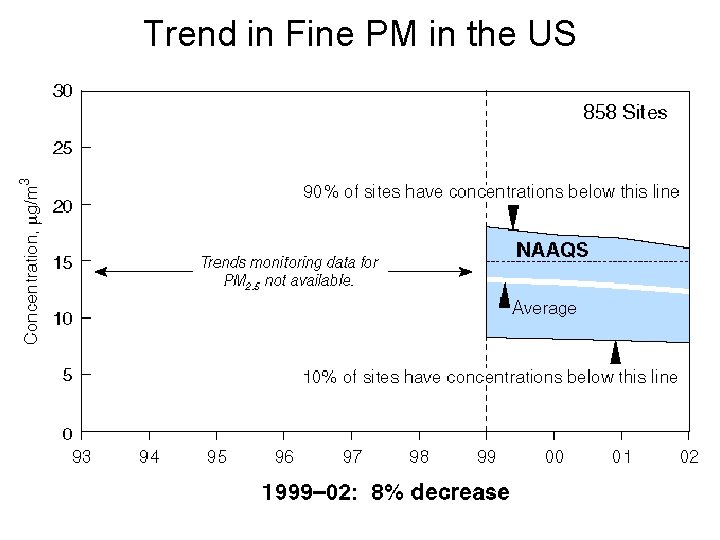
Trend in Fine PM in the US
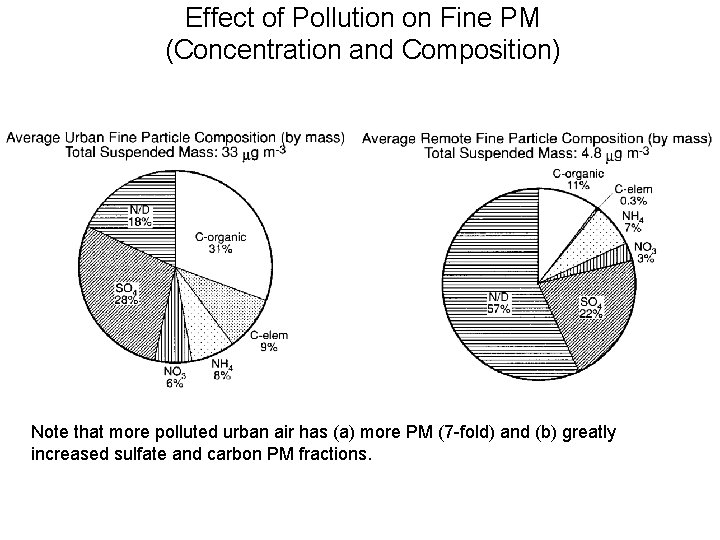
Effect of Pollution on Fine PM (Concentration and Composition) Note that more polluted urban air has (a) more PM (7 -fold) and (b) greatly increased sulfate and carbon PM fractions.
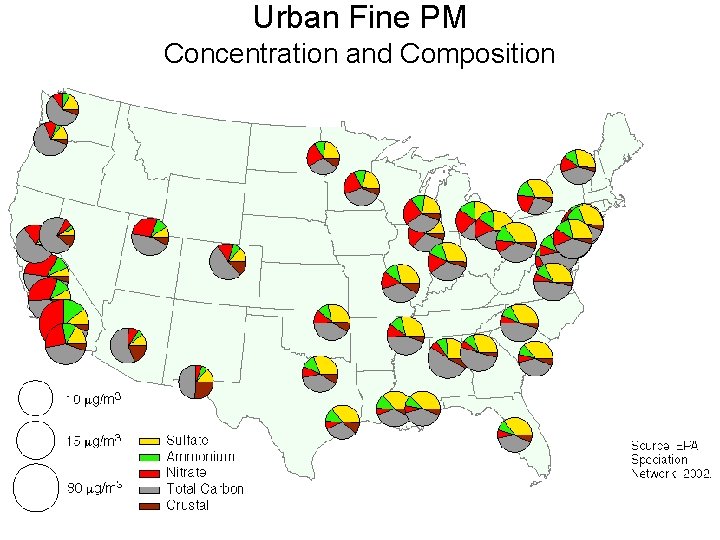
Urban Fine PM Concentration and Composition
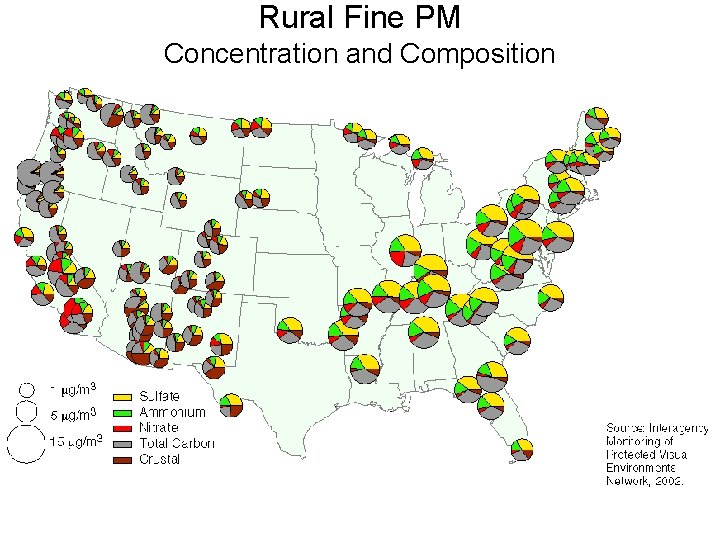
Rural Fine PM Concentration and Composition