Tropical Cyclones Caribbean Economics and Rethinking the Cost

Tropical Cyclones, Caribbean Economics and Rethinking the Cost of Climatic Change Solomon Hsiang Ph. D. student in Sustainable Development

NASA

Neumann


the question • How will climatic change affect Caribbean economies (through the mechanism of tropical cyclones)?
 changes in")
the result • History suggests that populations will adapt, coping with (small) changes in income and consumption following additional storm events by expanding government, leading to (large) reductions in consumption and income growth.

this talk • • prior work estimating historical storm incidence theoretical framework responses to events responses to risk comparison is the response dynamic? discussion

prior work

attribution & public literature • During 2005, the Jamaican economy recorded real Gross Domestic Product growth of an estimated 1. 4 per cent, however, the targets established under the Medium Term Socio-Economic Policy Framework were not fully realized. . During the year, growth performance was adversely impacted by a number of challenges, which included: -the residual impact of Hurricane Ivan; -drought conditions and bush fires during the first half of the year; -the impact of Hurricanes Dennis and Emily which caused damage to infrastructure and productive assets amounting to approximately $6. 0 billion; and -record high international crude oil prices. [Planning Institute of Jamaica, 2005]
 Hurricanes and development")
economic literature • • Economic damage (Nordhaus, Pielke et al. ) Hurricanes and development (Barker, Mulcahy) Income smoothing after storms (Bluedorn) Projecting long run influence on economic trajectories (Freeman) • Environment and indirect effect - Institutions (Acemoglu et al. )

climate change context Knutson & Tuleya, 2004 Emanuel, 2005

the “we’ll adapt” assumption “Adaptation to climate change has the potential to substantially reduce many of the adverse impacts of climate change and enhance beneficial impacts, though neither without cost nor without leaving residual damage. ” - IPCC, 2001, Working Group 2, Technical Summary

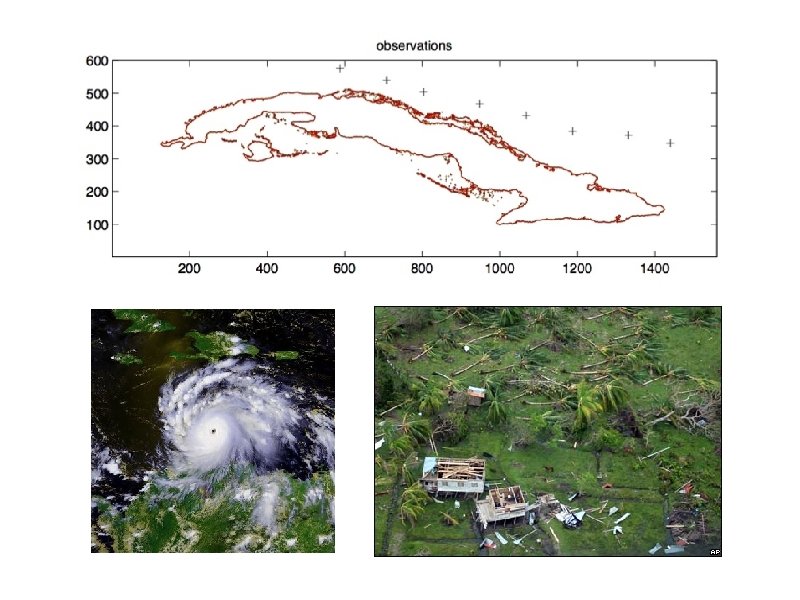
storm incidence Tartaglione et al. , Journal of Climate, 2003

estimating a storm incidence reconstruction
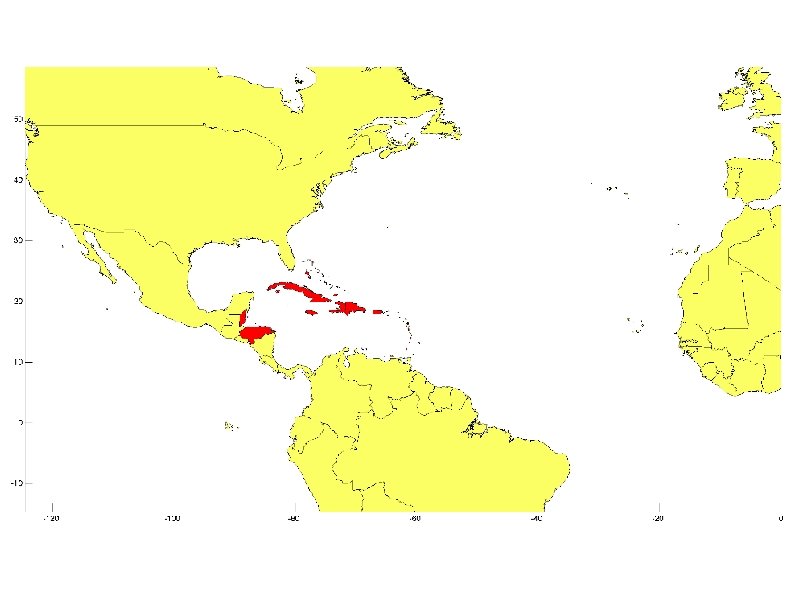

44 million people
")
(Suzana Camargo, IRI)

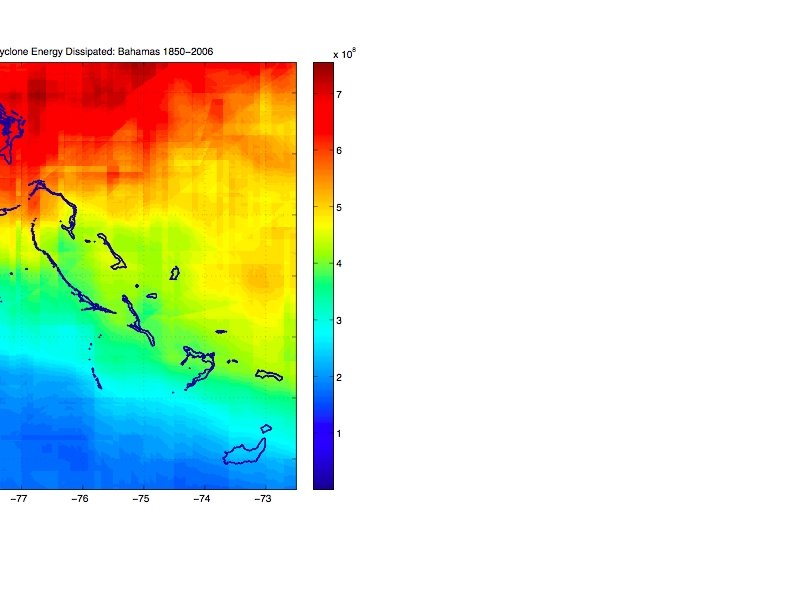
land surface data NOAA NGDC GLOBE Digital Elevation Model 1 km x 1 km resolution 44 km long St. Kitts and Nevis

RMW = a + b x Vmax + c x LAT (Kossin et al 2007)

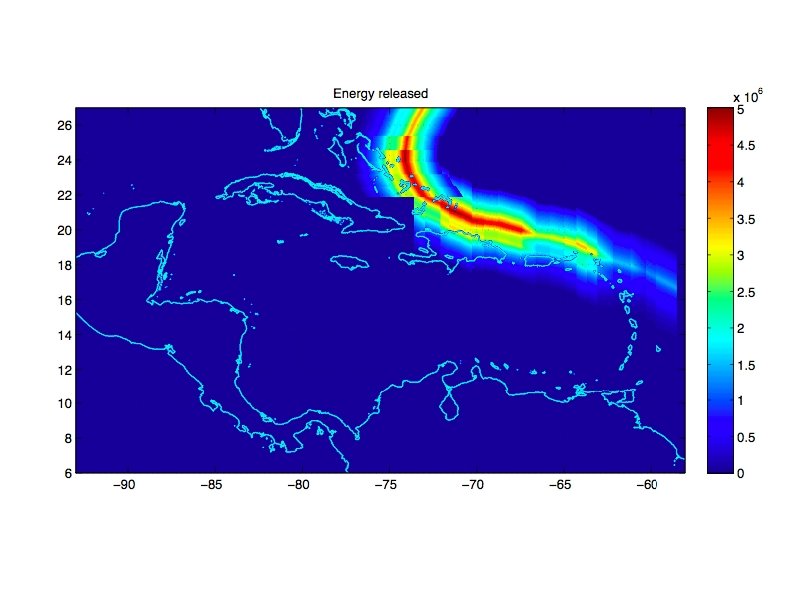
socially relevant storm incidence storm motion integrate storm measure 250 km distance at closest approach

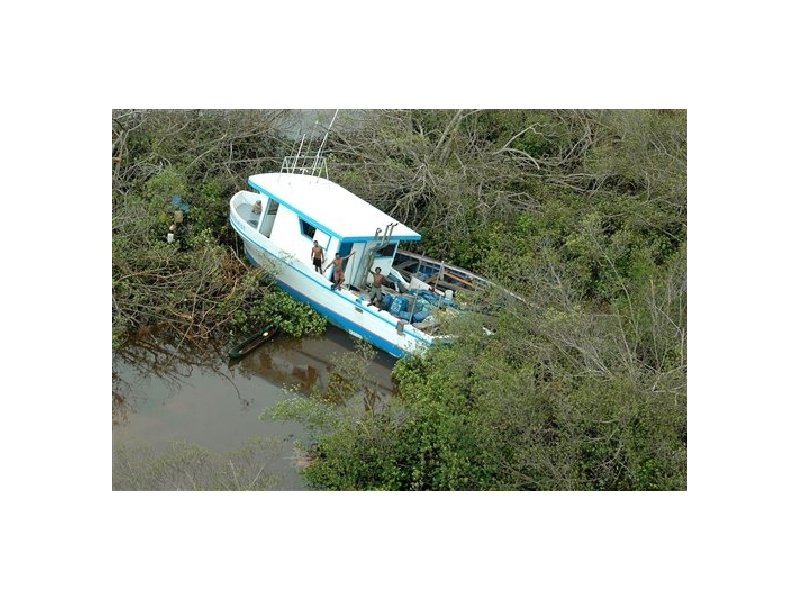
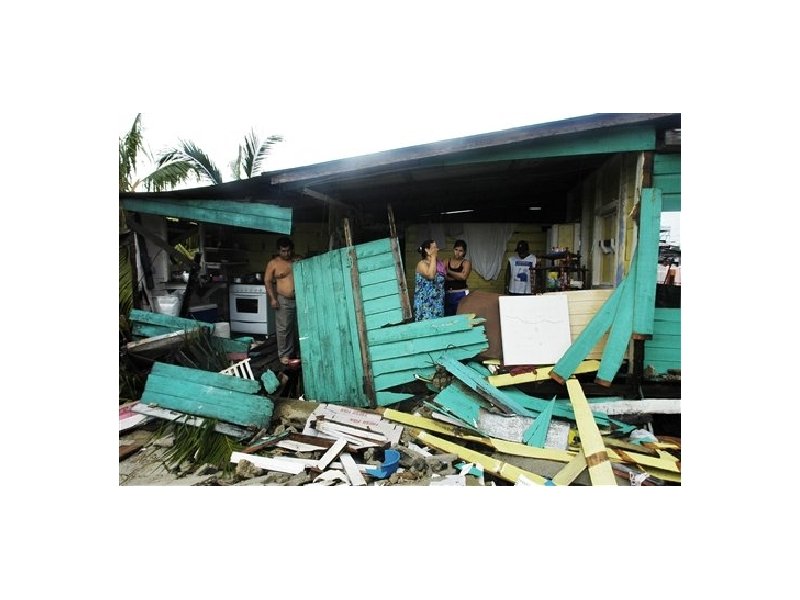
nice pictures. where’s the economics?
 • technical damages – the “event effect” – “technical adaptation” •")
defining terms X(t) • technical damages – the “event effect” – “technical adaptation” • behavioral damages – the “risk effect” – “behavioral adaptation” – eg. u(GPO) - u(Nash) X pdf(x) X

theoretical framework

example: biking in Boston and New York City • biking risk: get hit by a car • technical effect: hospitalization • technical adaptation: helmet • behavioral adaptation: bike less • behavioral effect: fewer bikers in NYC than Boston
 • current focus: events – cyclones, drought, floods, sea level rise,")
climate change X(t) • current focus: events – cyclones, drought, floods, sea level rise, etc. • is a change in the set of possible outcomes (and risk) X pdf( x | climate_1 ) pdf( x | climate_2 )
, consumption, investment, govt • • 1967")
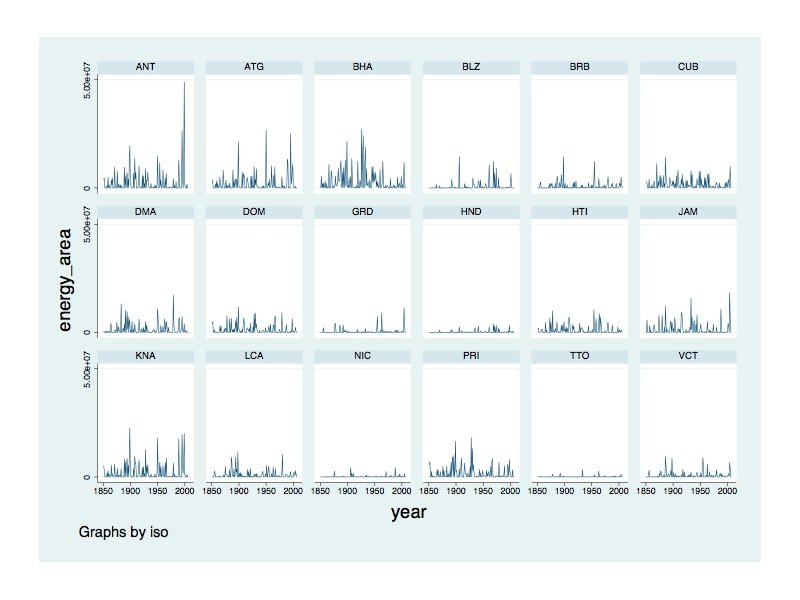
data • Penn World Tables – GDP (PPP/c), consumption, investment, govt • • 1967 - 2004 16 nations 44 M people Controls: – Precipitation, Surface Temperature – Year – Country fixed effects • Area, GDP in 1970, population
 of cyclones on")
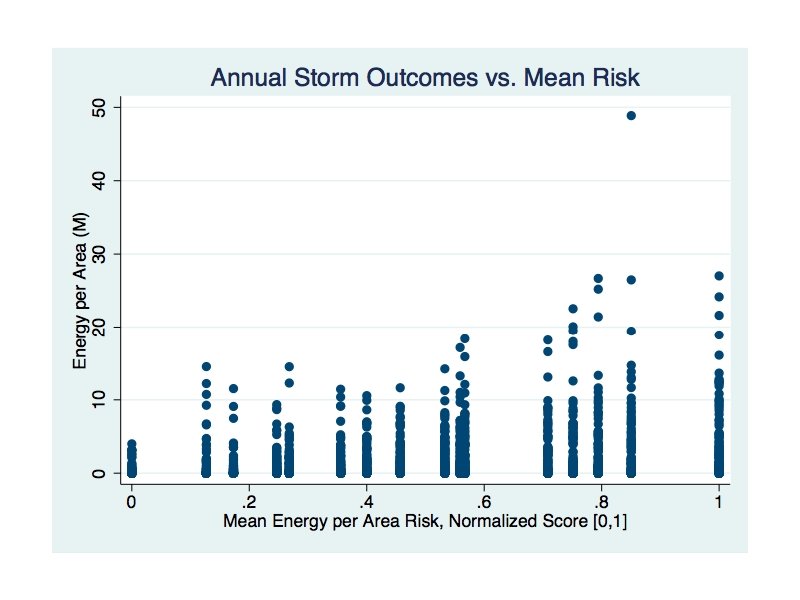
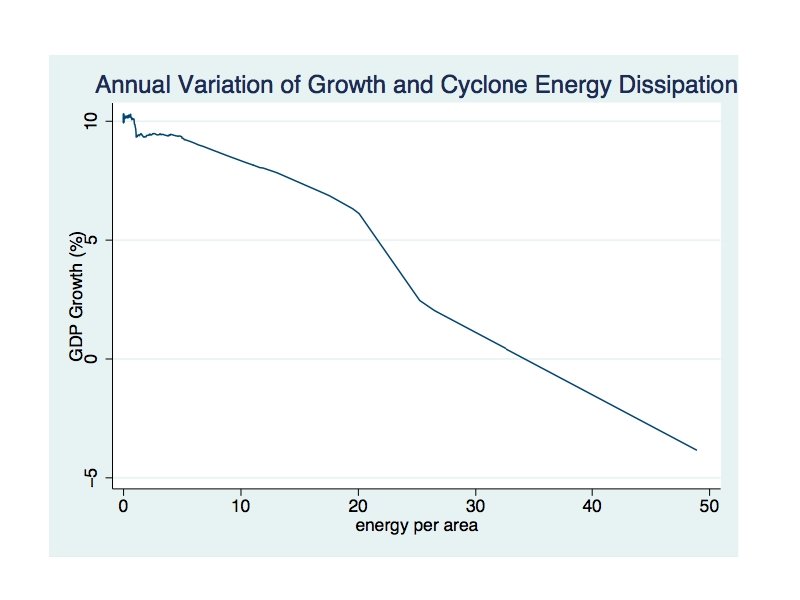
the simplest cut • is there any effect (event or risk) of cyclones on outcomes?

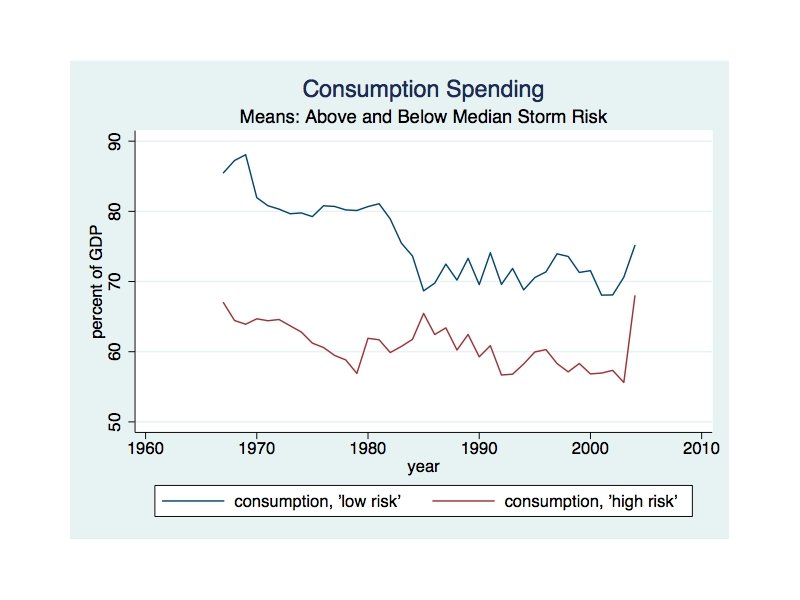
‘low risk’ ‘high risk’
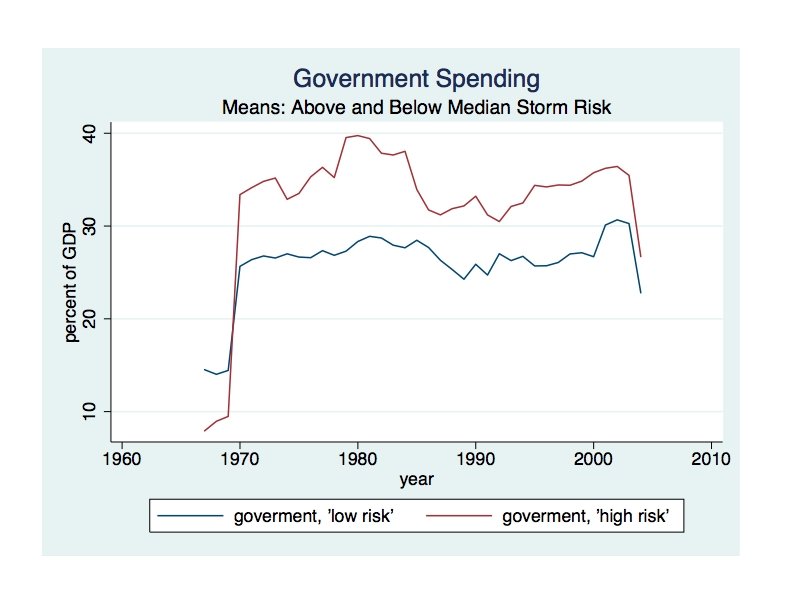
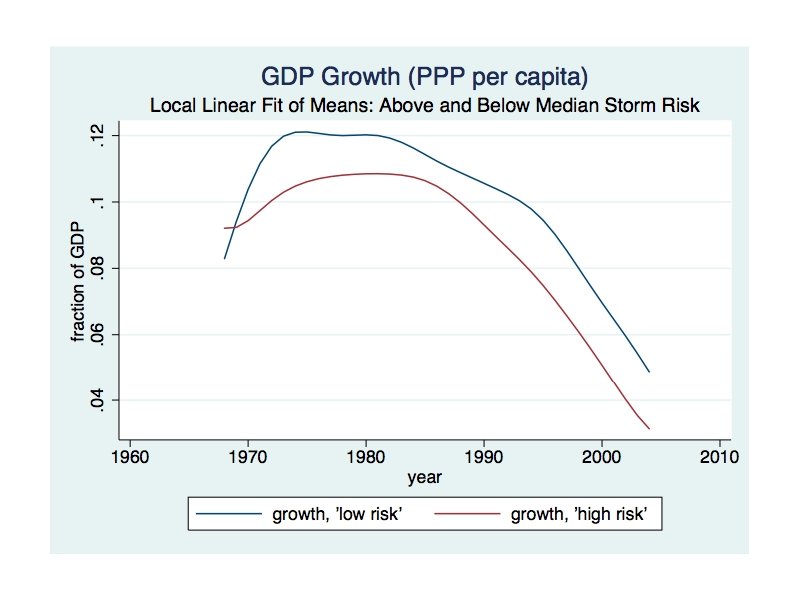

There is a clear effect, but cannot identify event from risk.

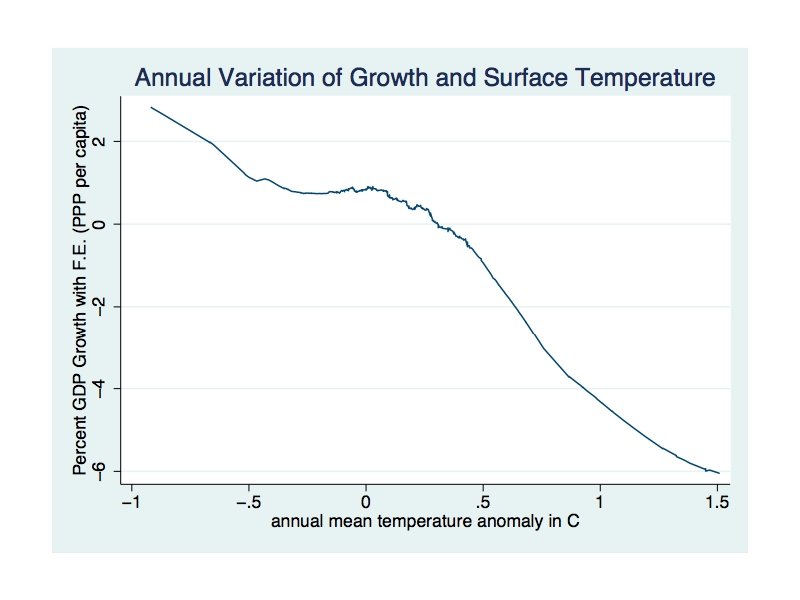
quick aside: short-run response to surface temperature events

the “event effect” & “technical adaptation”

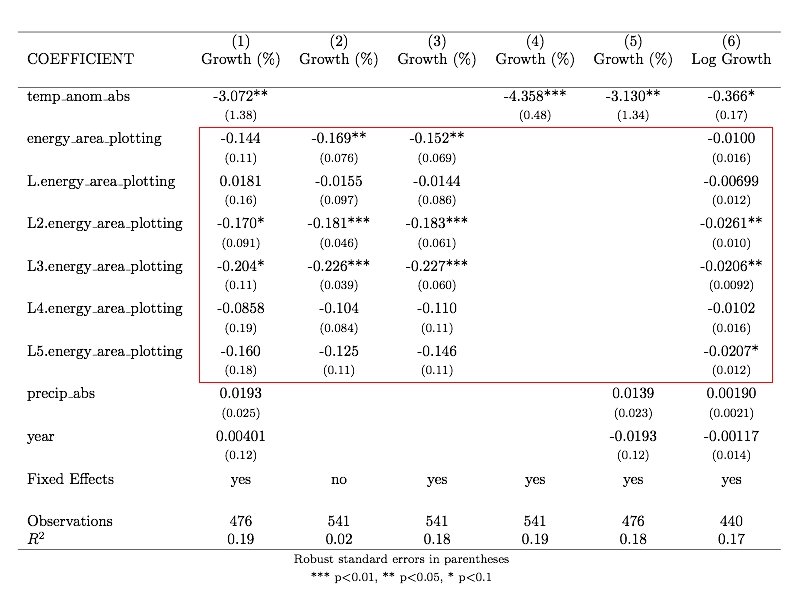
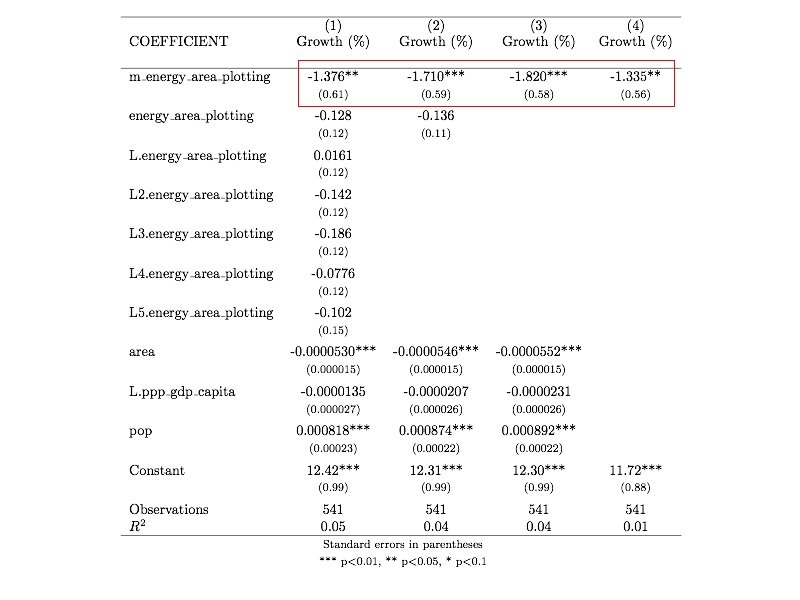
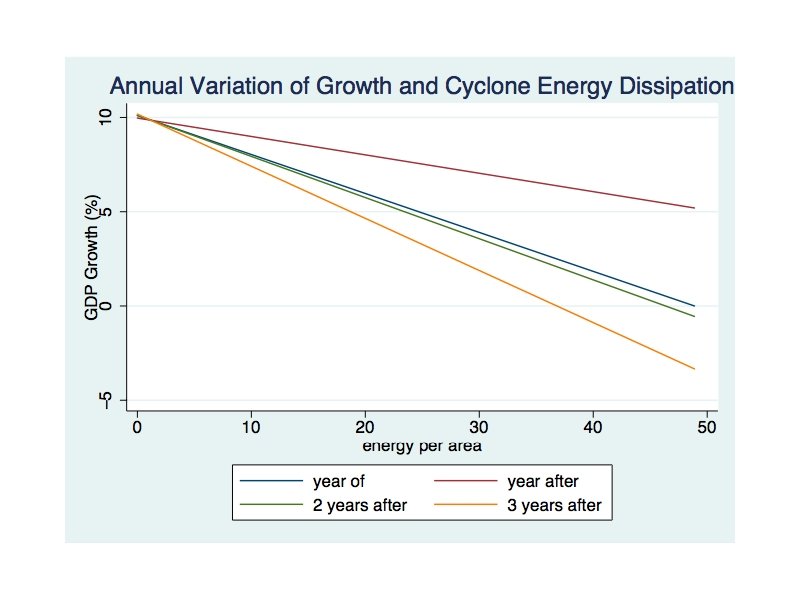
short-run response to tropical cyclone events
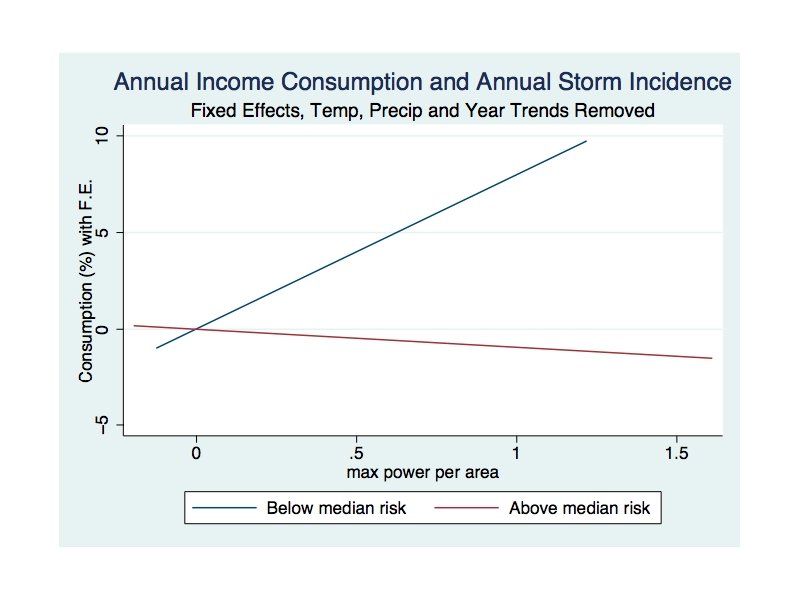

Income shocks and reallocation of consumption

No statistical evidence of successful technical adaptation!?

the “risk effect” & “behavioral adaptation”

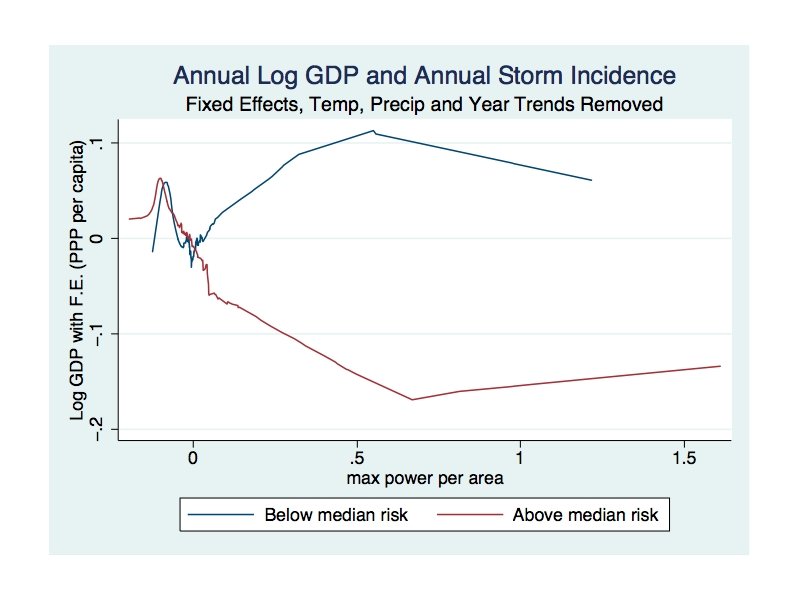
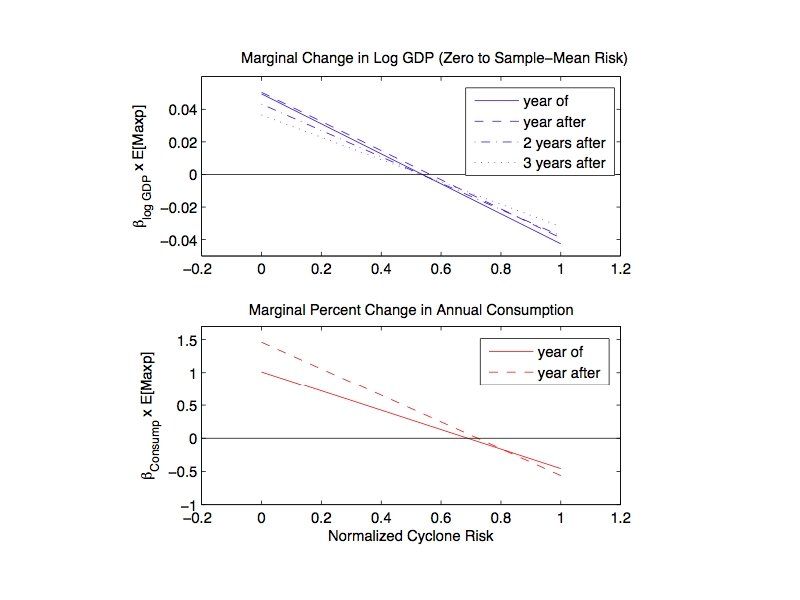
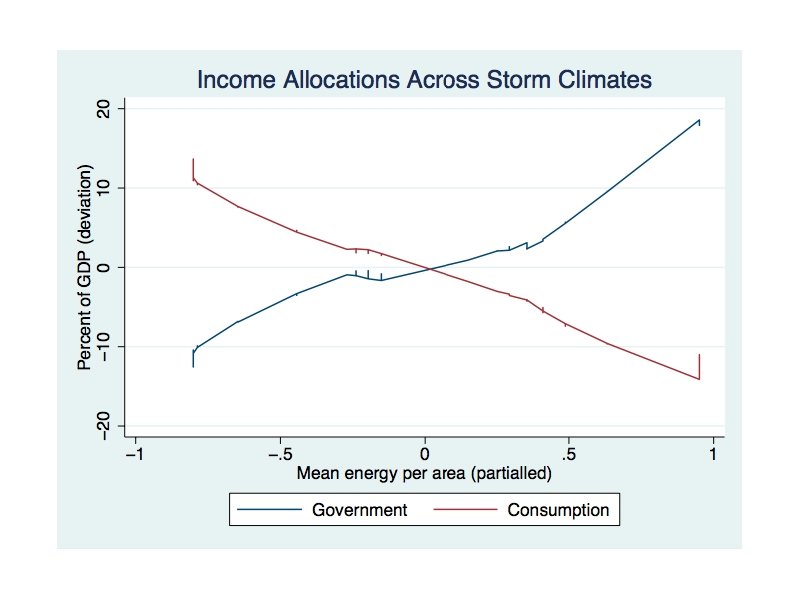
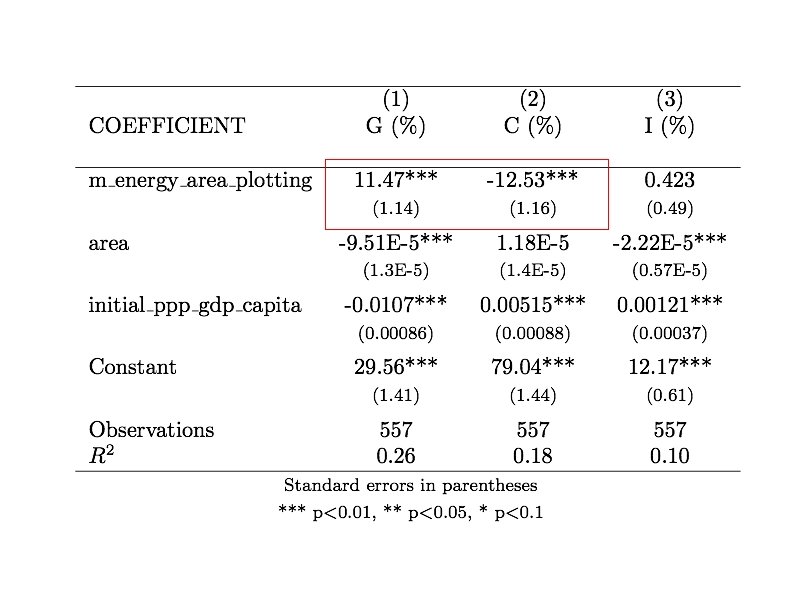
general equilibrium response to tropical cyclone risk

comparing the magnitudes: events vs risk
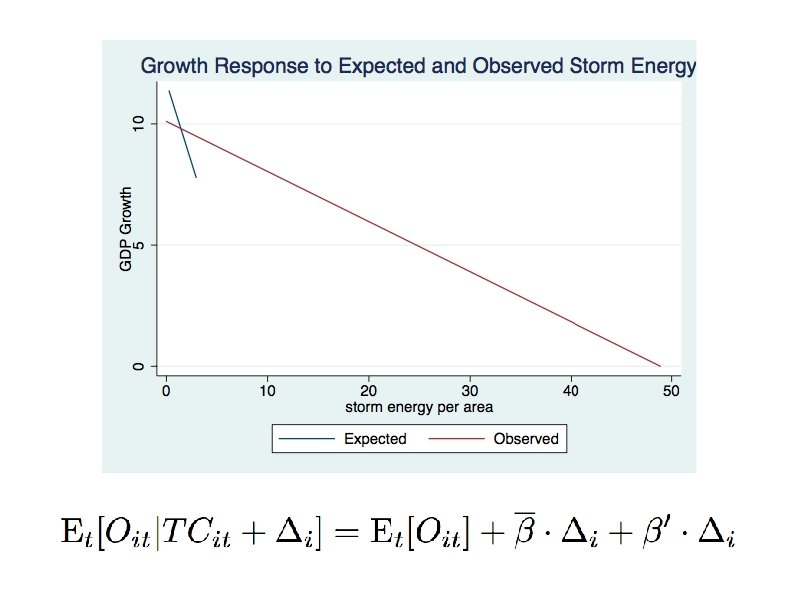

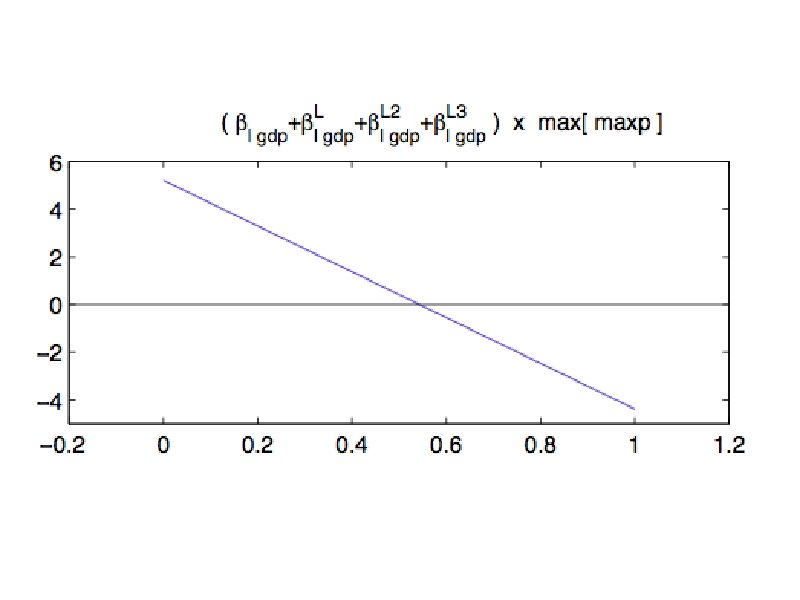
annual ATE annual

max of 2500 obs. annual

is the response dynamic? • Acemoglu et al: t = 0: environment produces institutions t > 0: institutions produce outcomes • Or dynamic adjustment? t > 0: environment to institutions to outcomes
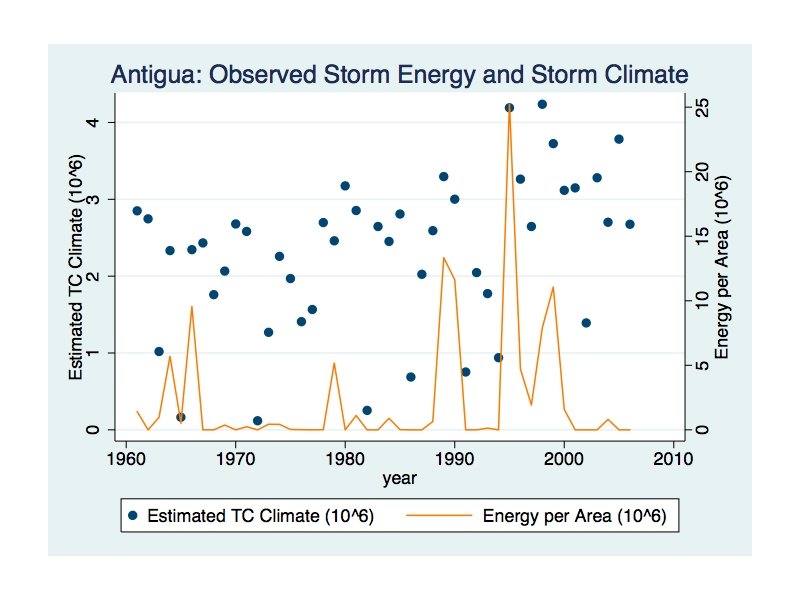
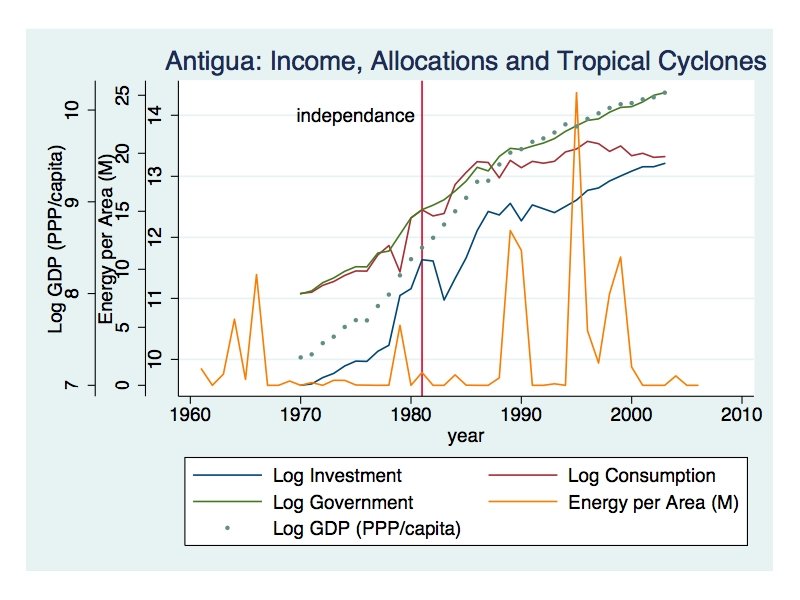

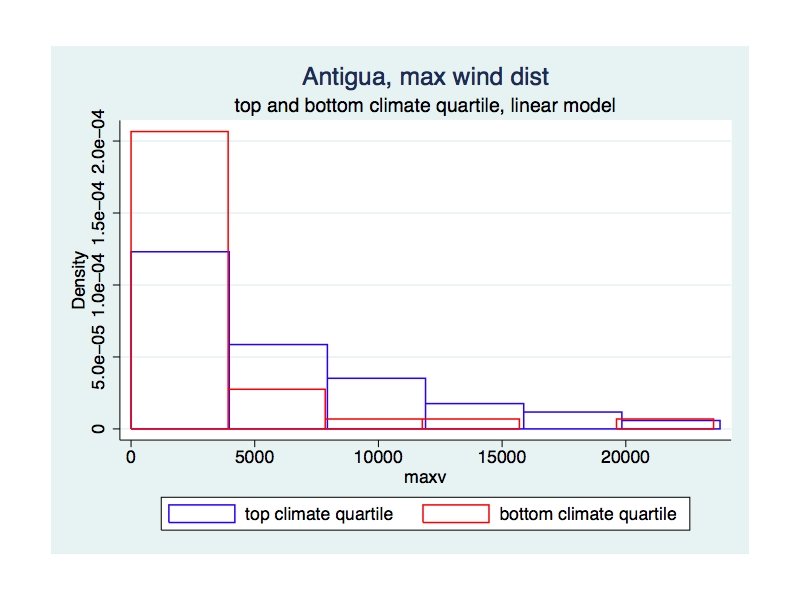
Antigua example

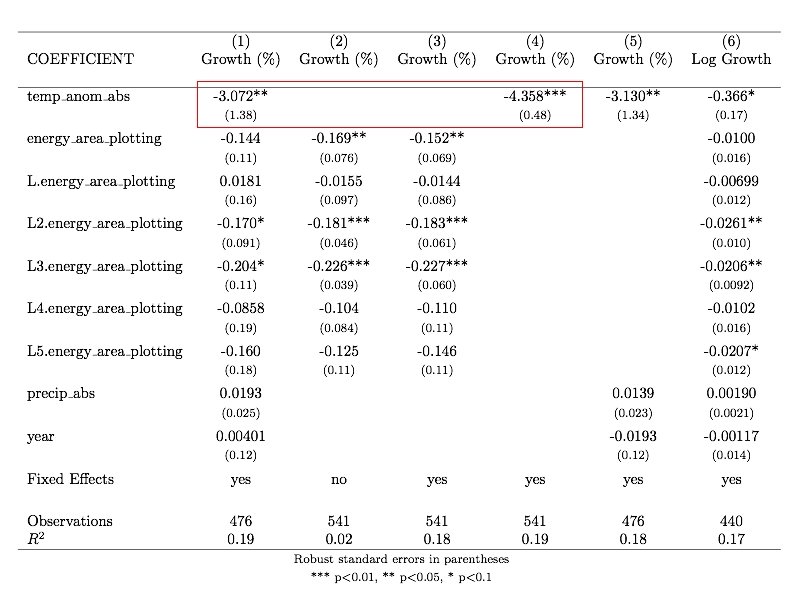
results • direct temp effect: +1 degree C = -3. 1 % growth • storm event effect: ATE = [-4, +4] % growth ATE = [-0. 5, +1. 5] % income consumption • storm risk effect: ATE = +16. 0 % government spending ATE = -17. 6 % income consumption ATE = -1. 9 % growth

possible stories • Durkheim’s “social effervescence” • liability transfer to government (requires good credit markets) • inefficient mechanisms for public good provision – risk in cooperation games • Mulcahy’s inequality and income transfers • high taxation and incentives to invest (low growth)

take home messages • no evidence of frequently cited “technical adaptation” • strong “behavioral adaptation” • a focus on observed “events” and damages underestimates the impact of climate (i. e. risk) change in general equilibrium by 1 -2 orders of magnitude

Thanks to Leigh Linden, Wolfram Schlenker, Jeffrey Sachs, Josh Graff Zivin, John Mutter, Bernard Salanie, Scott Barrett, Adam Sobel, Jennifer Hill, Wojciech Kopczuk, Bentley Mac. Leod, Kerry Emanuel, Mark Cane, Suzana Camargo, Alessandra Giannini, Jim Kossin, John Bluedorn, Dennis Shea, Ram Fishman, Jesse Antilla-Houghs, Tobias Sigfried, Matthew Notowidigdo and Adam Sachs; and NSF-IGERT and EPA-STAR for support.

extra slides

Radiation to space Storm Velocity Sun ‘Eye’ Earth’s rotation Prevailing winds Surface winds Main Development Region

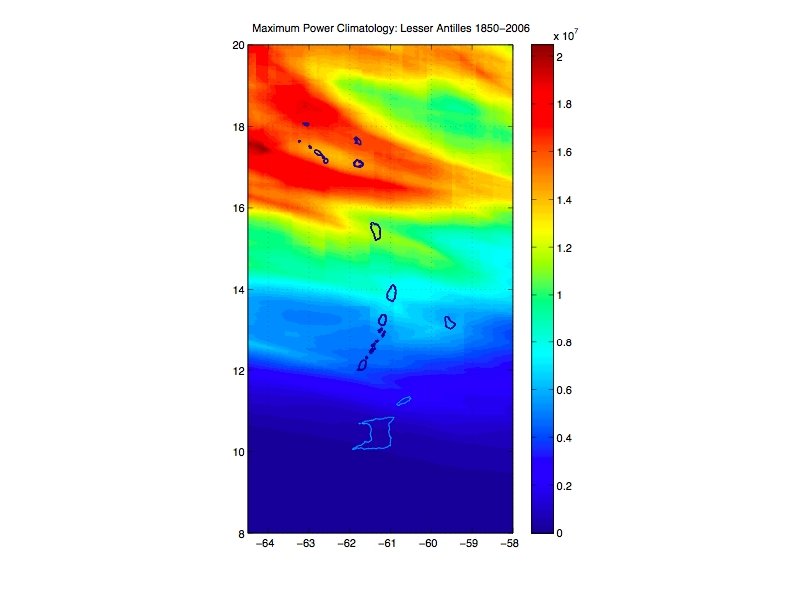
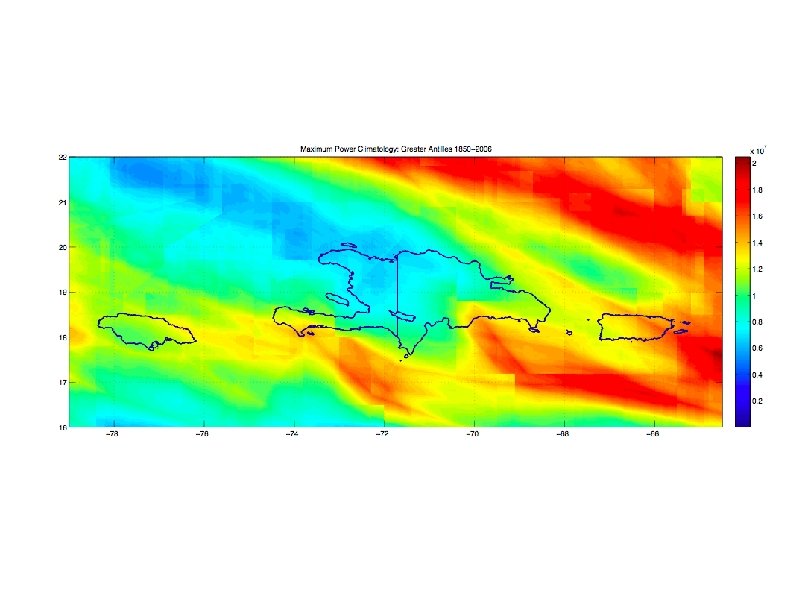
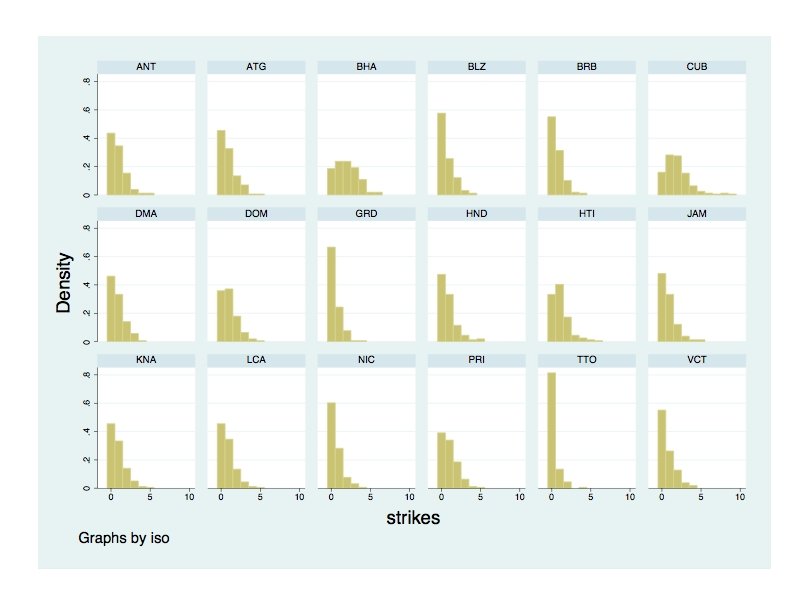
incidence measures

reducing attenuation bias Basin Energy count, energy storm Basin Storm Count

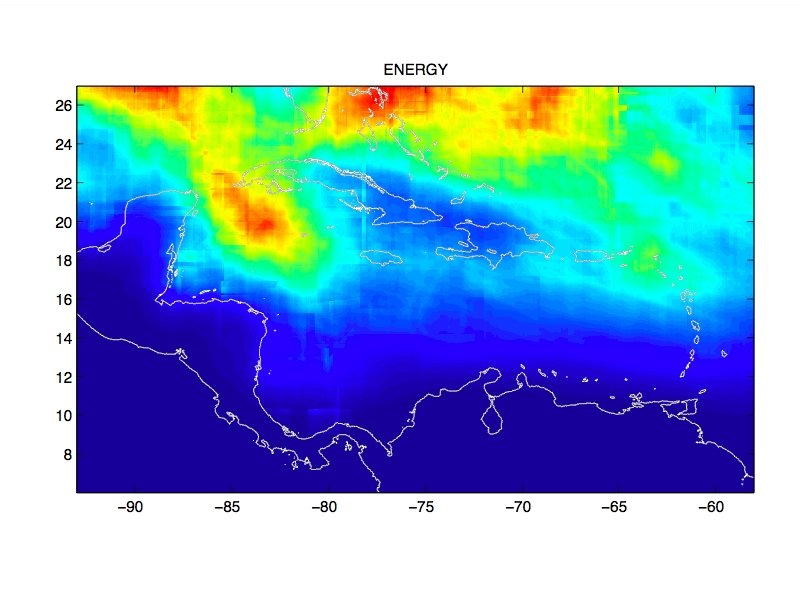
spatial sensitivity to climate

Basin Storm Count Basin Integrated Energy 10 x 10 km Point Energy

Sea Surface Temperature - NOAA NCDC ERSST v 2 Smith & Reynolds, 2004

El Nino Souther Oscillation - ENSO 3. 4 Kaplan et al. 1998, Reynolds et al. 2002

SST ENSO Total Basin Energy integrated energy = a + b x SST + c x ENSO 3. 4 + error OLS -2. 3210 e 6 tstat (-3. 2277)*** heteroskedastic spherical disturbance 0. 0892 e 6 (3. 4027)*** -0. 0478 e 6 (-4. 3322)*** GLM tstat gamma (exp) errors 0. 0769 e 6 (4. 0376)*** -0. 0433 e 6 (-5. 9367)*** -1. 9842 e 6 (-3. 8047)***

Point-wise regressions Energy = a + b x SST + c x ENSO

Energy = a + b x SST + c x ENSO b c

mean risk sensitivity to SST

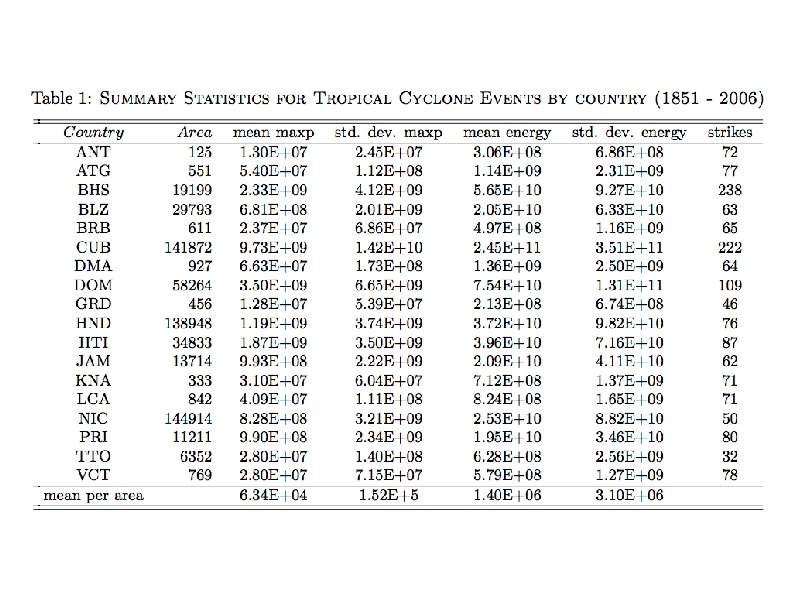
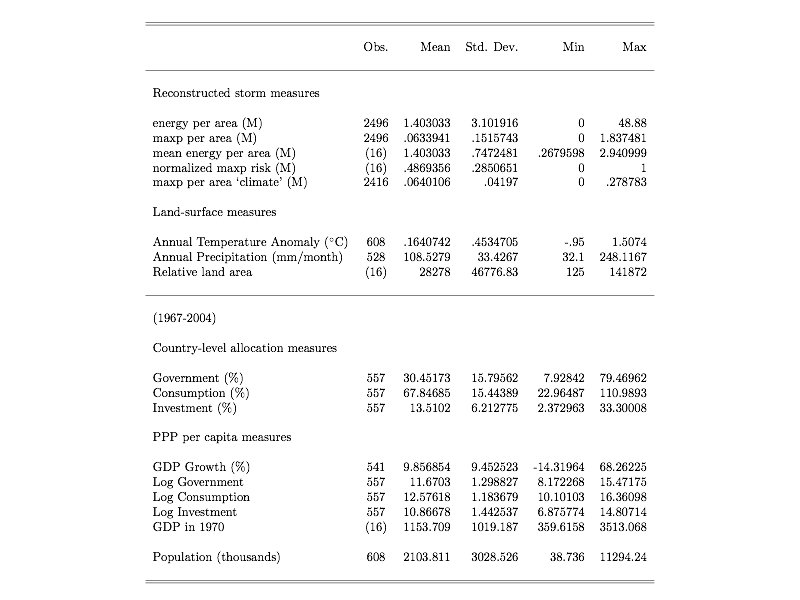
country summary stats
- Slides: 91