Tritt Elementary School A Data Overview Presented By

Tritt Elementary School A Data Overview Presented By Amy Crandall and Chastity Eggleston

Overview • The purpose of this presentation is to initiate discussion about how we can attain the goal of becoming a school of lifelong learners. • We will look at: – Demographic Data – CRCT the last three years • By looking at our school’s data, we can analyze our instructional practices to ensure equal learning opportunities.

Student Enrollment Kindergarten - 5 th Grade at Tritt Elementary from 2007 -2010 891 872 868 2007 -2008 -2009 -2010

Student Enrollment Over 3 Years At Tritt Elementary, Cobb County and The State of Georgia 600000 500000 400000 ts 300000 200000 100000 0 2007 -2008 Tritt ES 2008 -2009 2007 -2008 868 2009 -2010 2008 -2009 -2010 872 891 CCSD 106425 105956 106630 State of Georgia 494321 519528 519700

Percentage of Students Disaggregated by Race/Ethnicity The Last 3 Years 90% Percentage of Students 80% 70% 60% Tritt ES Cobb County State of GA 50% 40% 30% 20% 10% 0% Asian Black Hispanic White Multiracial

Percentage of Students Enrolled by Race/Ethnicity in 2009 -2010 Native American Multiracial State of GA White Cobb County Tritt ES Hispanic Black Asian 0% 10% 20% 30% 40% 50% 60% 70% 80% 90%

16% Percentage of Students Within Subgroups at Tritt Elementary 15% Percentage of Eligible Students 14% 13% 12% 10% 8% Students with disabilities 6% 6% Eligible for Free/Reduced meals 4% 2% English Language Learners 3% 3% 1% 1% 1% 2007 -2008 -2009 School Years 2009 -2010 0%

Demographic Observations • The student population at Tritt has not changed much over the last three years. • Compared to the county and state, Tritt’s data reveals that we do not have a racially diverse student population. • Our largest subgroup is students with disabilities.

The CRCT’s and Tritt • For the purpose of time, we will look at CRCT data for third grade only.

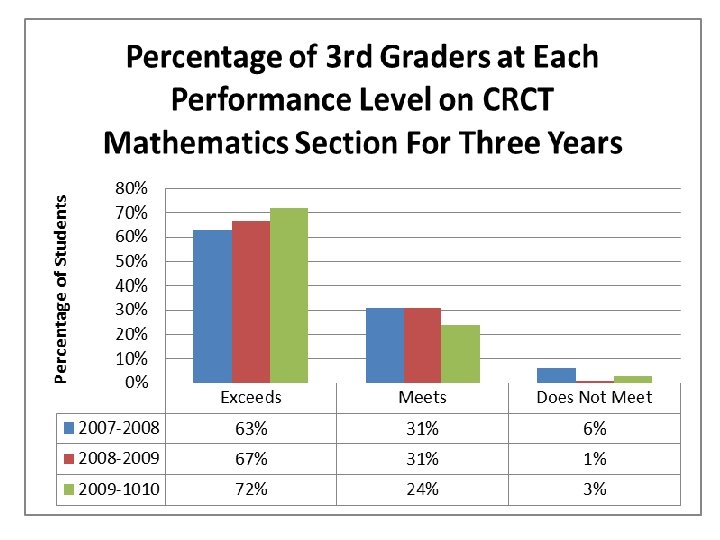
Percentage of Tritt 3 rd Graders at Each Performance Level on CRCTs Over Three Years Graphs provided by the Georgia Department of Education

Third Grade Performance on CRCTs The Last 3 Years • Looking at the general information, over 90% of our students have met or exceeded in performance levels on all content areas accessed. • In reading, 100% of students met or exceeded in performance. • In the area of mathematics our school will focus on data regarding students who scored Does Not Meet.
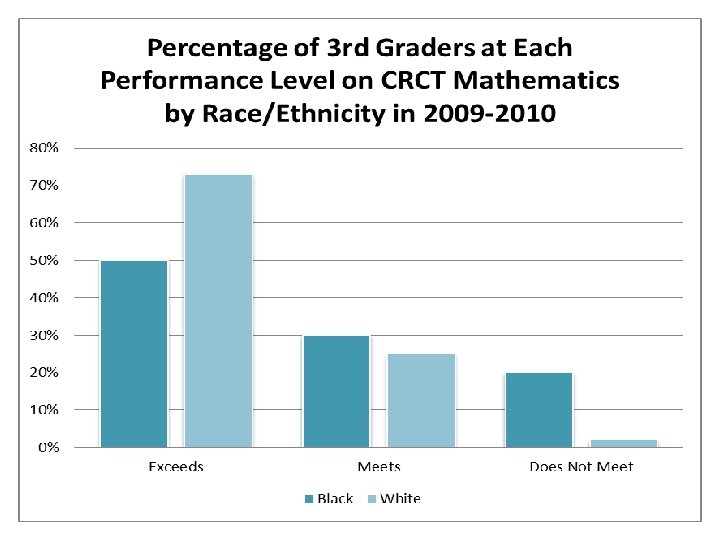
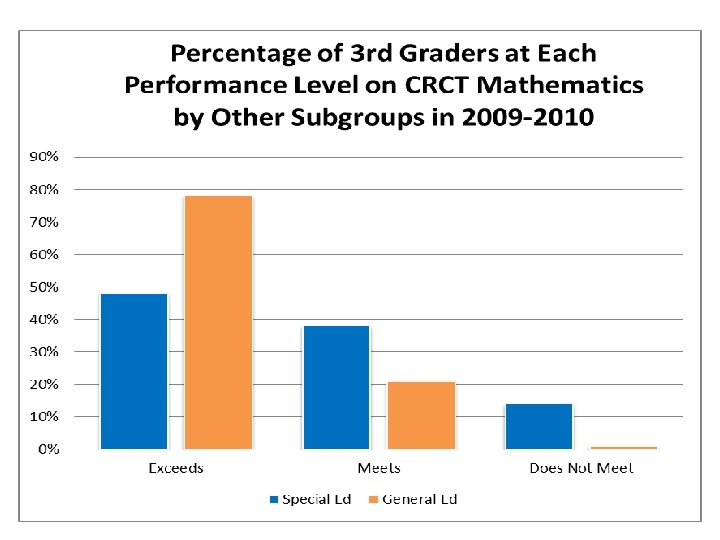
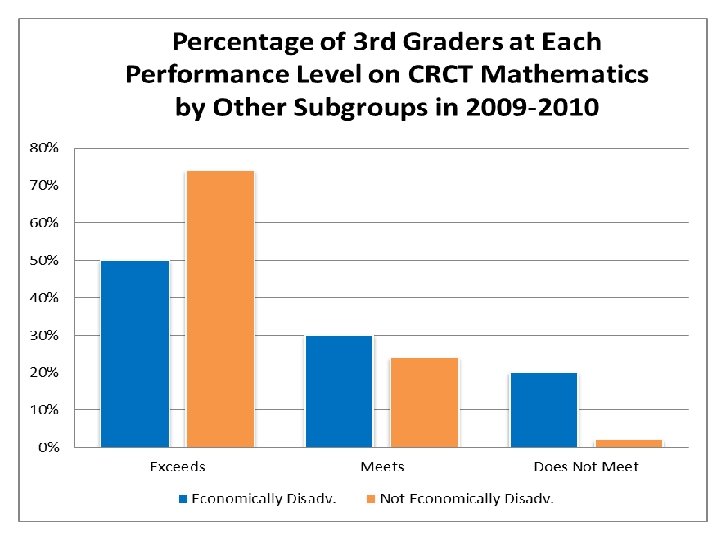

CRCT Mathematics Subgroup Summary • At least 75% of students in subgroups performed on Meets or Exceeds level • On the Does Not Meet level, there is a significant difference between subgroups compared.

Conclusion • 90% of Tritt Elementary students have performed on the Meets or Exceeds level in all content areas on the CRCT. • As a school we decided to focus on improving mathematics scores this year. • Using this data will be beneficial for us to achieve that goal: helping all of our students meet or exceed on the CRCT in mathematics.
- Slides: 17