TriState Seismic Hazard Mapping Kentucky Plan Zhenming Wang

 • Scenario")

 ~M 7.")
 Liquefaction Slope failure Primary: USGS maps Policy considerations:")
 De-amplification Amplification")


 New attenuations (USGS")
 –")

 d=30 (ft) Vs=500 (ft/s) d=70 (ft)")
")


- Slides: 21
Tri-State Seismic Hazard Mapping -Kentucky Plan Zhenming Wang Kentucky Geological Survey University of Kentucky http: //www. uky. edu/KGS/geologichazards/ February 23, 2006
Outline • Seismic Hazards – Primary Hazard – Ground Motion (on bedrock) • Scenario ground motion • USGS Hazard Maps (PSHA) – Secondary Hazard • Ground Motion Amplification (NEHRP Soil type) • Liquefaction • Induced slope instability • KGS Seismic Hazard Mapping – Kentucky Plan – Primary Hazard – Secondary Hazard
Seismic Hazard and Risk • Seismic hazard and risk are fundamentally different • Seismic Hazard – Natural phenomena generated by the earthquake, such as surface rupture, ground motion, ground-motion amplification, liquefaction, and induced-landslide that have potential to cause harm – Measurement: level of hazard and its recurrence interval • Seismic Risk (More Subjective) – likelihood (chance) of experiencing a level of seismic hazard for a given time exposure
Seismic and Hurricane Hazards and Risk New Madrid earthquake Event Hurricane (Katrina) ~M 7. 7 Size Category V ~500 τ (years) ~100? ~10% in 50 years Risk ~39% in 50 years PGA/MMI/PSA Hazard at a specific site Flood level/Wind speed $X Loss $Y Log-normal Uncertainty of measurement Normal/Log Pearson Only Seismic Hazards Are Considered by KGS
Ground Motion Secondary: Amplification (NEHRP soil) Liquefaction Slope failure Primary: USGS maps Policy considerations: IBC, IRC, and etc.
USGS Memphis Project (Cramer and others, 2006) De-amplification Amplification
Seismic Hazard Maps – KY Plan • Ground Motion Hazard Maps – Level of ground motion – How often it could occur – A set of scenario maps (ground motion vs. recurrence time) • Secondary Hazard Maps – Amplification map – Liquefaction potential map
Ground Motion Maps • Earthquake Sources – Faults – Occurrence frequency – Maximum magnitude • Ground Motion Attenuation • Methodology – PSHA – DSHA
Earthquake Sources 1. Where? 2. How Big? 3. How Often? Thousands years Historical Event: White County EQ? (~M 7. 5? , Mueller et al. , 2004) Paleo-liquefactions (Obermeier et al. ) 1993/1996 2005 Waverly 6. 8 6. 2 Vallonia 6. 9 6. 3 Skelton 7. 2 6. 7 Vincennes 7. 8 7. 3/7. 1
Ground Motion Attenuation M 8. 0 Conservative predictions (USGS WP, 2005) New attenuations (USGS WP, 2006)
Methodology • PSHA vs. DSHA – Same thing under certain conditions (Characteristic earthquake) – But different expressions = PGA maps with 5% PE in 50 years (Cramer et al. , 2006) The maps may good for NMSZ (AASHTO , KGS, and others) But good for the Tri-State Area?
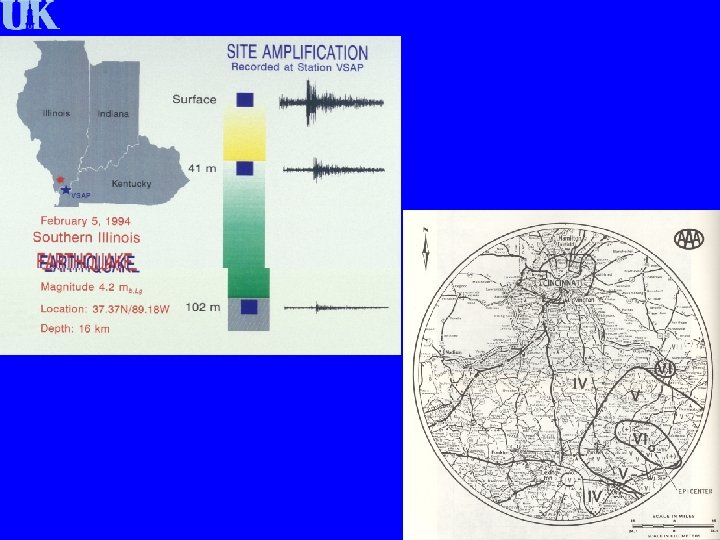
Ground Motion Amplification • Directly - Vertical Strong Motion Stations - H/V spectral ratios (e. g. earthquakes and ambient noise) • Theoretical Modeling - Response based on amplification thru the Vs gradient of the soils/ sediments (e. g. , SHAKE, etc. ) • Empirical - NEHRP Soil Classification
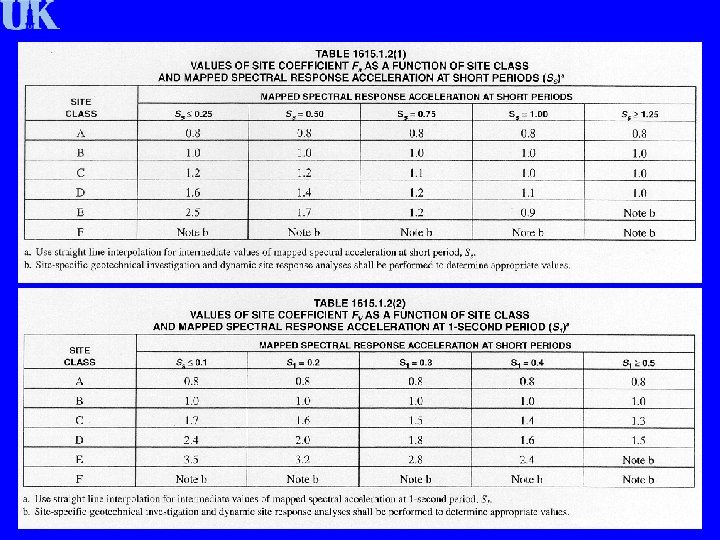
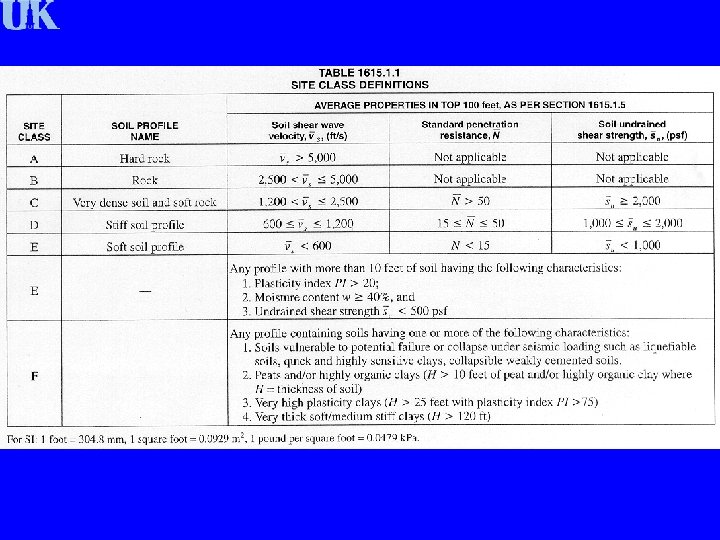
Example 1 Example 2 Average Equation Vs=500 (ft/s) d=30 (ft) Vs=500 (ft/s) d=70 (ft) Vs=1000 (ft/s) d=40 (ft) Vs=1500 (ft/s) d=50 (ft) Vs=4000 (ft/s) (bedrock) 100/(70/500+30/4000)=678 (ft/s) => D (600 - 1200 ft/s) 100/(30/500+40/1000+30/1500)=833 (ft/s) => D (600 - 1200 ft/s) Notes: 1) based on CA geology: bedrock Vs~2, 500 ft/s (B/C boundary) 2) in CUS, bedrock Vs >2, 500 ft/s (A or B), applicable (? )
C C D (Street et al. , 1997, Engineering Geology, 46: 331 -347)
Table 3. Estimated Susceptibility of Continental Deposits to Liquefaction (modified from Youd and Perkins, 1978). Type of deposit Step 1. Likelihood that Cohesionless Sediments, When Saturated, Would Be Susceptible to Liquefaction (by Age of Deposit) <500 yr Holocene Pleistocene Pre. Pleistocene River channel Very high High Low Very low Flood Plain High Moderate Low Very low Alluvial fan and Plain Moderate Low Very low Lacustrine and playa High Moderate Low Very low Colluvium High Moderate Low Very low Talus Low Very low Tuff Low Very low Residual soils Low Very low Step 2. Further analysis based on: SPT, CPT, Vs values and INPUT MOTION
Louisville Liquefaction Potential Map
Summary • KGS will produce following maps for KY – Ground Motion Hazard Maps • A set of scenario maps (ground motion level vs. recurrence time) – Secondary Hazard Maps • Amplification maps (associated with the scenario maps) • Liquefaction potential maps (associated with the scenario maps) • All data will be available after completion of the maps
Thank You