Trichomes and Statistics 2014 Free Response Question Why


- Slides: 19
Trichomes and Statistics 2014 Free Response Question
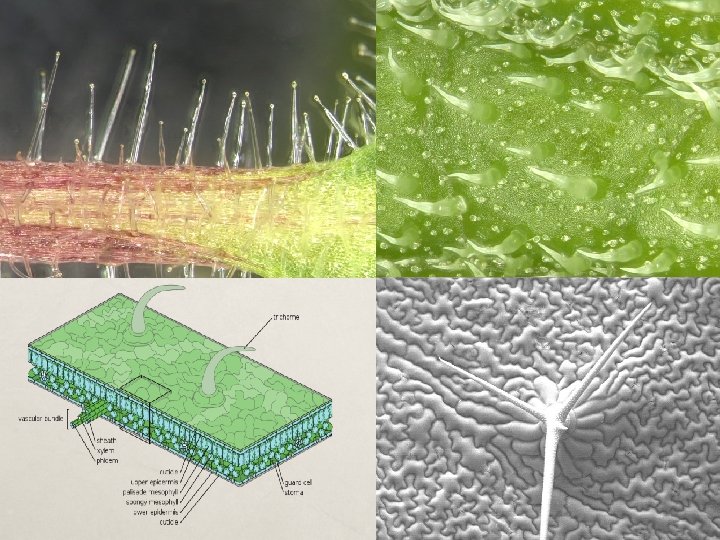
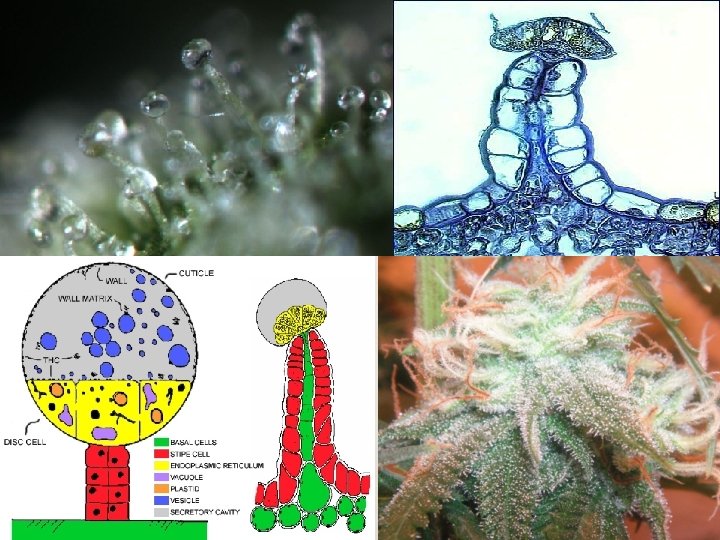
Why do plants have trichomes?
The Basics Word/Symbols/Formulas Population Mean Standard Deviation Variance SEM 95%CI n s s 2 2
Population Rarely are we talking about an entire population. That would be impossible to have seen and tested every individual of anything. Samples population – those that are being observed, tested, or studied.
Mean – the average Population I Plant 1 8 Plant 2 11 Plant 3 9 Plant 4 10 Plant 5 8 Plant 6 6
Standard Deviation How much are the values away from mean? How much are they spread out? What’s the average away from the average?
Find , s and 2 s
Find s n=5 n-1 = 4 108, 520 4 X 600 -394 = 206 470 -394 = 76 170 -394 = -224 430 -394 = 36 300 -394 = -94 (206)2 (76)2 (-224)2 (36)2 (-94)2 42, 436 5, 776 50, 176 1, 296 8836 108, 520 27, 130 S = 164. 7
2 Variance s The average distance away from the average squared 164. 7 x 164. 7 = 27, 126 mm
164. 7 5 2. 24 73. 52
95% Confidence Intervals 95% Confident the true mean of the population is between + or – 2 SD
Now let’s put all of this into practice.
So question 1, part A is asking us to create a graph. It has to be labeled. It Has to have the sample means of 3 populations. It also has to have error bars. I know this because it is telling me to illustrate at 95% so I know +or-2
What kind of graph do we need?
trichomes/cm 2 Trichome Density in Three Populations Population II Population
1 2 3 45 6 7 8 9 1011121314 trichomes/cm 2 Trichome Density in Three Populations Population III
The question wants us to describe the following if we were testing if the number of trichomes increased if we have herbivores around. Independent = Dependent = Control = Identify durations: more than one generation was correct answer Prediction: What would happen to trichome density in relationship to what happened in the control?