
Trends in world wheat production A roadmap to



- Slides: 30
Trends in world wheat production - A roadmap to India for feeding the population by 2050 International Wheat Conference | September 20 -25, 2015 | Sydney, AUSTRALIA Sendhil Ramadas, Ravish Chatrath and Indu Sharma ICAR-Indian Institute of Wheat and Barley Research, Karnal | INDIA (erstwhile Directorate of Wheat Research)
Presentation Outline… Prologue Data and Methodology Salient Findings and Roadmap for Food Security Conclusions and Policy Implications
e u g o l o Pr
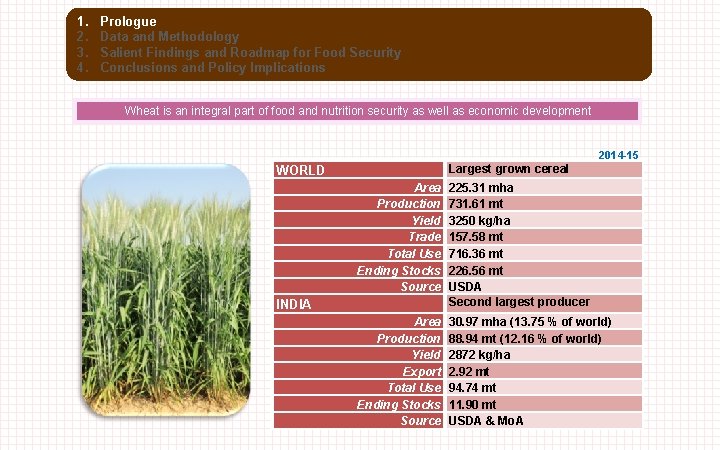
1. 2. 3. 4. Prologue Data and Methodology Salient Findings and Roadmap for Food Security Conclusions and Policy Implications Wheat is an integral part of food and nutrition security as well as economic development 2014 -15 Largest grown cereal WORLD Area Production Yield Trade Total Use Ending Stocks Source 225. 31 mha 731. 61 mt 3250 kg/ha 157. 58 mt 716. 36 mt 226. 56 mt USDA Second largest producer Area Production Yield Export Total Use Ending Stocks Source 30. 97 mha (13. 75 % of world) 88. 94 mt (12. 16 % of world) 2872 kg/ha 2. 92 mt 94. 74 mt 11. 90 mt USDA & Mo. A INDIA
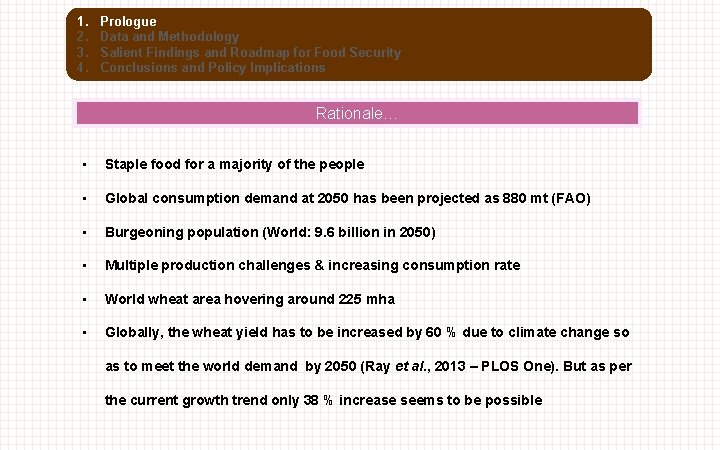
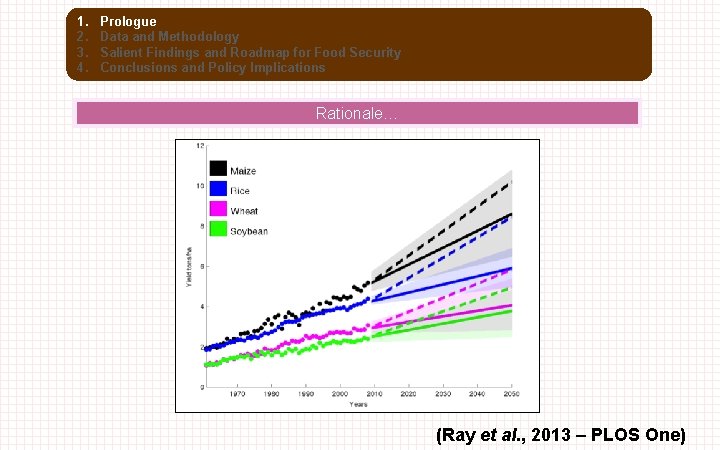
1. 2. 3. 4. Prologue Data and Methodology Salient Findings and Roadmap for Food Security Conclusions and Policy Implications Rationale… • Staple food for a majority of the people • Global consumption demand at 2050 has been projected as 880 mt (FAO) • Burgeoning population (World: 9. 6 billion in 2050) • Multiple production challenges & increasing consumption rate • World wheat area hovering around 225 mha • Globally, the wheat yield has to be increased by 60 % due to climate change so as to meet the world demand by 2050 (Ray et al. , 2013 – PLOS One). But as per the current growth trend only 38 % increase seems to be possible
1. 2. 3. 4. Prologue Data and Methodology Salient Findings and Roadmap for Food Security Conclusions and Policy Implications Rationale… (Ray et al. , 2013 – PLOS One)
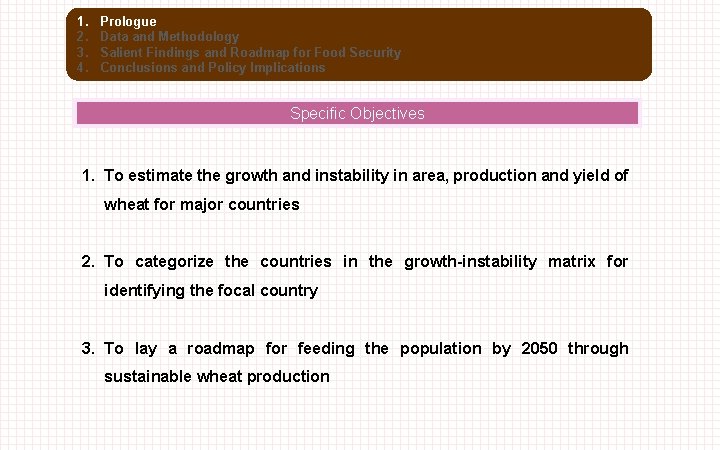
1. 2. 3. 4. Prologue Data and Methodology Salient Findings and Roadmap for Food Security Conclusions and Policy Implications Specific Objectives 1. To estimate the growth and instability in area, production and yield of wheat for major countries 2. To categorize the countries in the growth-instability matrix for identifying the focal country 3. To lay a roadmap for feeding the population by 2050 through sustainable wheat production
y g o l o d o h t e a t a D M d an
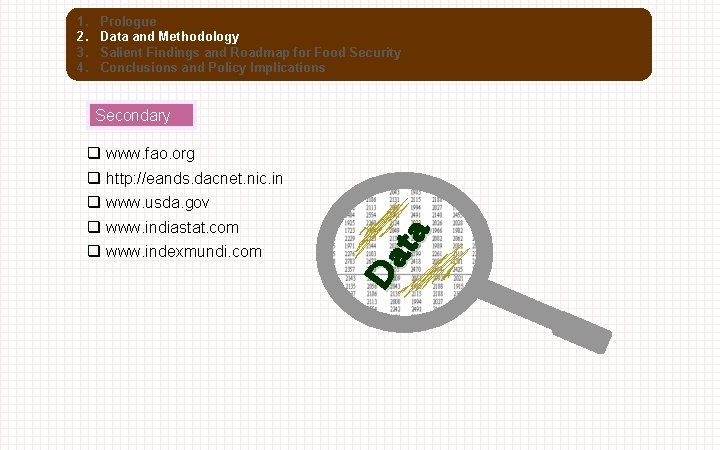
1. 2. 3. 4. Prologue Data and Methodology Salient Findings and Roadmap for Food Security Conclusions and Policy Implications q www. fao. org q http: //eands. dacnet. nic. in q www. usda. gov q www. indiastat. com q www. indexmundi. com Da ta Secondary
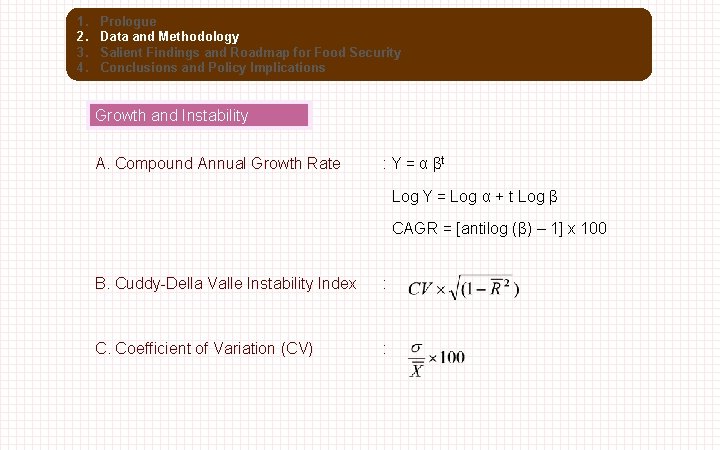
1. 2. 3. 4. Prologue Data and Methodology Salient Findings and Roadmap for Food Security Conclusions and Policy Implications Growth and Instability A. Compound Annual Growth Rate : Y = α βt Log Y = Log α + t Log β CAGR = [antilog (β) – 1] x 100 B. Cuddy-Della Valle Instability Index : C. Coefficient of Variation (CV) :
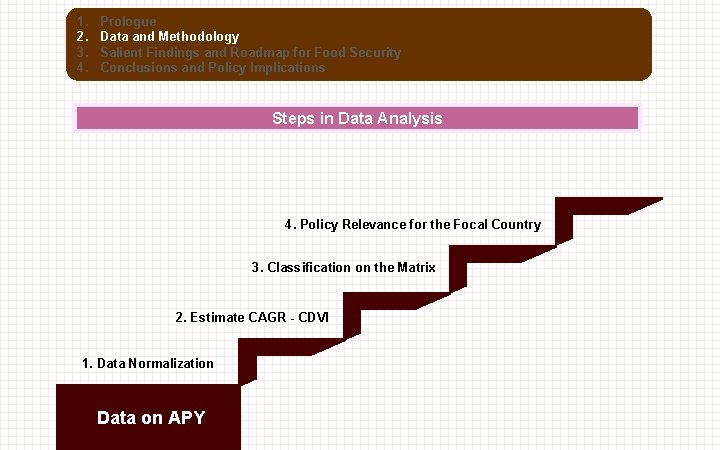
1. 2. 3. 4. Prologue Data and Methodology Salient Findings and Roadmap for Food Security Conclusions and Policy Implications Steps in Data Analysis 4. Policy Relevance for the Focal Country 3. Classification on the Matrix 2. Estimate CAGR - CDVI 1. Data Normalization Data on APY
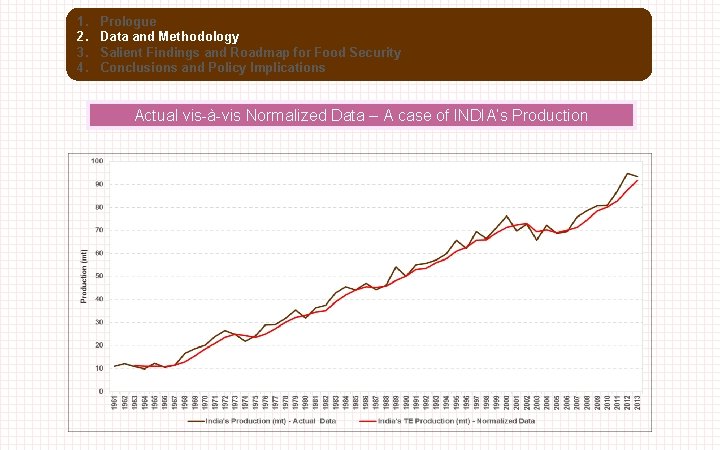
1. 2. 3. 4. Prologue Data and Methodology Salient Findings and Roadmap for Food Security Conclusions and Policy Implications Actual vis-à-vis Normalized Data – A case of INDIA’s Production
d n a y s t i g r n i u d c e n i S F t d n o e o i l F Sa p for a m d a o R
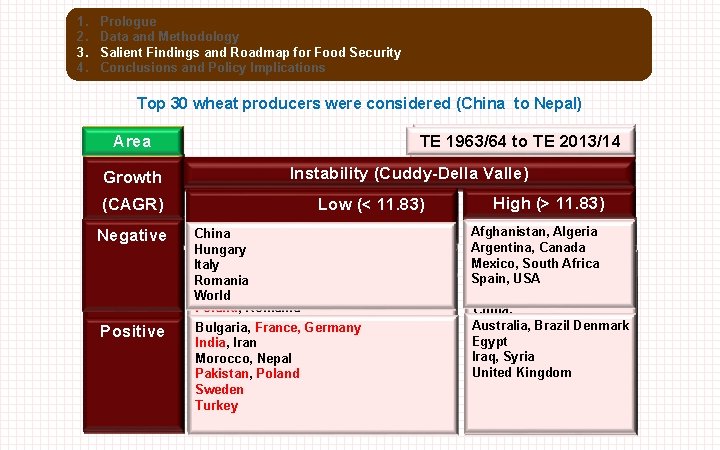
1. 2. 3. 4. Prologue Data and Methodology Salient Findings and Roadmap for Food Security Conclusions and Policy Implications Top 30 wheat producers were considered (China to Nepal) Area Productio Yield n Growth (CAGR) Negative Positive TE 1963/64 to to TE TE 2013/14 TE TE 1963/64 to TE 2013/14 Instability (Cuddy-Della Valle) High (> (> 11. 83) 16. 13) Low (< (< 11. 83) 16. 13) High 10. 57) Low 10. 57) Italy China -Hungary Canada, France, Germany Italy India, Iran Romania Canada, China Nepal, Pakistan World Denmark, Egypt Poland, Romania France, Germany Spain, Sweden Bulgaria, France, Germany India Turkey India, Iran Italy, Mexico USA Morocco, Nepal Pakistan, Poland World Pakistan, Poland Spain, Sweden Turkey, United Kingdom Turkey USA, World Afghanistan, Algeria --Argentina, Canada Afghanistan, Mexico, South. Algeria Africa Argentina, Spain, USAAustralia Afghanistan, Algeria Brazil, Bulgaria Australia, Brazil China, Bulgaria, Denmark, Hungary Egypt Denmark Australia, Brazil Iran, Iraq Hungary, Iraq Egypt Morocco, Mexico Iraq, Syria. Nepal Romania Morocco United Kingdom South Africa Syria United Kingdom
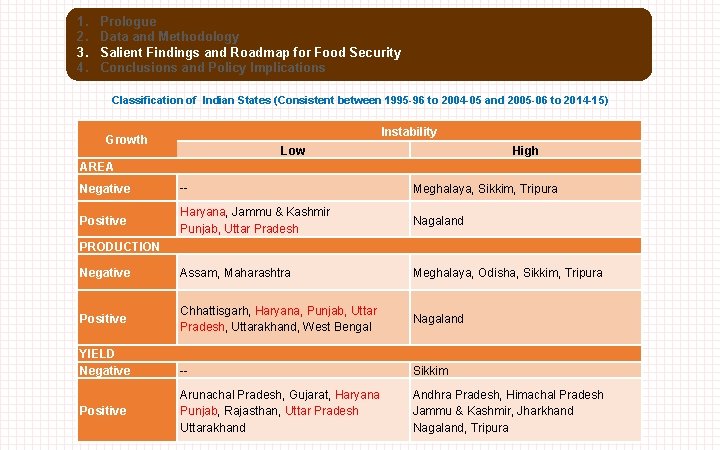
1. 2. 3. 4. Prologue Data and Methodology Salient Findings and Roadmap for Food Security Conclusions and Policy Implications Classification of Indian States (Consistent between 1995 -96 to 2004 -05 and 2005 -06 to 2014 -15) Instability Growth Low High AREA Negative -- Meghalaya, Sikkim, Tripura Positive Haryana, Jammu & Kashmir Punjab, Uttar Pradesh Nagaland Negative Assam, Maharashtra Meghalaya, Odisha, Sikkim, Tripura Positive Chhattisgarh, Haryana, Punjab, Uttar Pradesh, Uttarakhand, West Bengal Nagaland -- Sikkim Arunachal Pradesh, Gujarat, Haryana Punjab, Rajasthan, Uttar Pradesh Uttarakhand Andhra Pradesh, Himachal Pradesh Jammu & Kashmir, Jharkhand Nagaland, Tripura PRODUCTION YIELD Negative Positive
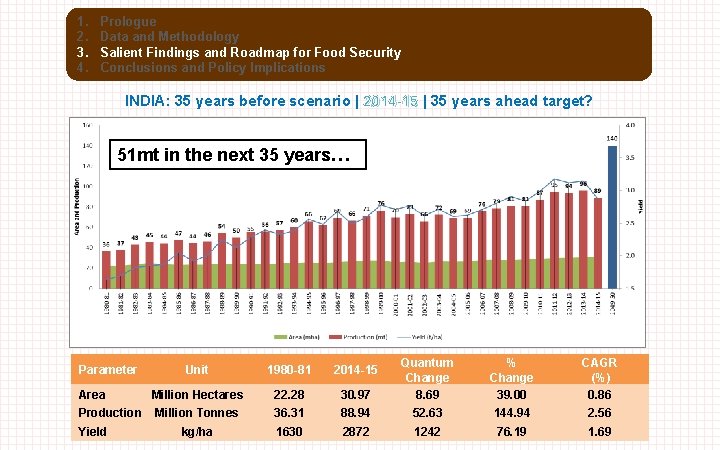
1. 2. 3. 4. Prologue Data and Methodology Salient Findings and Roadmap for Food Security Conclusions and Policy Implications INDIA: 35 years before scenario | 2014 -15 | 35 years ahead target? 51 mt in the next 35 years… Parameter Area Production Yield 30. 97 Quantum Change 8. 69 % Change 39. 00 CAGR (%) 0. 86 36. 31 88. 94 52. 63 144. 94 2. 56 1630 2872 1242 76. 19 1. 69 Unit 1980 -81 2014 -15 Million Hectares 22. 28 Million Tonnes kg/ha
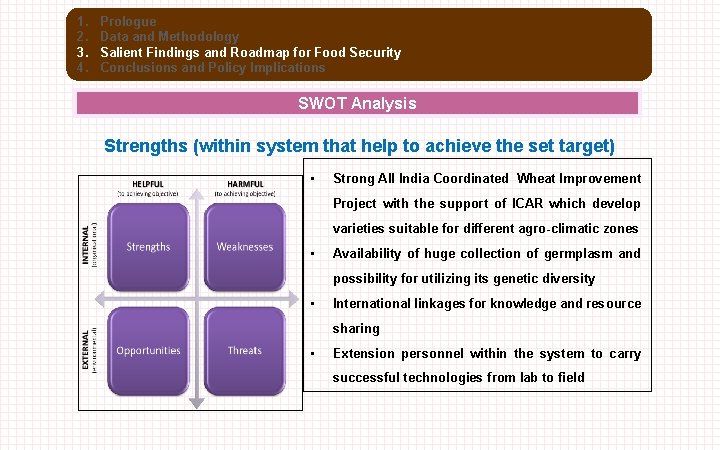
1. 2. 3. 4. Prologue Data and Methodology Salient Findings and Roadmap for Food Security Conclusions and Policy Implications SWOT Analysis Strengths (within system that help to achieve the set target) • Strong All India Coordinated Wheat Improvement Project with the support of ICAR which develop varieties suitable for different agro-climatic zones • Availability of huge collection of germplasm and possibility for utilizing its genetic diversity • International linkages for knowledge and resource sharing • Extension personnel within the system to carry successful technologies from lab to field
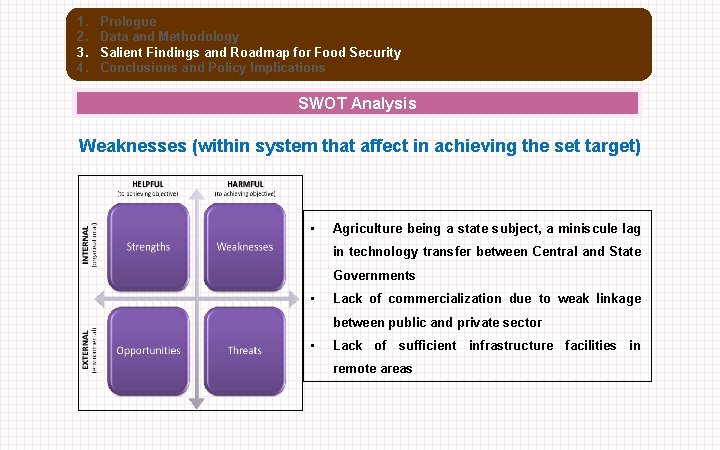
1. 2. 3. 4. Prologue Data and Methodology Salient Findings and Roadmap for Food Security Conclusions and Policy Implications SWOT Analysis Weaknesses (within system that affect in achieving the set target) • Agriculture being a state subject, a miniscule lag in technology transfer between Central and State Governments • Lack of commercialization due to weak linkage between public and private sector • Lack of sufficient infrastructure facilities in remote areas
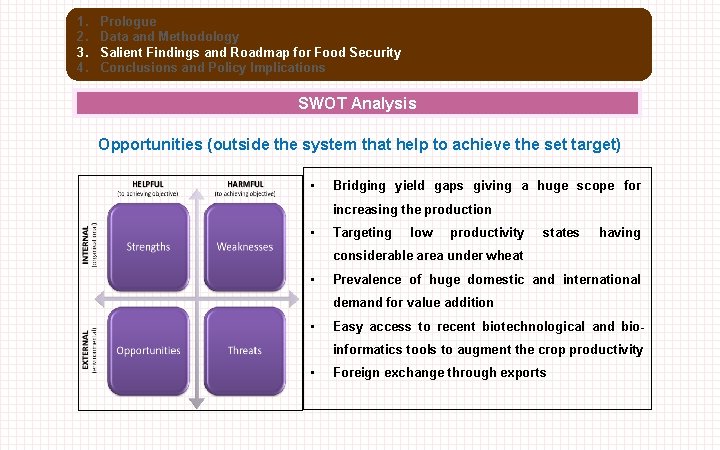
1. 2. 3. 4. Prologue Data and Methodology Salient Findings and Roadmap for Food Security Conclusions and Policy Implications SWOT Analysis Opportunities (outside the system that help to achieve the set target) • Bridging yield gaps giving a huge scope for increasing the production • Targeting low productivity states having considerable area under wheat • Prevalence of huge domestic and international demand for value addition • Easy access to recent biotechnological and bioinformatics tools to augment the crop productivity • Foreign exchange through exports
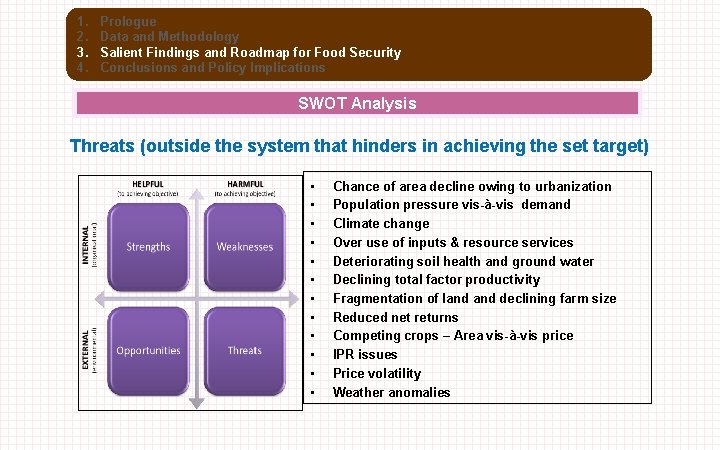
1. 2. 3. 4. Prologue Data and Methodology Salient Findings and Roadmap for Food Security Conclusions and Policy Implications SWOT Analysis Threats (outside the system that hinders in achieving the set target) • • • Chance of area decline owing to urbanization Population pressure vis-à-vis demand Climate change Over use of inputs & resource services Deteriorating soil health and ground water Declining total factor productivity Fragmentation of land declining farm size Reduced net returns Competing crops – Area vis-à-vis price IPR issues Price volatility Weather anomalies
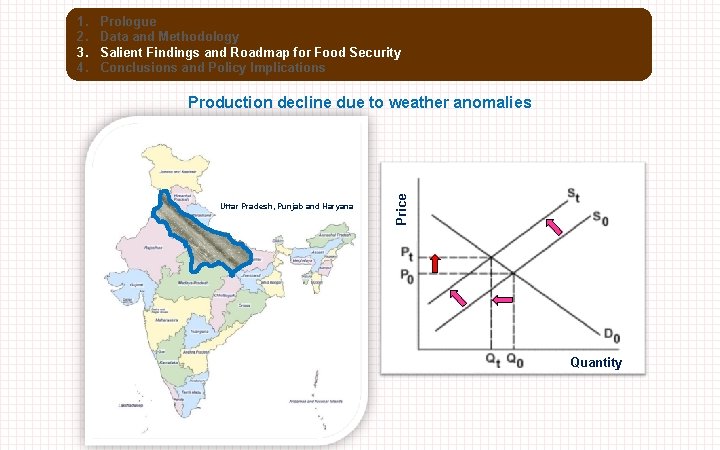
Prologue Data and Methodology Salient Findings and Roadmap for Food Security Conclusions and Policy Implications Production decline due to weather anomalies Uttar Pradesh, Punjab and Haryana Price 1. 2. 3. 4. Quantity
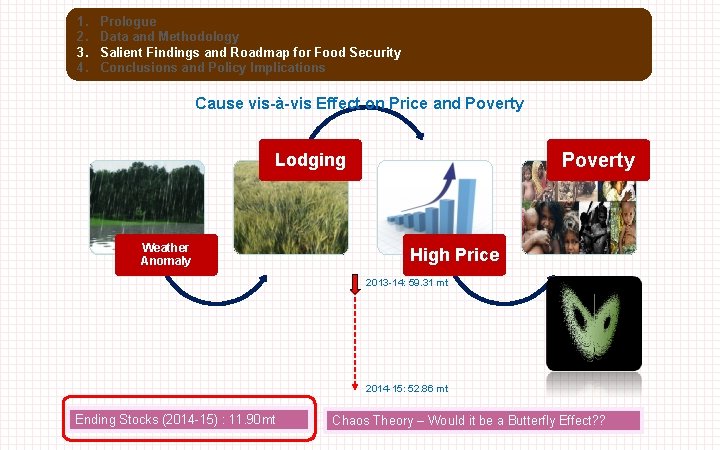
1. 2. 3. 4. Prologue Data and Methodology Salient Findings and Roadmap for Food Security Conclusions and Policy Implications Cause vis-à-vis Effect on Price and Poverty Lodging Weather Anomaly High Price 2013 -14: 59. 31 mt 2014 -15: 52. 86 mt Ending Stocks (2014 -15) : 11. 90 mt Chaos Theory – Would it be a Butterfly Effect? ?
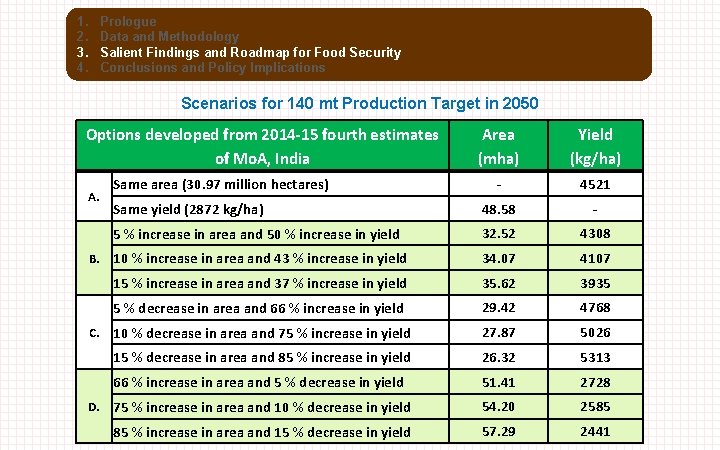
1. 2. 3. 4. Prologue Data and Methodology Salient Findings and Roadmap for Food Security Conclusions and Policy Implications Scenarios for 140 mt Production Target in 2050 Options developed from 2014 -15 fourth estimates of Mo. A, India A. B. C. D. Area (mha) Yield (kg/ha) - 4521 Same yield (2872 kg/ha) 48. 58 - 5 % increase in area and 50 % increase in yield 32. 52 4308 10 % increase in area and 43 % increase in yield 34. 07 4107 15 % increase in area and 37 % increase in yield 35. 62 3935 5 % decrease in area and 66 % increase in yield 29. 42 4768 10 % decrease in area and 75 % increase in yield 27. 87 5026 15 % decrease in area and 85 % increase in yield 26. 32 5313 66 % increase in area and 5 % decrease in yield 51. 41 2728 75 % increase in area and 10 % decrease in yield 54. 20 2585 85 % increase in area and 15 % decrease in yield 57. 29 2441 Same area (30. 97 million hectares)
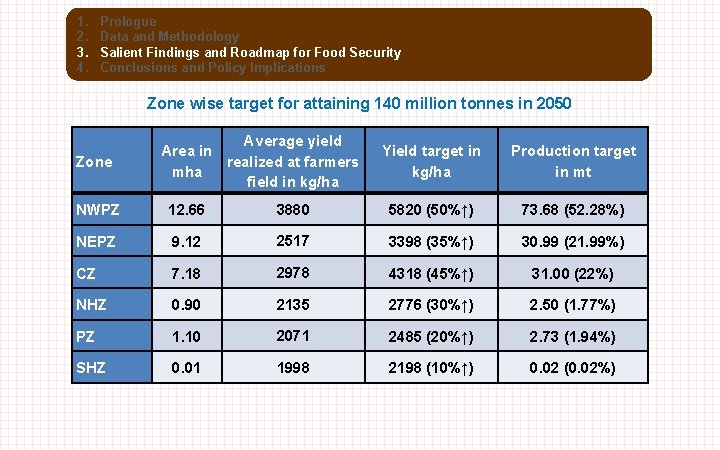
1. 2. 3. 4. Prologue Data and Methodology Salient Findings and Roadmap for Food Security Conclusions and Policy Implications Zone wise target for attaining 140 million tonnes in 2050 Zone Average yield Area in realized at farmers mha field in kg/ha Yield target in kg/ha Production target in mt NWPZ 12. 66 3880 5820 (50%↑) 73. 68 (52. 28%) NEPZ 9. 12 2517 3398 (35%↑) 30. 99 (21. 99%) CZ 7. 18 2978 4318 (45%↑) 31. 00 (22%) NHZ 0. 90 2135 2776 (30%↑) 2. 50 (1. 77%) PZ 1. 10 2071 2485 (20%↑) 2. 73 (1. 94%) SHZ 0. 01 1998 2198 (10%↑) 0. 02 (0. 02%)
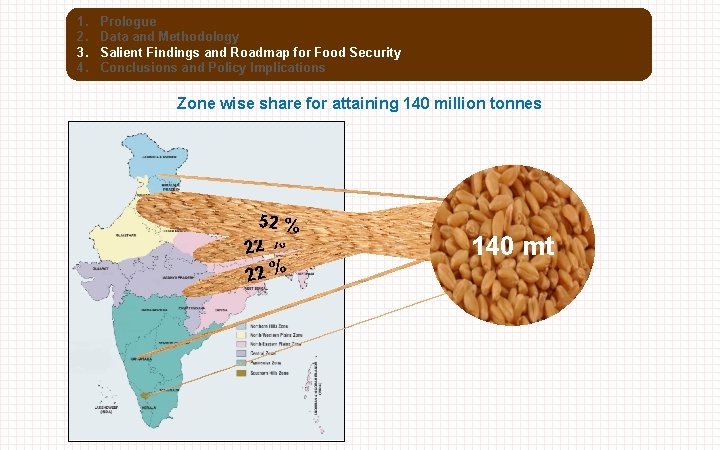
1. 2. 3. 4. Prologue Data and Methodology Salient Findings and Roadmap for Food Security Conclusions and Policy Implications Zone wise share for attaining 140 million tonnes 52 % 22 % 140 mt
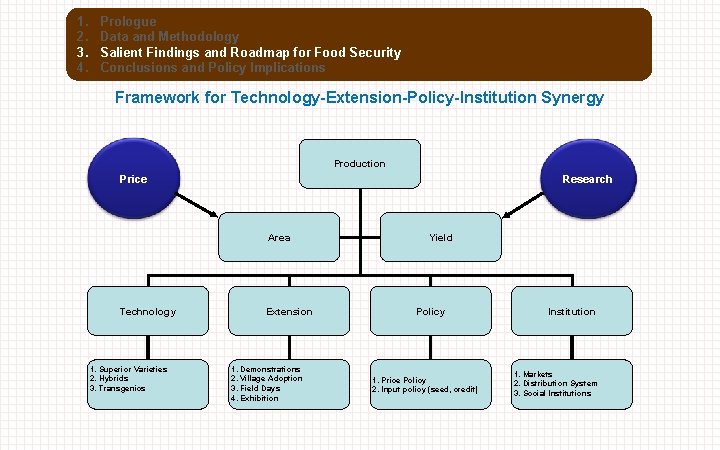
1. 2. 3. 4. Prologue Data and Methodology Salient Findings and Roadmap for Food Security Conclusions and Policy Implications Framework for Technology-Extension-Policy-Institution Synergy Production Price Research Area Technology 1. Superior Varieties 2. Hybrids 3. Transgenics Extension 1. Demonstrations 2. Village Adoption 3. Field Days 4. Exhibition Yield Policy 1. Price Policy 2. Input policy (seed, credit) Institution 1. Markets 2. Distribution System 3. Social Institutions
e k a T e m Ho … e g a s s Me
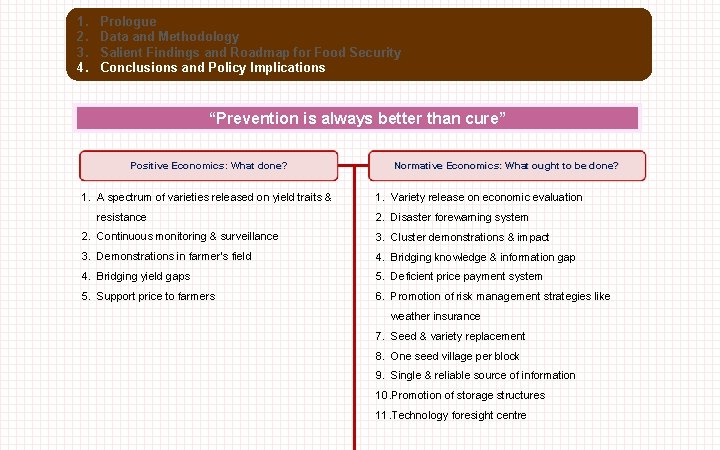
1. 2. 3. 4. Prologue Data and Methodology Salient Findings and Roadmap for Food Security Conclusions and Policy Implications “Prevention is always better than cure” Positive Economics: What done? 1. A spectrum of varieties released on yield traits & resistance Normative Economics: What ought to be done? 1. Variety release on economic evaluation 2. Disaster forewarning system 2. Continuous monitoring & surveillance 3. Cluster demonstrations & impact 3. Demonstrations in farmer’s field 4. Bridging knowledge & information gap 4. Bridging yield gaps 5. Deficient price payment system 5. Support price to farmers 6. Promotion of risk management strategies like weather insurance 7. Seed & variety replacement 8. One seed village per block 9. Single & reliable source of information 10. Promotion of storage structures 11. Technology foresight centre
Acknowledgements Indian Council of Agricultural Research (ICAR), New Delhi Director, ICAR-Indian Institute of Wheat and Barley Research Dr. AK Joshi, CIMMYT Prof. Richard Trethowan, The University of Sydney Dr. Ravish Chatrath & Dr. Indu Sharma, ICAR-IIWBR Colleagues & Staffs, ICAR-IIWBR Organizers, IWC 2015
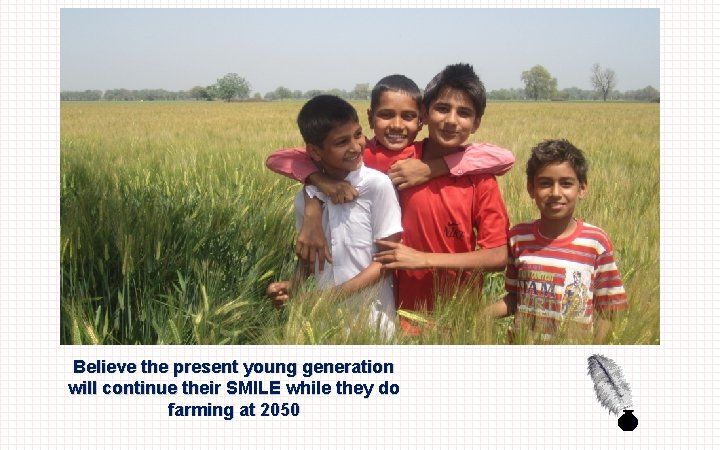
Believe the present young generation will continue their SMILE while they do farming at 2050