Trends in Sea Ice Retreat and Subsequent Advance

Trends in Sea Ice Retreat and Subsequent Advance in Response to ENSO and SAM Variability at High Southern Latitudes S. E Stammerjohn 1*, D. G. Martinson 1, R. C. Smith 2 & X. Yuan 1 Journal of Climate (in review) 1 Lamont Doherty Earth Observatory & Department of Earth and Environmental Sciences, Columbia University, Palisades, NY 2 Institute for Computational Earth System Science and Department of Geography, University of California at Santa Barbara, CA *Current Address: NASA Goddard Institute for Space Studies

Motivation & Key Questions 1. Seasonality of Warming 2. When & Where are Sea Ice Changes Occurring 3. Connection to ENSO & SAM 4. Inter-Seasonal Feedbacks

Seasonality of Antarctic Peninsula Warming • Strongest warming in autumn & winter (e. g. Vaughan et al, 2003) • Decreasing winter sea ice duration (e. g. Parkinson, 2002) • Implies changes in the autumn sea ice advance & spring retreat…
 Monthly Sea")
Sea ice in the west Antarctic Peninsula region (Stammerjohn et al, 2003) Monthly Sea Ice Extent (105 km 2) Normalized Monthly Anomalies (e. g. Yuan & Martinson, 2000) Maps of Day of Advance & El Nino 2002 -03 Retreat: e itive Posgreater El Ninoinfluence 1991 -92 • Advance has on duration Negative. La Nina 1988 -89 El Nino Pos 1987 -88 itive El Nino 1986 -87 • Stronger co-variability between La Nina 1984 -85 e ativ retreat. Neg & subsequent advance La Nina 1983 -84 Positive Month tiv Po si ga El Nino 1997 -98 • Large areas of coherent La Nina 1995 -96 anomalies El Nino 1994 -95 Ne Winter Maximum Summer Minimum Year tiv e La Nina 1999 -00 La Nina 1998 -99 El Nino 1982 -83 Month

1979 -2002 Trends Ice Season Duration Retreat Advance 3. 0 Later Earlieradvance retreat in in southern Shorter ice season in southern Bellingshausen Sea 2. 0 1. 0 Longer Later Retreat Later Advance 4. 0 0. 0 -2. 0 Earlier Later retreat advance in western in in western Longer ice season Ross Sea western -3. 0 (Parkinson, 2002; Liu et al. , 2004) Changes in Dec-Feb (retreat) & Feb-Apr (advance) -4. 0 Shorter Retreat Earlier Advance -1. 0
 Region AP/s. Bell Sea w. Ross Sea")
Total Change over 24 years (1979 -2002) Region AP/s. Bell Sea w. Ross Sea Advance (days) Retreat (days) Duration (days) +48± 8 (later) -32± 6 (earlier) -80± 13 (decreasing) -27± 7 (earlier) +28± 6 (later) +55± 12 (increasing) Strongest Impacts: Disappearance or appearance of perennial sea ice… ger N Tim er ewb in response to La Niña &/or +SAM events

Regression of SLP anomalies onto SAM Less AM Sea Ice For +SAM: +SLP anoms mid-lats - SLP anoms high-lats +S More Sea Ice Figure courtesy of Todd Mitchell (http: //www. jisao. washington. edu/aao) Antarctic Dipole (ADP) sea ice response (e. g. Lefebvre et al. , 2004) -1. 0 -0. 5 0. 0 0. 5 1. 0 1. 5 Sea Surface Temperature Anomaly (mb per standard deviation of index) ADP Strongest response (winds ® sea ice ): spring-to-autumn From Yuan (2004) -1. 5 -1. 0 - 0. 5 0. 0 0. 5 1. 0 Sea Surface Temperature Anomaly
")
Oscillation to Trend? • No trend in ENSO in tropical Pacific • Strong (+) trend in SAM, esp. DJF & MAM (e. g. Marshall, 2003) • Increased (-) co-variability Nino 3. 4 & SAM (spring-to-autumn 90 s vs 80 s) • Intensification of high latitude response to ENSO (e. g. Fogt & Bromwich, 2006; L’Heureux & Thompson, 2006) …particularly to La Niña?

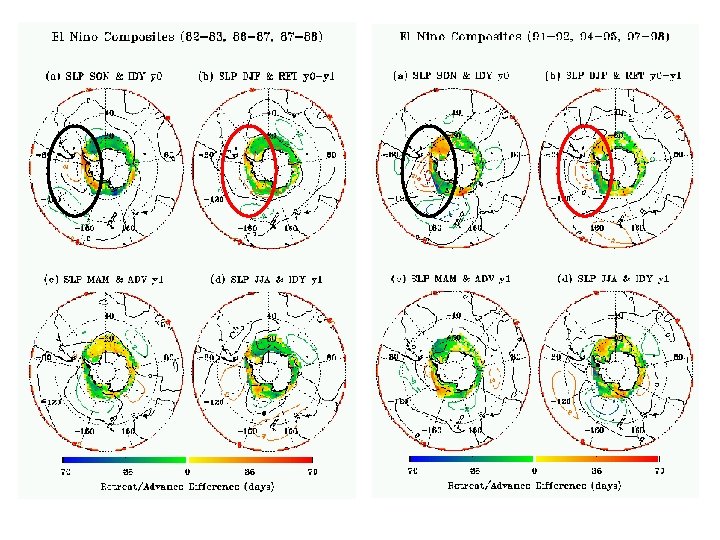
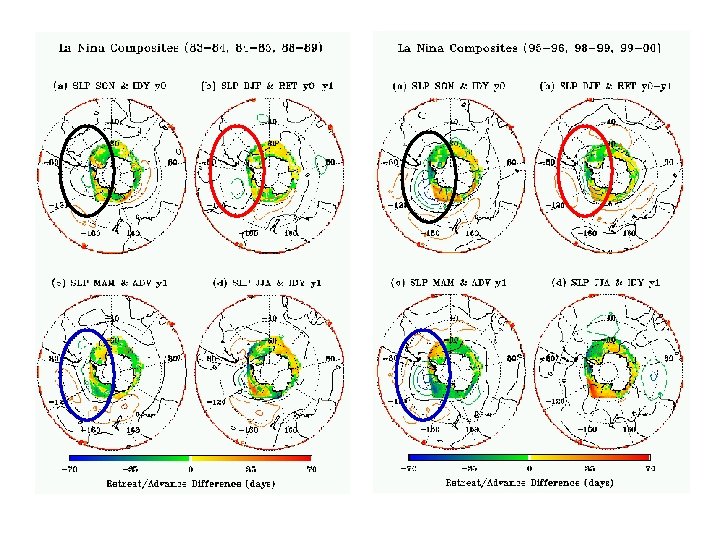
Intensification of high latitude response to La Niña (Coincident with increased neg. co-variability with a more +SAM) La Niña Composites Atmospheric Anomalies 1990 s 1980 s • 1990 s intensification • Shifted southeastward in 1990 s Sea Ice Anomalies • Strong Antarctic dipole in 1990 s Difference in Advance (Days) <-70 -35 Early Advance 0 35 >70 Late Advance Color Contours: sea-level pressure diff (Mar-Apr-May) • Mixed & weaker in 1980 s

Key Questions - Revisited 1. When & where are changes occurring? When: during retreat & subsequent advance (spring-to-autumn) Where: s. Bellingshausen & w. Ross Sea How: disappearance & appearance of perennial sea ice (wind-driven during La Niña &/or +SAM) Mixed response over time: Weddell, Amundsen, e. Ross

2. Connection to ENSO/SAM Larger sea ice response to: La Niña & +SAM Intensified high latitude response to ENSO in 1990 s: (especially to La Niña events) Increased neg. co-variability between ENSO & SAM (during spring-to-autumn) Strong +trends in SAM during summer & autumn (intensifies high latitude La Niña response) Geographical shifting of SLP anomalies (focused trends in s. BS & w. RS, mixed response in WS, AS, e. RS)

3. Inter-Seasonal Feedbacks in the AP Region Spring-to-Autumn: Atm: Strong northerly winds (during La Nina &/or +SAM) Ice: Earlier retreat, later advance Ocean: Surface warming & increased salinity (Meredith & King, 2005) Ocean: Increased warm Upper Circumpolar Deep Water on shelf (Martinson et al. , 2006) Land: Increased melt of marine glaciers & ice shelves (e. g. Cook et al. , 2005; Scambos et al. , 2000)
 Autumn-to-Winter : Ice: Shorter duration, lower")
3. Inter-Seasonal Feedbacks in the AP Region (cont) Autumn-to-Winter : Ice: Shorter duration, lower conc. , thinner, more mobile Ocean: Increased ocean heat flux to atmosphere Atm: Increased cloudiness & air temperature Climate: Amplification of regional warming in winter… …ultimately responding to atm circ changes in spring-to-autumn

“Call this an iceberg? When I was a kid we wouldn’t have called this an iceberg!” Thank You

Extra, extra

Finding Day of Advance & Day of Retreat 3. Retreat-Advance = Ice Season Duration Sea Ice Concentration (%) ** * 200 400 600 200 400 67. 6ºS, 82. 7ºW 2. Sea ice > 15%: advance Sea ice < 15%: retreat 70. 9ºS, 81. 4ºW Mean September (1991 -03) 1. Search window: mid-Feb (day 46) to mid-Feb(day 410/411) 1990 -1991 65. 4ºS, 83. 4ºW 4. Days > 15% = Actual Ice Days Year Day

Day of Retreat Day of Advance Year day of Retreat Year day of Advance 1979 -2002 Climatology 250 292 Sep 335 Nov 377 40 Feb 420 Feb 92 145 Jun 1998 -1999 Anomaly (days) <-60 -30 Early Retreat Early Advance 0 30 >60 Late Retreat Late Advance 197 250 Sep

Advance vs Duration 0. 8 0. 6 0. 4 0. 2 0. 0 -0. 2 -0. 4 -0. 6 -0. 8 -1. 0 Adv (lagged) vs Ret 1. 0 0. 8 0. 6 0. 4 0. 2 0. 0 -0. 2 -0. 4 -0. 6 -0. 8 -1. 0 spring-to-autumn (over summer) -1. 0 Correlation Coefficient autumn-to-spring (over winter) 1. 0 0. 8 Advance vs Retreat Higher co-variability spring-to-autumn Retreat vs Duration Correlation Coefficient Advance has a greater influence 1. 0
 e. WS (20 W-20 E) Regional Trends (Duration &")
w. WS (60 W-20 W) e. WS (20 W-20 E) Regional Trends (Duration & Actual Ice Days) 1980 • Lots of year-to-year variability • 24 years too short • Exceptions: 1990 1995 2000 1980 IO (20 E-90 E) Duration & Actual Ice Days • Different trend characteristics over time 1985 1980 1985 1990 1995 2000 w. PO (90 E-160 E) 2000 1980 w. RS (160 E-170 W) 1980 1985 1990 1995 2000 e. RS (170 W-130 W) 1980 2000 1985 1990 1995 2000 BS (90 W-60 W) AS (130 W-90 W) • western Ross Sea • Bellingshausen Sea 1980 1985 1990 1995 2000 1980 Year 1985 1990 1995 2000

Day of Advance s. Bellingshausen Sea w. Ross Sea 1979 40 Disappearance of Perennial Sea Ice 100 160 200 280 Year Day 1984 Coincides with La Nina and/or +SAM 1989 Coincides with La Nina and/or +SAM 1999 40 100 160 Appearance of Perennial Sea Ice 200 280

High Latitude Sea Ice Response to ENSO & SAM (e. g. Yuan & Martinson, 2000; 2001; Yuan, 2004; Lefebvre et al. , 2006) Antarctic Dipole Antarctic Peninsula Region La Niña &/or +SAM: low sea ice Spring-to-autumn sea ice response Early retreat, late advance Amundsen-Ross Sea Region La Niña &/or +SAM: high sea ice Late advance, early retreat

Day of Advance southern Bellingshausen Sea western Ross Sea 160 140 120 100 80 80 60 60 40 40 20 Summer-over Sea Ice 79 81 83 85 87 89 91 93 95 97 99 01 Disappearance of Summer Sea Ice: Coincides with 6 La Nina events (4 of which are +SAM) 20 79 81 83 85 87 89 91 93 95 97 99 01 Appearance of Summer Sea Ice Coincides with 4 La Nina events (Plus 3 +SAM events)
")
Is SAM Amplifying the High Latitude ENSO Response? Nino 3. 4 versus SAM (smoothed) Correlation Coefficient 1980 s + 0. 5 Negative co-variability increases in 1990 s 0. 0 -0. 5 Jan Standardized Anomaly 1990 s o Feb Mar Apr May Jun Jul Aug Sep Oct Nov Dec Annual & Seasonal Trends in SAM 2 DJF 1 MAM SON JJA 0 -1 -2 79 81 83 85 87 89 91 93 95 97 99 Positive trend strongest in summer& autumn 01 Amplifies La Nina in particular
 • 1990")
La Niña – El Niño Color Contours: Mar-Apr-May sea-level pressure difference (mb) • 1990 s intensification (especially La Nina) 1990 s 1980 s Atmospheric Anomalies • Shifted poleward in 1990 s Sea Ice Anomalies • Strong Antarctic dipole in 1990 s Difference in Advance (Days) <-70 -35 Early Advance 0 35 >70 Late Advance • Mixed & weaker in 1980 s

Less Ice Days Earlier Retreat Earlier Advance More Ice Days Later Retreat Later Advance Contours Shading Sep-Nov SLP Ice Days Dec-Feb SLP Retreat Mar-Apr SLP Advance

3 2 Sep-Oct-Nov Examples of Feedbacks 1 0 -1 -2 -3 3 2 Strong spring winds: Late coastal sea ice retreat (R = +0. 87) SON Winds Coastal Ice Retreat Dec-Jan-Feb Standard Deviate 1 0 Late coastal sea ice retreat: Cool summer air temps (R = -0. 72) -1 Coastal Ice Retreat DJF Air Temp -2 -3 3 2 Mar-Apr-May 1 Strong autumn winds: Late sea ice advance (R = +0. 74) 0 -1 MAM Winds Ice Advance -2 -3 3 2 Jun-Jul-Aug 1 Late sea ice advance: Warm winter air temps (R = 0. 79) 0 -1 Ice Advance JJA Air Temp -2 -3 1990 1995 2000 2005
 Climate Warming on the Antarctic Peninsula (AP) Vaughan et al")
Recent Rapid Regional (RRR) Climate Warming on the Antarctic Peninsula (AP) Vaughan et al (2003) • AP - 1 of 3 high-latitude areas of RRR warming • AP warming unprecedented over last 1800 years • Elsewhere in Antarctica, RRR warming not detected • Polar-wide amplification of global warming not apparent
 Temp since 1950: +5. 8ºC in winter Annual Air Temperature")
(Vaughan et al, 2003) Temp since 1950: +5. 8ºC in winter Annual Air Temperature 0 Temperature (ºC) Antarctic Peninsula Recent Rapid Regional Warming Sea ice since 1979: -20% of ann. mean -2 -4 -6 -8 -10 (more details shortly) 50 55 60 65 70 75 80 85 90 95 00 05 Upper ocean since 1955: +1ºC, saltier (Meredith & King, 2005) Glaciers since 1950 s: 87% in retreat (Cook et al, 2005) Ice Shelves since 1950 s: 10 retreated (Scambos et al, 2000) Sea Ice Extent (105 km 2) Year Annual Sea Ice Extent 2. 0 Southern Ocean 1. 4 0. 8 w. AP 0. 2 78 80 82 84 86 88 90 92 94 96 98 00 02 04
- Slides: 30