
Trends in Groundwater Conditions in the Ogallala Aquifer

- Slides: 22
Trends in Groundwater Conditions in the Ogallala Aquifer Patrick Frasier
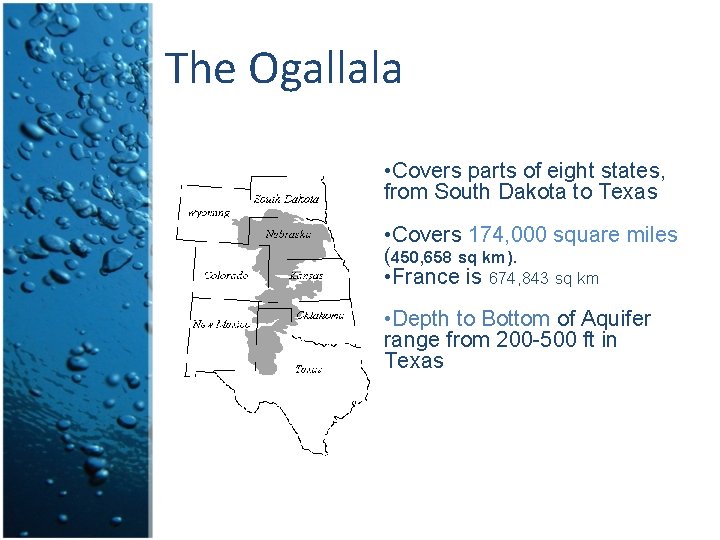
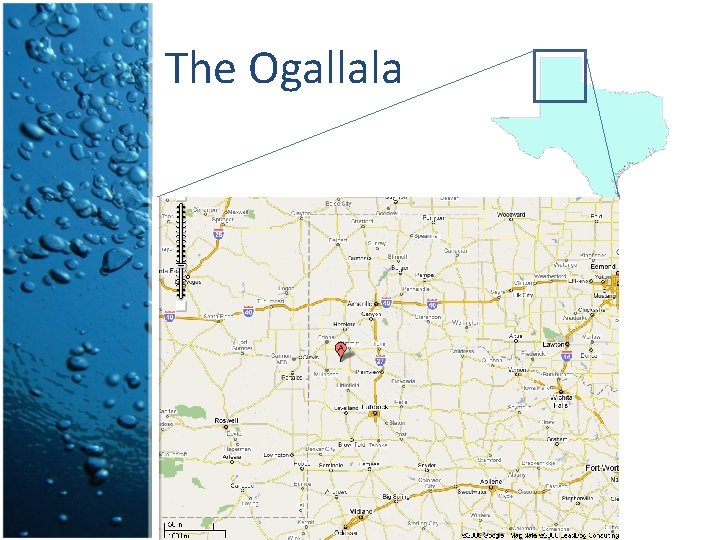
The Ogallala • Covers parts of eight states, from South Dakota to Texas • Covers 174, 000 square miles (450, 658 sq km). • France is 674, 843 sq km • Depth to Bottom of Aquifer range from 200 -500 ft in Texas
Why is the Ogallala Important? • Aquifer represent 65 percent of all the irrigated acreage in the nation (Jensen, 2004). • Possible that the aquifer may dry up in as little as 25 years (BBC, 2007)
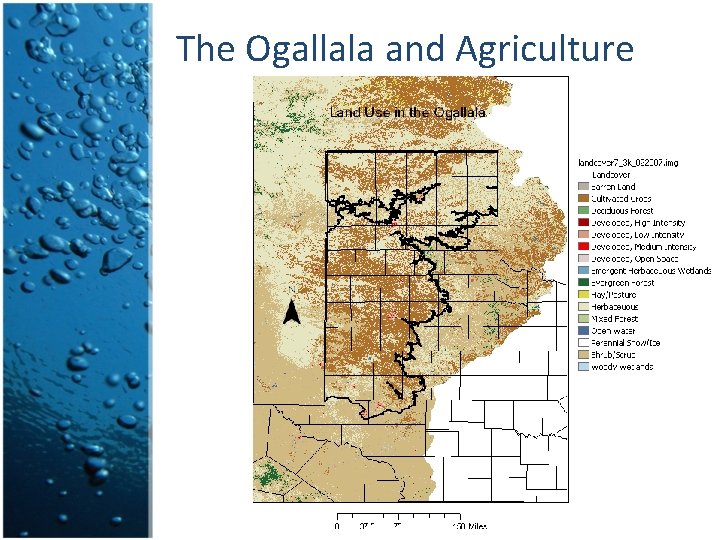
The Ogallala and Agriculture
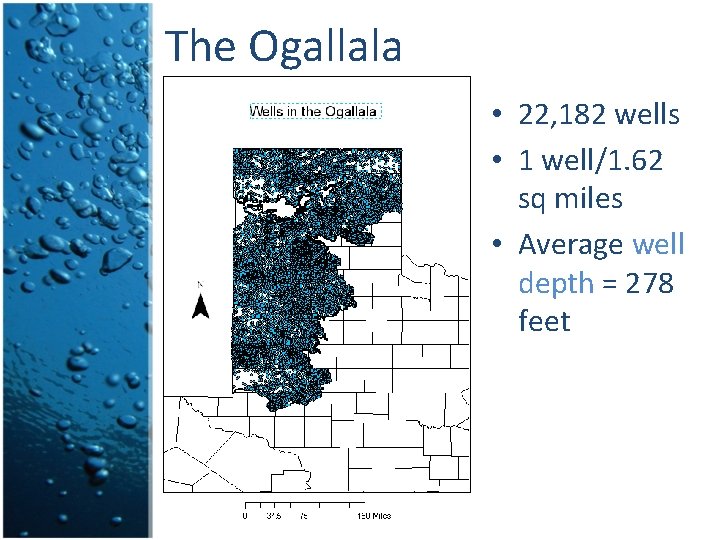
The Ogallala • 22, 182 wells • 1 well/1. 62 sq miles • Average well depth = 278 feet
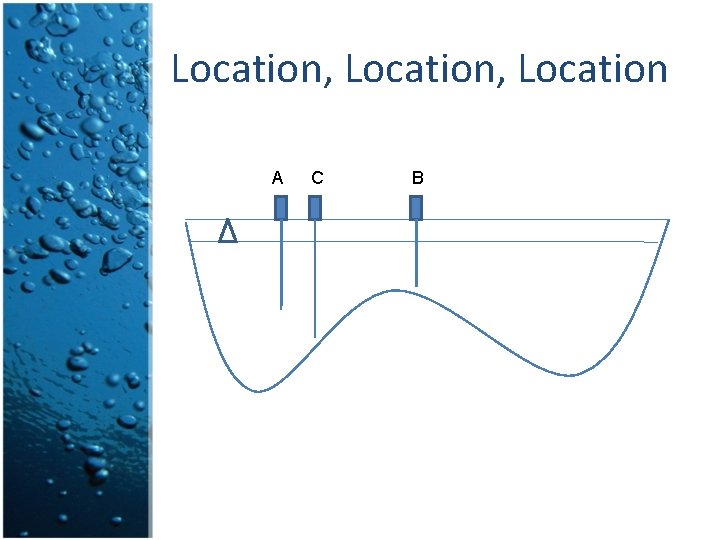
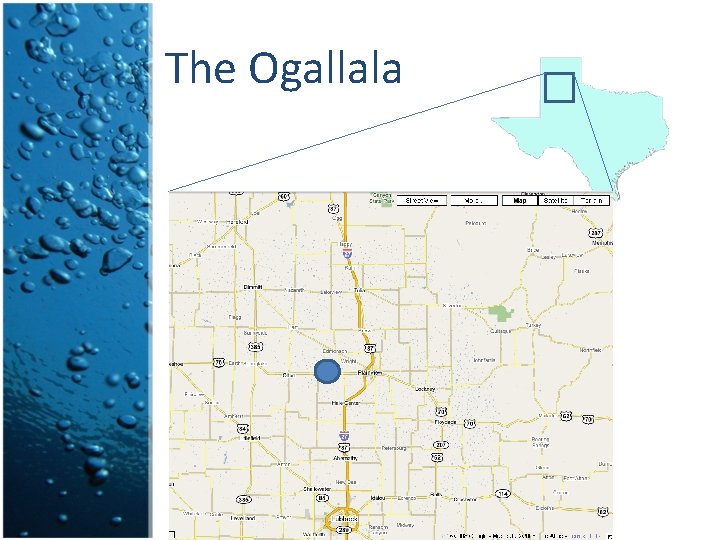
Location, Location A C B
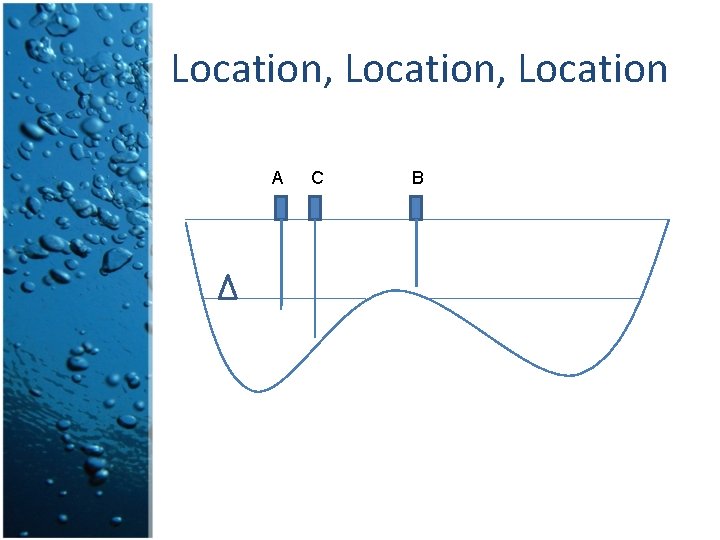
Location, Location A C B
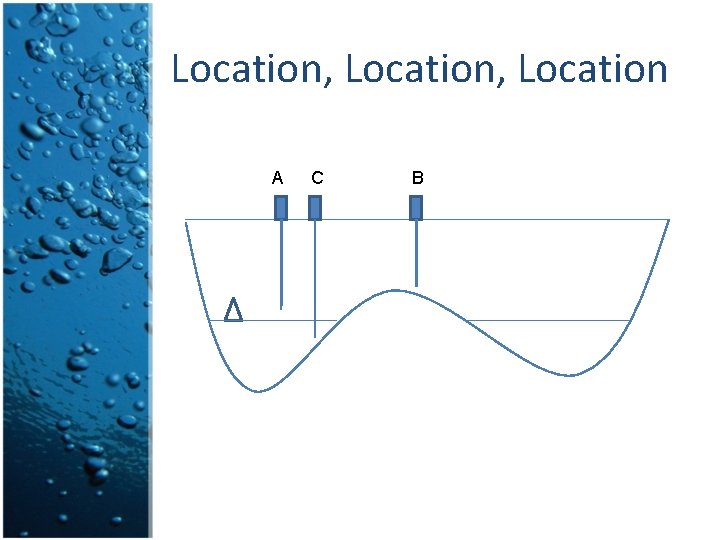
Location, Location A C B
The Ogallala
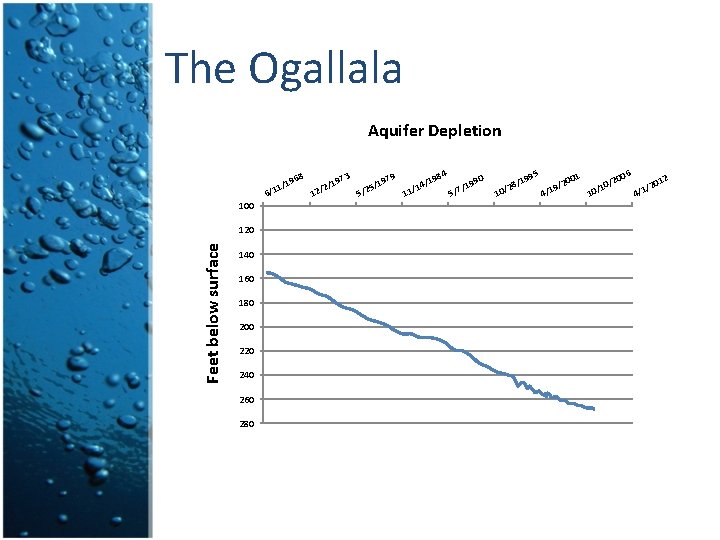
The Ogallala Aquifer Depletion 9 8 3 84 90 /19 197 196 197 / / / 4 5 1 2 /19 1 / / 2 1 7 / / 2 / 1 5 6 1 5 1 100 Feet below surface 120 140 160 180 200 220 240 260 280 5 199 28/ 10/ 1 00 9/2 1 / 4 6 200 1 0/ 0/1 201 / 4/1 2
The Ogallala
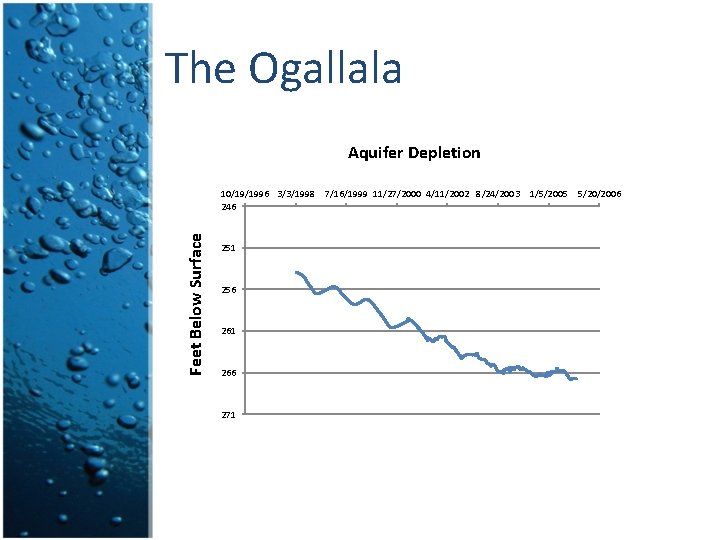
The Ogallala Aquifer Depletion Feet Below Surface 10/19/1996 3/3/1998 7/16/1999 11/27/2000 4/11/2002 8/24/2003 246 251 256 261 266 271 1/5/2005 5/20/2006
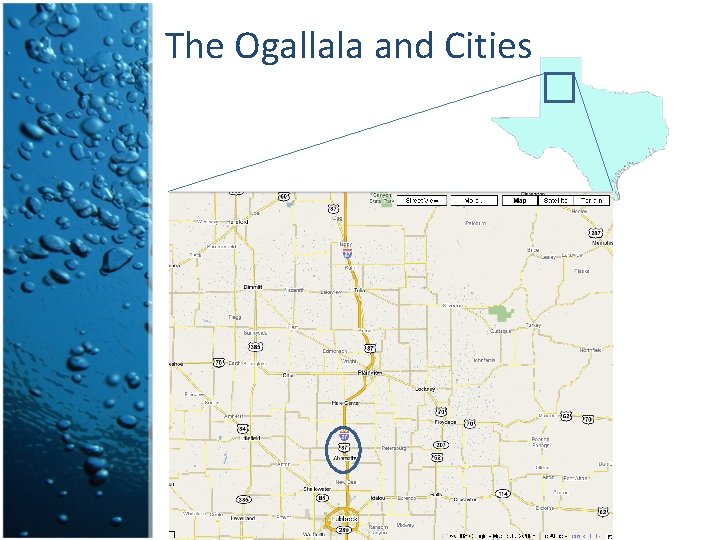
The Ogallala and Cities
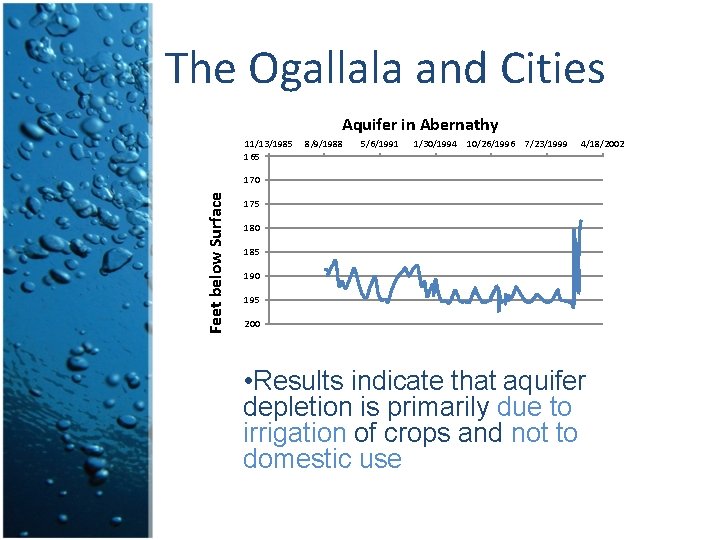
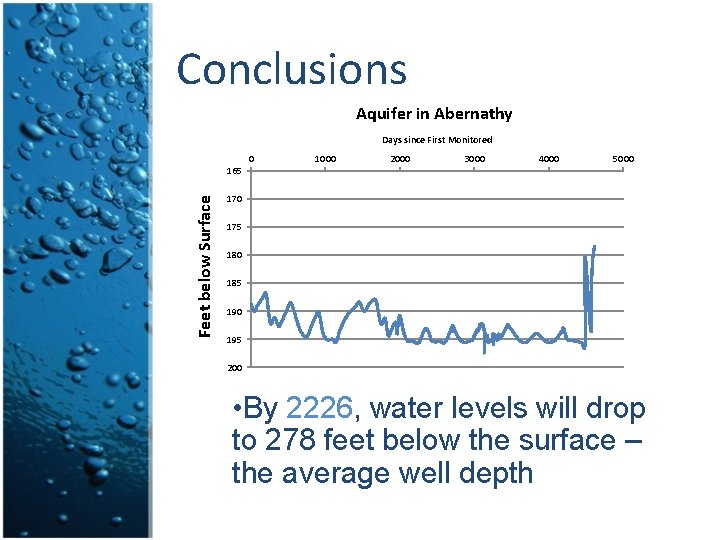
The Ogallala and Cities Aquifer in Abernathy 11/13/1985 165 8/9/1988 5/6/1991 1/30/1994 10/26/1996 7/23/1999 4/18/2002 Feet below Surface 170 175 180 185 190 195 200 • Results indicate that aquifer depletion is primarily due to irrigation of crops and not to domestic use
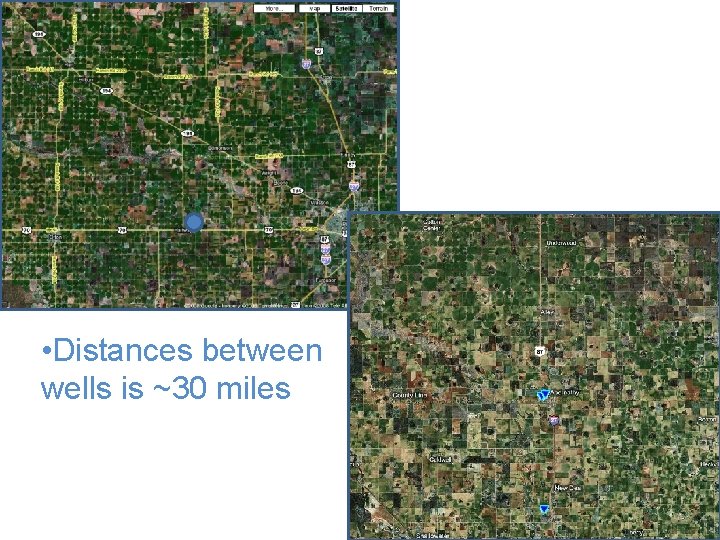
• Distances between wells is ~30 miles
Reasons for Decline • Unfavorable geology • Unfavorable climate • Overpumping
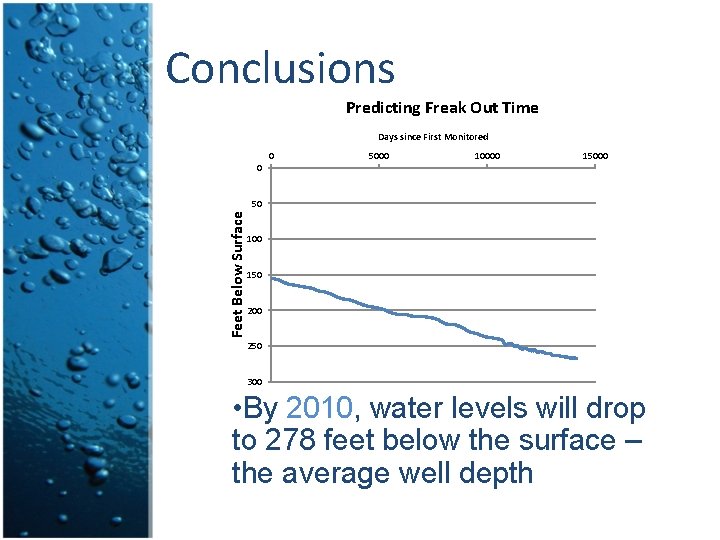
Conclusions Predicting Freak Out Time Days since First Monitored 0 5000 10000 15000 0 Feet Below Surface 50 100 150 200 250 300 • By 2010, water levels will drop to 278 feet below the surface – the average well depth
Conclusions Aquifer in Abernathy Days since First Monitored 0 1000 2000 3000 4000 5000 Feet below Surface 165 170 175 180 185 190 195 200 • By 2226, water levels will drop to 278 feet below the surface – the average well depth
Conclusions • Effects not the same for everyone • It depends on your location, how deep your well is, and how much money you have. • $100/foot to drill a well
Possible Solutions • Improvements in irrigation technology • Farmers take CE 385 D to learn how to solve optimization models using GAMS
You’re Welcome • Sources • North Plains Water Division. http: //www. npwd. org/new_page_2. htm • Jensen, Ric. 2004. http: //twri. tamu. edu/news/2004/08/01/ogallala-aquifer/ • BBC News. http: //news. bbc. co. uk/2/shared/spl/hi/world/03/world_foru m/water/html/ogallala_aquifer. stm