Trends and Variability of Tropical Cyclone Risk Kerry

Trends and Variability of Tropical Cyclone Risk Kerry Emanuel Lorenz Center Department of Earth, Atmospheric, and Planetary Sciences, MIT

Program Brief overview of hurricanes and hurricane risk What have hurricanes been like in the past, and how will they be affected by global warming? How should we assess hurricane risk?

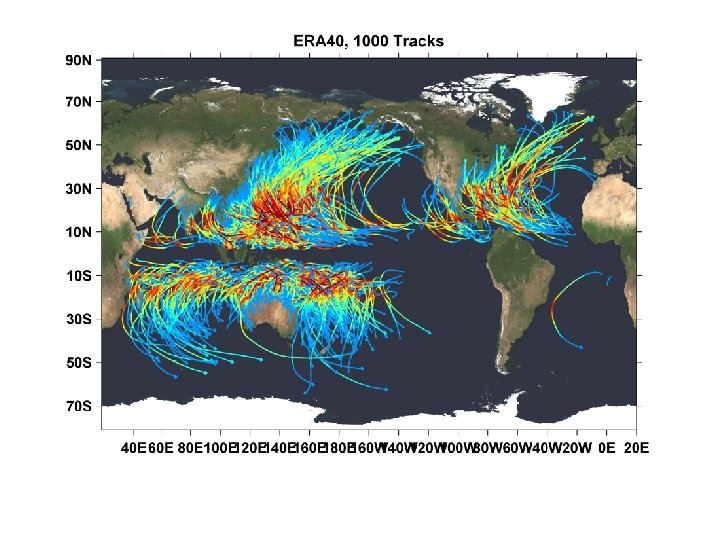
Tropical Cyclone Climatology
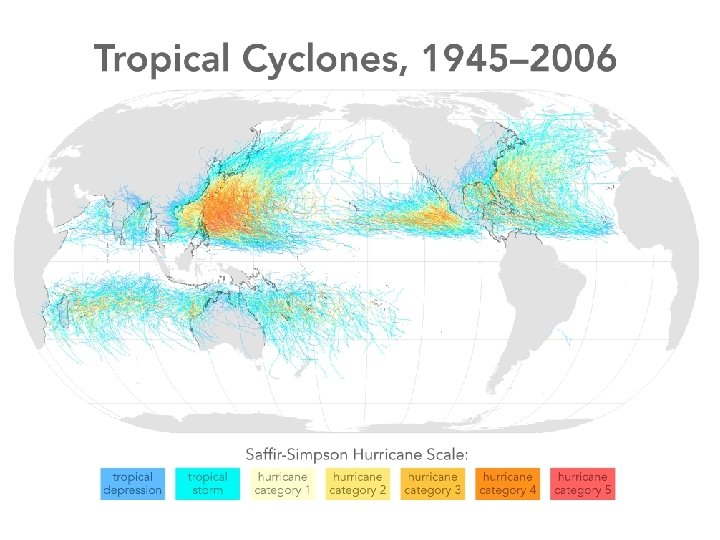
")
Number of Events per Month Annual Cycle of Tropical Cyclones a Northern Hemisphere (NH) a Southern Hemisphere (SH) Jan Feb Mar Jul Aug Sep Apr May Jun Jul Aug Oct Nov Dec Jan Feb Sep Oct Nov Dec NH Mar Apr May Jun SH

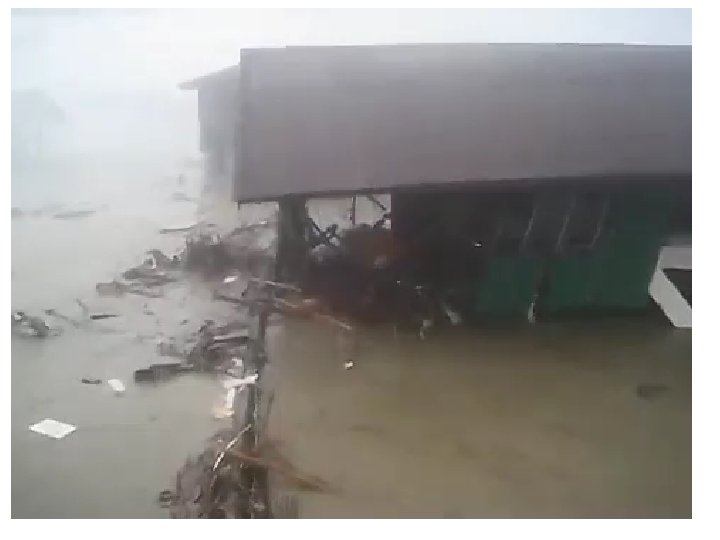
Hurricane Risks: Wind Storm Surge Rain

Total US Damages by Natural Hazard, 1980 -2012 Source: NOAA

Hurricane Risk: What Can We Learn from Historical Records?

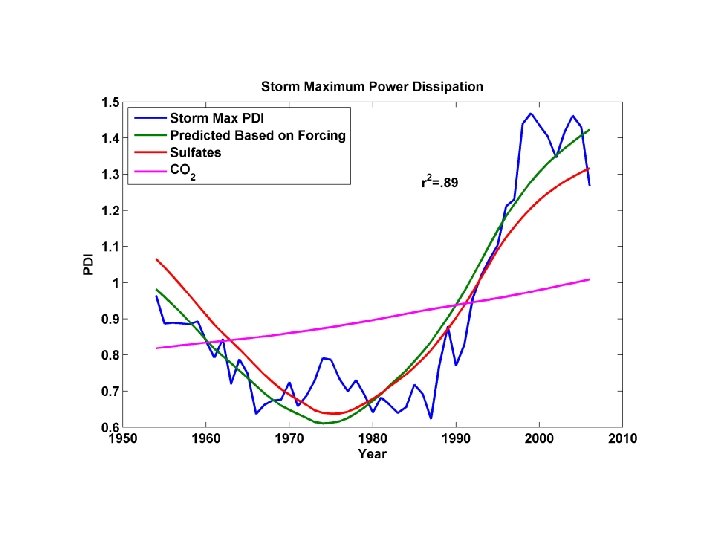
Storm Maximum Power Dissipation and SST North Atlantic

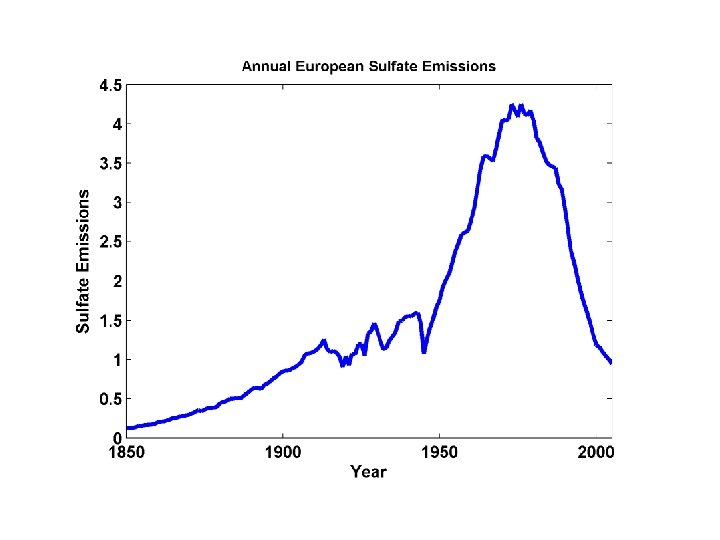
Sulfate Aerosols and North Atlantic Hurricanes During the late 20 th Century, global aerosol radiative forcing is thought to be as important as CO 2 radiative forcing Per unit radiative forcing, shortwave forcing is roughly twice as effective as longwave forcing in changing potential intensity Much of the interannual variability of aerosol forcing over the tropical North Atlantic in summer is thought to be owing to the interaction of sulfate aerosols of European origin with African dust

Storm Maximum Power Dissipation and SST North Atlantic

Hurricane Risk: What Can We Learn from Geology?
 upland overwash fan lagoon barrier beach upland overwash")
barrier beach Paleotempestology backbarrier marsh a) upland overwash fan lagoon barrier beach upland overwash fan b) backbarrier marsh lagoon terminal lobes flood tidal delta Source: Jeff Donnelly, WHOI

Jeffrey P. Donnelly and Jonathan D. Woodruff, Nature, 2007

Near Pensacola, Florida Lane et al. , Marine Geology, 2011 Sediment record reconstruction from Mullet Pond at Bald Point for the last 4000 years. Recent historical hurricanes attributable to event beds are noted.

Does Global Warming Affect Hurricanes?

Svante Arrhenius, 1859 -1927 “Any doubling of the percentage of carbon dioxide in the air would raise the temperature of the earth's surface by 4°; and if the carbon dioxide were increased fourfold, the temperature would rise by 8°. ” – Världarnas utveckling (Worlds in the Making), 1906

Hurricane Potential Intensity: What is it and How will it Change with Climate?

Hurricane Potential Intensity: Maximum Sustainable Wind Speed for a given Sea Surface Temperature and Atmospheric Temperature Profile
")
Annual Maximum Potential Intensity (m/s)
 ms-1 decade-1")
Trends in Thermodynamic Potential for Hurricanes, 1980 -2010 (NCAR/NCEP Reanalysis) ms-1 decade-1

Projected Trend, 2006 -2100: GFDL model RCP 8. 5 ms-1 decade-1

Time series of the latitudes at which tropical cyclones reach maximum intensity. From Kossin et al. (2014)

Assessments of Present and Future Hurricane Risk

U. S. Hurricane Damage, 1900 -2004, Adjusted for Inflation, Wealth, and Population

Total Number of Landfall Events, by Category, 1870 -2004

Limitations of a strictly statistical approach to hurricane risk assessment >50% of all normalized U. S. hurricane damage caused by top 8 events, all category 3, 4 and 5 >90% of all damage caused by storms of category 3 and greater Category 3, 4 and 5 events are only 13% of total landfalling events; only 30 since 1870 Landfalling storm statistics are inadequate for assessing hurricane risk

Our Approach: Embed highly detailed computational hurricane models in large-scale conditions produced by climate analyses or climate models. Generate 1000 -100, 000 events Emanuel, K. , R. Sundararajan, and J. Williams, 2008: Hurricanes and global warming: Results from downscaling IPCC AR 4 simulations. Bull. Amer. Meteor. Soc, , 89, 347 -367

Sample Storm Wind Swath
")
Accumulated Rainfall (mm)
 SLOSH model (Jelesnianski et al. 1992) SLOSH mesh ~")
Storm Surge Simulation (Ning Lin) SLOSH model (Jelesnianski et al. 1992) SLOSH mesh ~ 103 m ADCIRC mesh ~ 102 m Battery ADCIRC model (Luettich et al. 1992) ADCIRC mesh ~ 10 m (Colle et al. 2008)

Surge Return Periods for The Battery, New York Sandy

A Grey Swan: Dubai Lin, N. and K. Emanuel, 2015: Grey swan tropical cyclones. Nature Clim. Change, doi: 10. 1038/NCLIMATE 2777

Return Periods

Projections of Global TC Power Dissipation using 6 CMIP 5 Climate Models Emanuel, K. A. , 2013: Downscaling CMIP 5 climate models shows increased tropical cyclone activity over the 21 st century. Proc. Nat. Acad. Sci. , 110, doi/10. 1073/pnas. 1301293110

Eocene hurricane making landfall in the Yukon

GCM flood height return level, Battery, Manhattan (assuming SLR of 1 m for the future climate ) Black: Current climate (1981 -2000) Blue: A 1 B future climate (2081 -2100) Red: A 1 B future climate (2081 -2100) with R 0 increased by 10% and Rm increased by 21% Lin, N. , K. Emanuel, M. Oppenheimer, and E. Vanmarcke, 2012: Physically based assessment of hurricane surge threat under climate change. Nature Clim. Change, doi: 10. 1038/nclimate 1389

Hurricanes Passing within 150 km of Boston Downscaled from 5 climate models

Surge Risk

Surge Risk with 1 meter sea level rise

Rain Risk

Sea level rise + changing storms Sea level rise alone From: American Climate Prospectus Economic Risks in the United States

TC Intensity Forecast Nightmares

56 knots/24 hrs 120 knots/24 hrs

History is too short, sparse, and imperfect to estimate hurricane risk Better estimates can be made by downscaling hurricane activity from climatological or global model output Hurricanes clearly vary with climate and there is a decided risk that hurricane threats will increase over this century

Human Adaptation: Century Time Scales Current and Future Probability Density of U. S. Damages, MIROC Model Current and Future Damage Probability, MIROC Model
- Slides: 53