Trend of Rice Consumption in Japan Kobe University

Trend of Rice Consumption in Japan Kobe University Kako, Toshiyuki
 ② Rice surplus phase(1968~")
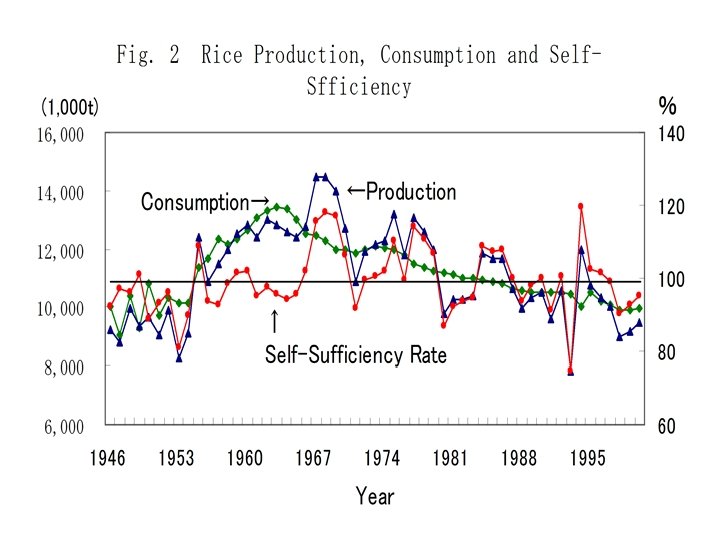
Three Phases of Rice Economy ① Rice shortage phase(1945~ 67) ② Rice surplus phase(1968~ ) ③ Rice trade liberalization phase (1995~ )

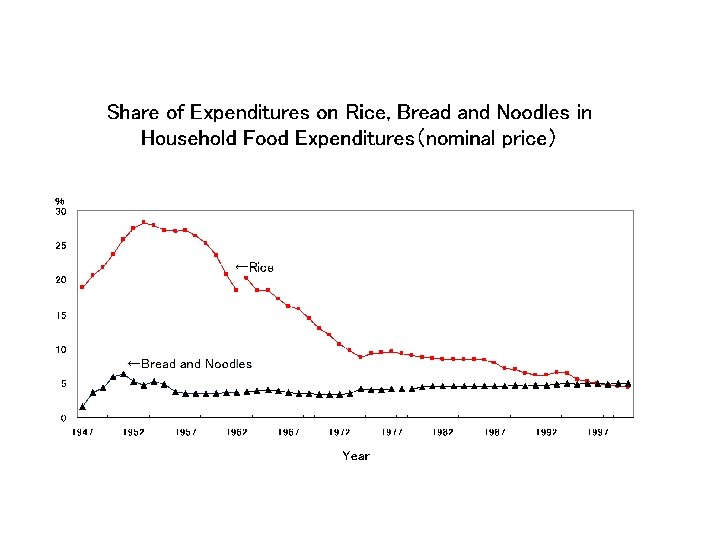
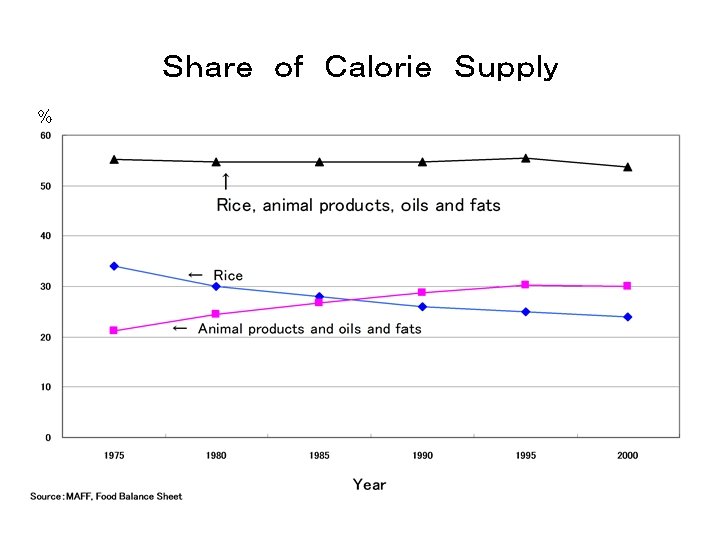
Position of Rice in Japanese Agriculture Year 1960 1970 1980 1990 2000 Proportion of rice planted area in total planted area 40. 7 46. 3 41. 7 38. 8 38. 9 Proportion of rice output in total agricultural output 47. 4 37. 9 30. 0 27. 8 25. 5 Proportion of rice revenue in total agricultural revenue of farm household 49. 9 38. 0 29. 1 28. 6 27. 5 Proportion of calorie supply from rice in total daily per capita calorie supply 48. 3 36. 7 30. 1 25. 9 23. 8 Proportion of expenditures on rice in household food expenditures Proportion of expenditures on rice in household consumption expenditures 23. 6 12. 9 8. 7 6. 5 4. 5 10. 3 4. 3 2. 5 1. 6 1. 1
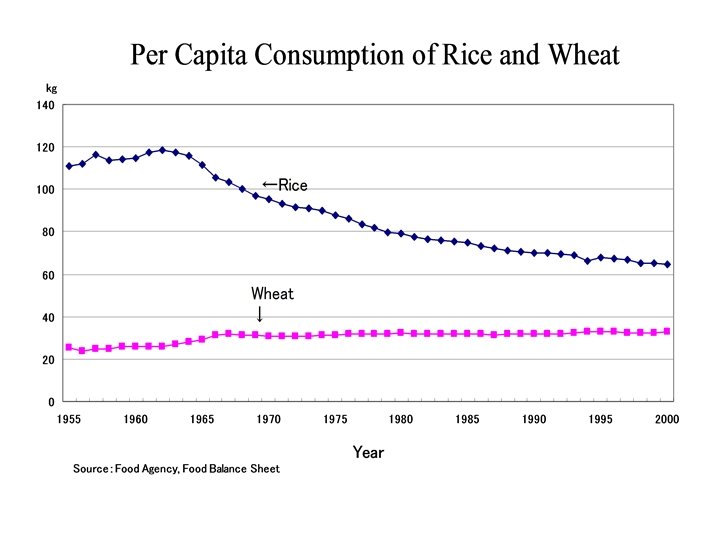

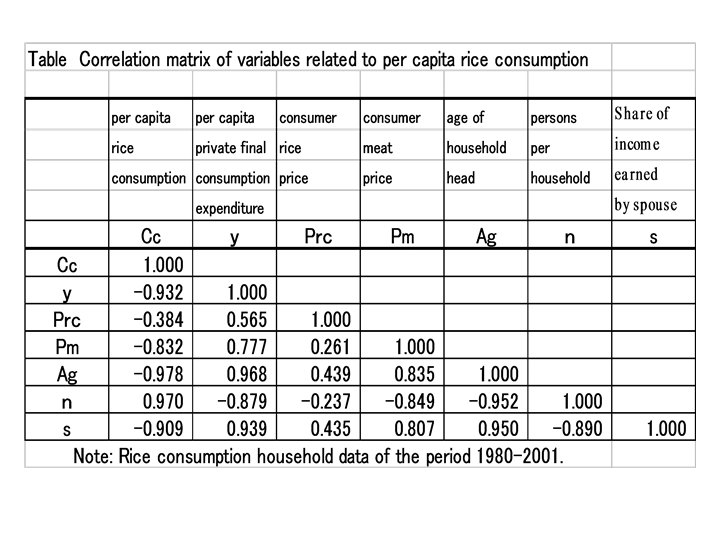
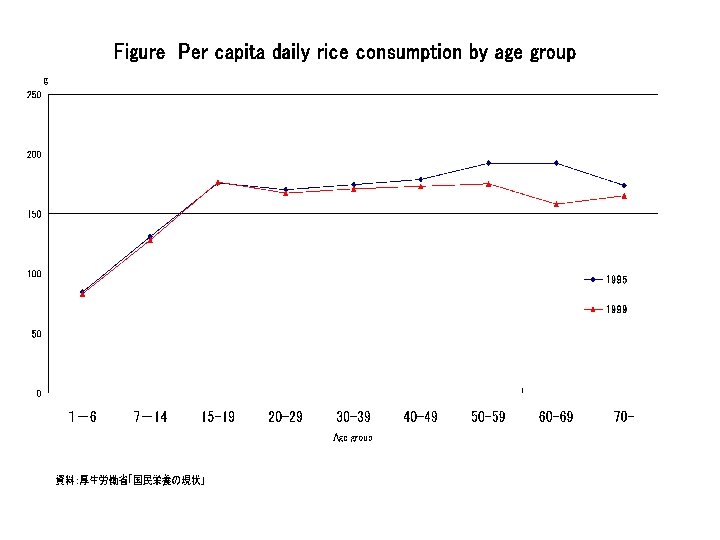
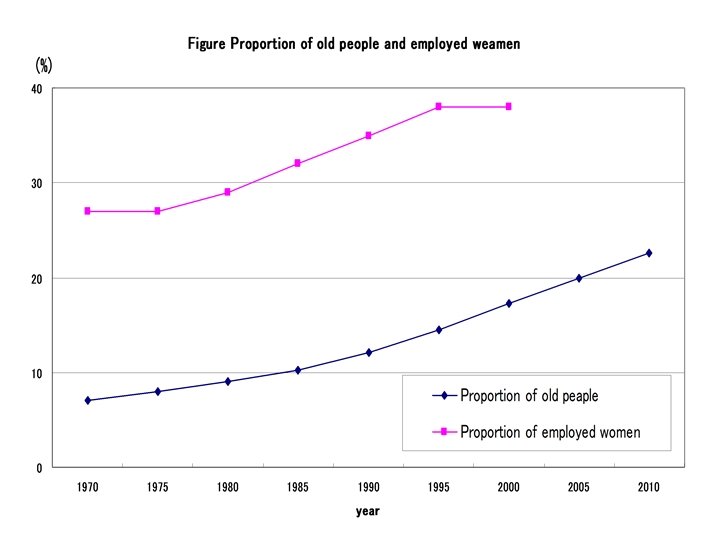
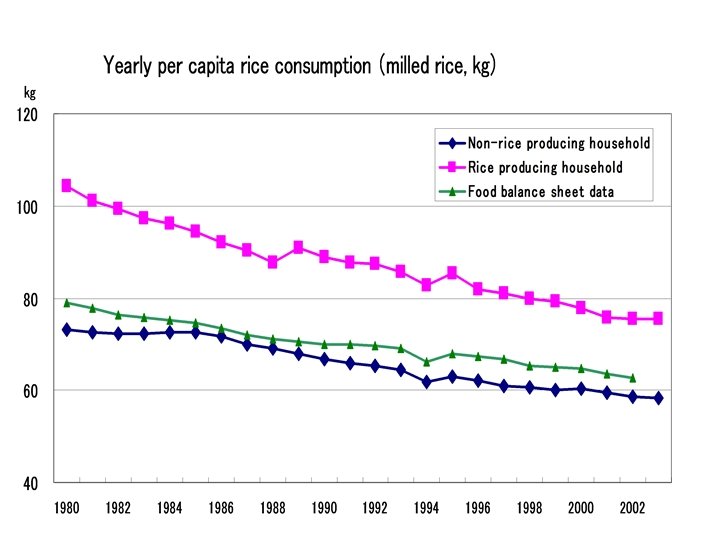
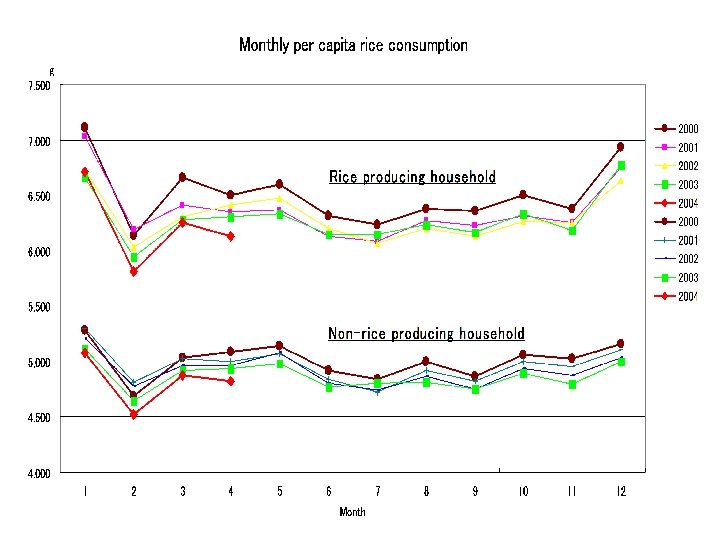
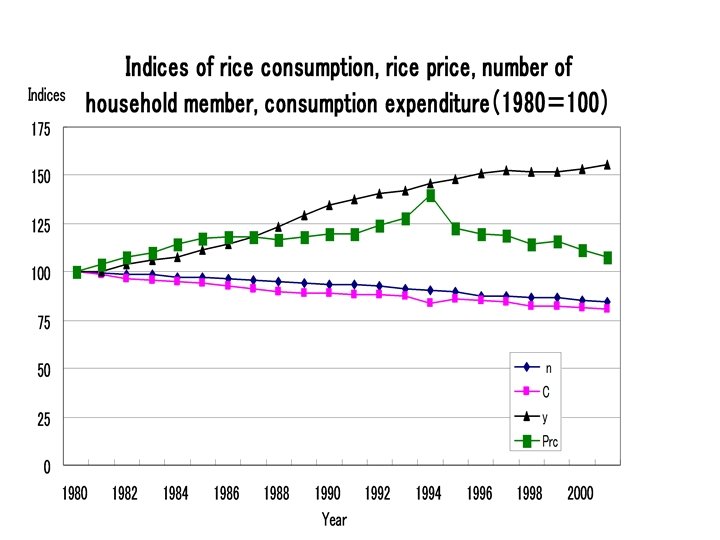
Factors influencing rice consumption level • • • Consumer rice prices Consumption expenditure Change in dietary habits: westernization Aging of population Decline of family size Increasing participation rate of women in labor market • Declining share of farm households
 Ln C = 4. 600")
Estimation result of per capita rice demand function (1980-2001年) Ln C = 4. 600 - 0. 200 Lny + 0. 557 Lnn (10. 385)(-3. 950) (3. 854) R 2=0. 964 c : per capita rice consumption y :Per capita private final consumption expenditure n : Number of person per household

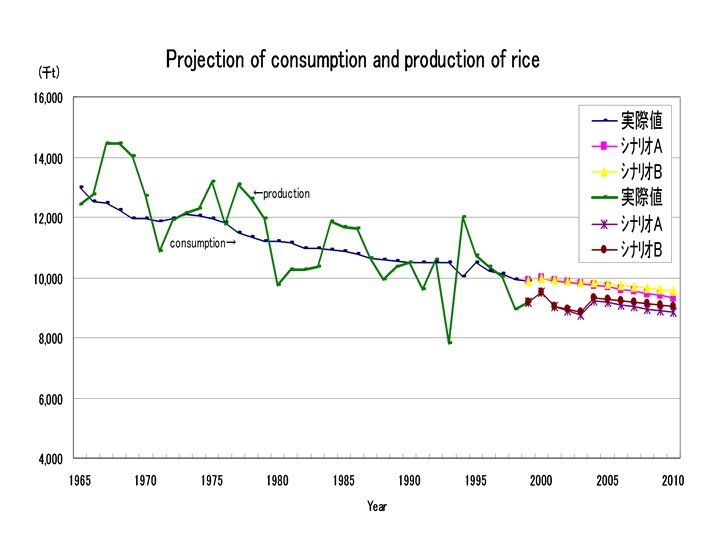
Projection of Rice Demand Assumptions on the rate of change of exogenous variables (Data: 1996 -2001) 1. Per capita private final consumption expenditure: 0. 4% 2. Number of person per household: -0. 8% Lny = 5. 411 + 0. 004 t R 2=0. 60 (994. 975)(2. 927) Lnn = 1. 219 - 0. 0076 t R 2=0. 907 (288. 105)(-7. 048)
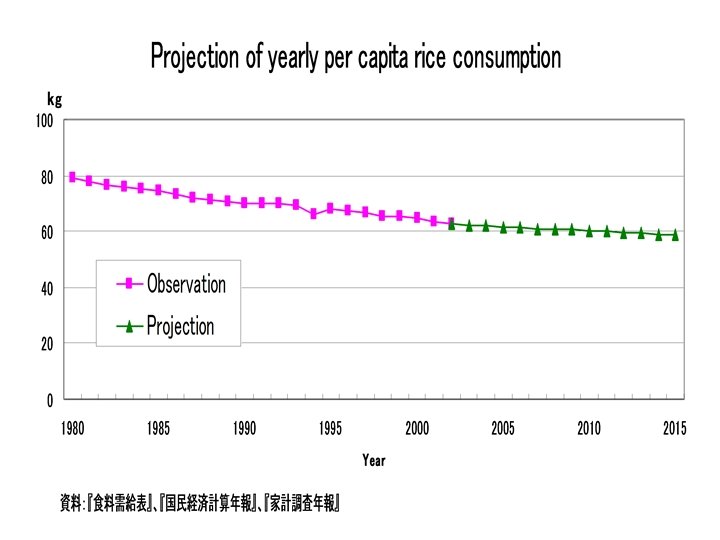

Projection results of table rice demand in 2010 and desirable figures described in the Basic Plan of Food, Agriculture, and Rural Areas Desirable figures Projection result described in Basic Plan of Food, Agriculture, and Rural Areas Total Domestic supply (brown rice) 9. 06 million t 8. 46 million t Annual per capita rice supply (milled rice) 66. 0 kg 60. 2 kg
- Slides: 20