Treatment of Richard Mine Acid Mine Drainage Project


- Slides: 38

Treatment of Richard Mine Acid Mine Drainage Project 2010 West Virginia Mine Drainage Task Force Symposium Morgantown, West Virginia March 31, 2010

| 2 Introduction – GAI was retained by the West Virginia Conservation Agency, Monongahela Conservation District with the US Department of Interior, Natural Resources Conservation Service as a review agency to perform this project: + WVCA – Mike Sykes + NRCS – TJ Burr, P. E. + GAI Consultants, Inc. – James Hemme, P. E. , L. R. S. + GAI Consultants, Inc. – Charles Straley, P. E. , P. S.

| 3 Richard Mine Location/Background + Originates from the abandoned + + underground coal mine in the Lower Freeport Coal located near Morgantown, West Virginia in the Deckers Creek Watershed Deckers Creek is a tributary of the Monongahela River. The primary discharge is located in the community of Richard, near the Intersection of Interstate 68 and State Route 7, southeast of Morgantown.

| 4 Richard Mine Location/Background Source Date Discharge (gpm) p. H Acidity Conc. (mg/L) Load (lb/day) Al Conc. (mg/L) Load (lb/day) Fe 3+(%) Mn Conc. (mg/L) Load (lb/day) NRCS 10/23/1997 150 2. 9 628 1132 84 151 147 265 17% 3. 2 6 11/21/1997 6/25/1999 7/15/1999 8/17/1999 9/23/1999 150 135 136 122 138 3. 1 3. 59 3. 55 3. 63 818 1020 1210 1140 1250 1475 1658 1978 1674 2076 46 95 88 78 61 83 155 143 115 101 171 114 201 205 209 308 185 329 301 346 15% Stewart and Skousen 3. 7 4. 3 3. 9 7 7 7 6 6 10/25/1999 120 3. 95 1145 1657 62 90 193 279 3. 9 6 11/20/1999 101 3. 96 1024 1243 68 83 218 265 4. 5 5 12/21/1999 1/31/2000 2/24/2000 3/31/2000 4/25/2000 5/24/2000 6/21/2000 7/26/2000 8/24/2000 9/20/2000 98 135 4. 07 4. 15 3. 97 3. 89 3. 66 4. 2 3. 48 3. 58 3. 89 3. 97 998 1040 618 881 885 650 930 917 1017 1297 1178 1683 60 62 60 55 80 82 72 82 71 63 71 100 200 182 115 96 148 190 176 172 178 167 236 294 3. 9 3. 6 3. 1 2. 7 3. 5 4. 5 3. 7 3. 8 3. 9 3. 6 5 6 10/29/2001 10/3/2001 WVDEP 5/6/2003 6/6/2005 Mack 1/13/2006 and 2/1/2006 Skousen 2/10/2006 2/17/2006 3/16/2006 4/2/2006 4/14/2006 GAI 6/15/2006 Mininum Maximum Average 214 78 76 68 73 57 60 200 68 57 57 48 68 46 95 68 615 406 282 332 308 71 615 226 Christ 122 123 572 233 336 224 310 260 735 NM 794 754 594 412 576 377 98 794 305 4. 1 4. 2 3. 9 3. 77 NM 3. 7 3. 95 4. 2 4. 3 3. 79 2. 9 4. 3 4 1289 1313 4468 2605 4105 3491 930 2391 791 866 3224 595 1861 922 8132 673 NO LAB DATA RECEIVED 799 7229 810 5774 965 4771 826 5709 667 3018 595 1132 1297 8132 907 3005 81 119 567 202 286 170 257 227 503 233 204 180 174 151 156 164 140 147 136 179 96 233 171 140 220 1304 493 719 448 600 678 544 1332 1484 998 727 940 810 1484 570 12% 4% 36% - 4% 36% 0 4 5 31 10 16 10 5 5. 1 3. 4 3. 7 10. 2 3. 3 13 3. 57 2. 91 3. 12 2. 84 3. 2 2. 7 10. 2 4 32 21 15 20 14 4 90 15 13 11 90

| 5 Richard Mine Location/Background + The Richard Mine delivers the single greatest AMD contribution to Deckers Creek in its entire length. It loads Deckers Creek with Aluminum, Iron and Manganese at rates of 59, 000, 143, 000 and 3, 200 lbs/yr, respectively. + The primary discharge from the Richard Mine contributes a relatively small amount of flow compared to the flow in Deckers Creek. + Measurements of the flow from the Richard Mine range from 0. 22 to 1. 77 cfs with an average less than 0. 7 cfs, whereas estimates for the flow of Deckers Creek under the bridge at Dellslow, just upstream of the Richard Mine discharge, range from 1. 9 to 119 cfs

| 6 Richard Mine Location/Background + The aluminum and the ferric iron contributed by the primary discharge rapidly precipitate in the stream bed as a result of the oxidation reactions. + The heavy multicolored precipitates are responsible for diminishing aquatic habitat and limiting stream uses in this reach.

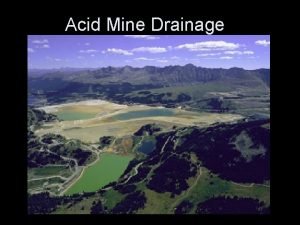
| 7 Richard Mine Location/Background + The abrupt change in appearance in Deckers Creek at its confluence with the primary discharge for Richard Mine is evidence of the dramatic change in the streams chemistry.

| 8 Project Goals + The goal of the Project is to + implement a solution that will result in improved water quality in Deckers Creek and possibly allow it to be suitable for sustaining warm water fish and other aquatic life. By analyzing the AMD associated with the primary discharge, it is then possible to develop a comprehensive list of alternatives to potentially mitigate the AMD problem.

| 9 Evaluation Report + Comprises of a compilation of data from the review as well as an + evaluation/ assessment of the data for completeness and application to the Project. The purpose of the Project is to identify treatment alternatives for the AMD problem, and to design a construction project to potentially reduce / eliminate the AMD contaminated water from entering Deckers Creek or to improve the water quality of the AMD so that it does not degrade the water quality in Deckers Creek.

| 10 Geologic Setting + The geology of the Deckers + + Creek watershed is part of the Pennsylvanian Period, namely the Monongahela, Conemaugh, and Pottsville Groups and the Allegheny Formation. The dominant rock types include sandstone, siltstone, shale, limestone, and coal. The mined coal interval is the Upper Freeport Coal.

| 11 Geologic Setting + The primary discharge is located 1 -1/2 miles southeast of the + + + Connelsville Uniontown Syncline. The rock dips to the northwest at approximately 565 feet per mile. The Upper Freeport coal in the Richard Mine is only four feet high and lies at a relatively steep slope of approximately 8 percent. The Upper Freeport Coal seam is the topmost strata of the Allegheny Formation of the Pennsylvania System. The overlying strata in the Conemaugh Group contains several massive sandstones and some shales. Limestone or alkaline-bearing rock units are not generally found within 50 meters above the Upper Freeport Coal in this area.

| 12 Mining Discussion

| 13 Hydraulics and Hydrology + A hydrology and hydraulics evaluation of the mine area was + + performed in order to characterize potential inflow and outflow points. The intent of this evaluation is to provide insight into the possible source(s) of water infiltrating the mine and locations of discharge other than the primary discharge. Having an understanding of where the water within the mine originates and culminates allows for a better comprehension of the impacts of the water. The Upper Freeport Coal seam outcrops along the eastern and southern portion of the mine workings and is significantly below drainage as the mine workings progress to the West.

| 14 Hydraulics and Hydrology + On the western edge of the mine workings, the coal seam is at + + approximate elevation of 700 to 750 feet which is approximately 300 to 400 feet below the ground surface. The water elevation of Cheat Lake is approximately 870 feet and the Monongahela River is at approximate elevation 814 feet. These elevations are lower than the closest portion of the mine workings. Therefore, it is unlikely that they have any effect on the mine drainage. A portion (approximately one-half of the mine workings area) has a local dip to the South. Thus, a mine discharge occurs along the southern edge of the mine workings (i. e. , at the primary discharge).

| 15 Hydraulics and Hydrology + “Rules of thumb” are often used to assess the reasonableness of + + + the yield relationship. Typically, the anticipated range of values would be from 0. 25 gallon/minute/mine acre to 2. 0 gallon/minute/mine acre in high flow situations. The area of the Richard Mine and associated documented adjacent mining encompasses approximately 2, 200 acres. Utilizing the 0. 25 gpm/acre flow value, it could be anticipated that the flow rate in the mine from infiltration would be 550 gpm.

| 16 Hydraulics and Hydrology + The primary discharge constitutes over 90% - 95% of the flow + + + from the Richard Mine (based upon visual observations of the mining limits). The range of flow from the primary discharge is 98 gpm to 794 gpm. The anticipated infiltration rate compared to the primary discharge flow rates confirms the previous assessment that the surface waters overlying the Richard Mine are not contributing to the flow from the mine. The flow from the Richard Mine is well within the range of the anticipated flow from infiltration.

| 17 Water Quality Analysis + Characterization of the primary discharge from the Richard Mine + + + is critical. The mine water at the seal is in an anoxic state with only a limited concentration of dissolved oxygen, making it amenable to some form of amelioration by sulfate reducing bacterial, were the flow much smaller and area available. This characteristic also is amenable to pumping the mine pool to prevent a gravity discharge. Pumping the pool is preferable to collecting the flow after discharge in that it minimizes the dissolved oxygen in the associated pipes and reduces maintenance.

| 18 Treatment Alternatives + A cursory review of a partial list of treatment technologies + + permits the evaluation of the adequacy of the data. A detailed analysis of the technologies / alternatives was conducted during subsequent phases of the Project. A bench scale test was conducted to provide additional data pertaining to the primary discharge.

| 19 Conclusions + The intentions of the “Evaluation Report” were to compile the + + available data into a concise source, provide some insight to the possibility of treatment of the AMD from the Richard Mine, and evaluate the adequacy of the data. Due to the lack of subsurface information on the Richard Mine, more detailed studies would need to be conducted, including but not limited to, mine pool elevation investigation and actual coal elevation and dip studies. The flow rate of the primary discharge and other discharges should be monitored on a consistent basis to determine which of the data is representative of the discharge.

| 20 Conclusions + The combination of the evaluation report and the bench scale + testing provides the basis needed to conduct an alternative analysis for the potential reduction / elimination of the AMD discharge from the Richard Mine. The next phase of the project , “Compilation of AMD Treatment Alternatives, ” will provide the detailed information required for a determination of options for treatment of the AMD from the Richard Mine.

| 21 Flow Monitoring Study

| 22 General Location Map

| 23 Flow Rate vs. p. H Richard Mine 2008 Hi-lighted areas signify poor data due to equipment issues

| 24 Flow Rate vs. Temp. Richard Mine 2008 Hi-lighted area shows inaccurate data as the probe was exposed to air

| 25 Flow vs Rain Gage 1

| 26 Flow vs Rain Gage 2

| 27 Flow vs Morgantown Locks and Dam Gage

| 28 Flow vs Morgantown Airport Rainfall Gage

| 29 Flow vs Average Rainfall (4 gages)

| 30 Rainfall Comparison

| 31 Rainfall Comparison + June and July spike in precipitation June 4 th – 0. 47” of rain followed by June 5 th with 1. 40” June 14 th – 0. 72” followed by June 15 th with 1. 40” July 4 th – 1. 0” followed by July 5 th with 2. 27” July 21 st – 0. 83” followed by 0. 72”, 1. 13” and 0. 70” on 22 nd to 24 th. + Precipitation spike with no increase in flow. Runoff? Evapotranspiration?

| 32 Infiltration Discussion + The 1900 acre footprint consists of: Ø 800 acres of Woodland in Good Condition Ø 900 acres of Meadow, Pasture or Open Space Ø 200 acres of Residential Development (1/2 acre lots) + + Surface Topography: 4% to 25% slopes – Headwater Area Steep Cliffs on East and South Side Geologic Fault to the North Dip to the Northwest

| 33 Infiltration Discussion + Approximately a 40/60 split of Type B and Type C Soils on the surface above the mine. + Type B – Silt/clay/sandy loams or silty sands that have moderate runoff potential and moderate infiltration. Typically more than 6 feet to bedrock in this region + Type C – Sandy or silty clays that have high runoff potential and low infiltration rates. Typically bedrock is less than 6 feet below the surface in this region.

| 34 General Mine Data + Footprint of Mine = 1900 acres +/- (2. 96 square miles) + Draining Toward Primary Outlet = 1500 acres +/- (2. 34 sq. mi. ) + Footprint of Mine Pool = 800 acres +/- (1. 25 sq. mi. ) + Volume of Mine Pool = 782 million gallons +/+ Volume per Foot of Elevation = 4. 8 million gallons +/+ Average Slope of Mine Floor = 8 -10% (est from mapping)

| 35 Discussion of Flow Rates for 2008 + Average = 401 gallons per minute or 0. 89 cubic feet/second + Minimum = 167 gpm (Nov 11) or 0. 37 cubic feet/second + Maximum = 662 gpm (Feb 15) or 1. 48 cubic feet/second General Rule of Thumb for Base Flow from Infiltration has been 0. 25 gpm/acre to 2. 0 gpm/acre. Average Flow = 401 gpm/1500 acres = 0. 26 gpm/acre Minimum Flow = 0. 11 gpm/acre Maximum Flow = 0. 44 gpm/acre

| 36 Extrapolations from 2008 Data q Average Flow Rate = 401 gallons per minute Yearly Volume = 401 gpm x 60 min/hr x 24 hr/day x 365 days/ yr = 210, 765, 600 gallons per year q Rainfall (Avg. of 4 stations) = 44. 78 inches Volume to Rainfall Ratio = 210, 765, 600 gallons / 44. 78 inches = 4, 706, 690 gallons per inch of rainfall

| 37 Extrapolations from 2008 Data q Mine Surface Area = 1500 acres Unit Area per Inch = 4, 706, 690 gallons/inch / 1500 acres = 3138 gallons/inch/acre (3630 gal/in/ac is 100% infiltration) = (for the year 85% infiltration/evapotranspiration, 15% runoff) q Average Rainfall = 43 inches Yearly Unit Area Production = 3138 gal/ac/in x 43 inches = 134, 934 gallons/acre/year

| 38 Questions/Comments Thank You! You
 Which of the following best describes acid mine drainage?
 Porphyria's lover
 Looking for richard
 9-which acid is not considered a strong acid?
 Acid fast vs non acid fast
 Alcohol and anhydride reaction
 Acid fast vs non acid fast
 Lewis acid vs bronsted acid
 Lewis acid bronsted acid
 7 strong acids
 Hcl lewis acid or base
 What is h3o+ acid or base
 Stomach acid vs battery acid
 Nitrile to acid chloride
 Outputs of a drainage basin
 Venous drainage
 Quantity of sanitary sewage
 2 pipe system
 Styloglossus
 Manybrium
 Sangineous
 Cliff regrading and drainage
 Drainage basin system
 Hydrograph
 Golf green drainage system
 Portal and caval venous system
 Lukas sturm
 Pituitary gland nerve supply
 Customer drainage
 Continental drainage systems
 Pleural biopsy
 Pleural fluid light criteria
 Costomediastinal recess
 Inferior surface of the heart
 Middle meatus drainage
 Nasal cavity
 Posisi postural drainage
 Lymphatic drainage abdomen
 Posterior arch vein


