TRANSPORTATION Energy Use By Sector Electric Utilities 40

TRANSPORTATION
 Transportation 28% (1/3) Industrial/Residential And Commercial")
Energy Use By Sector Electric Utilities 40% (1/3) Transportation 28% (1/3) Industrial/Residential And Commercial 32% (1/3)

Transportation ►One of the three basic energy use sectors. § Electric Utilities § Transportation § Industrial, Residential, and Commercial ►Important for people and for goods. ►Changes in transportation costs can affect the cost of just about everything.

Do you use the free bus service provided by ISU? Frequently B. Occasionally C. Not at all A.

Do you have a car at ISU? Yes B. No A.

► There approximately 200, 000 cars trucks and buses in the US. ► Each one has a parking space at each end of a trip ► Taken together, roads and parking account for approximately 1% of the land surface of the US. This is an area approximately equal to Indiana. ► Transportation use almost 70% of the total petroleum used in the US.

Fuel Source for Transportation

Energy Density of Various Fuels Storage Type Gasoline Natural Gas Ni. MH battery Lead Acid Battery Li Ion Battery Hydrogen Antimatter Energy Density (MJ/kg) 46. 4 53. 6 0. 25 0. 14 0. 46 to 0. 72 143 89, 876, 000

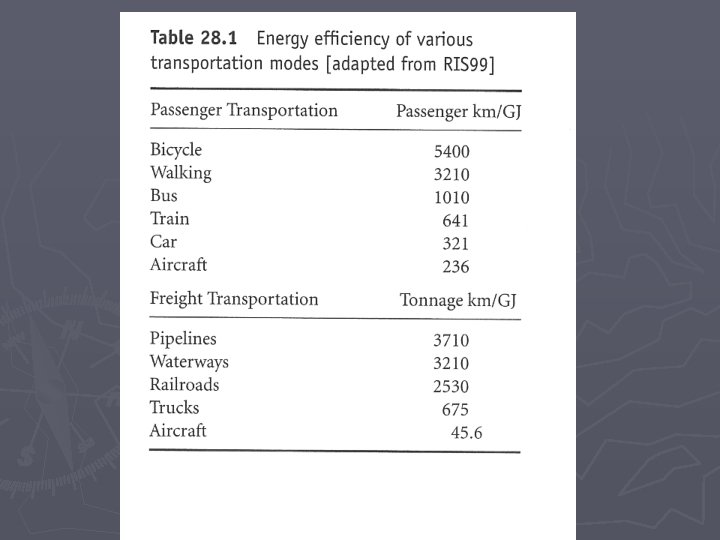
Percentage of Energy for Different Transport Modes

Forces on a Moving Vehicle

Energy usage in a typical car Heat losses in water and exhaust are due to 2 nd Law (Carnot efficiencies)

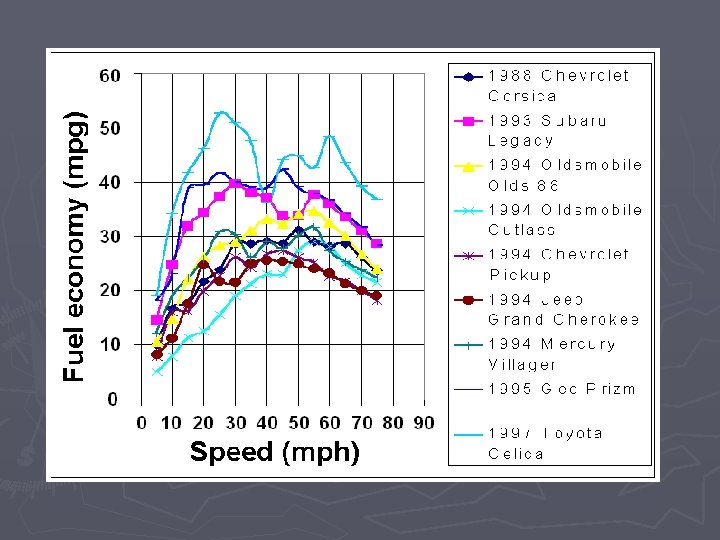
How Can We Reduce Forces ►Ftot=Fa + Fh + Fr + Fad ►Don’t go up hills. (Works around here. ) ►Go at constant speeds. ►Improve engineering (reduce Cr & CD. ) ►Reduce mass.

Power

Aerodynamic Drag

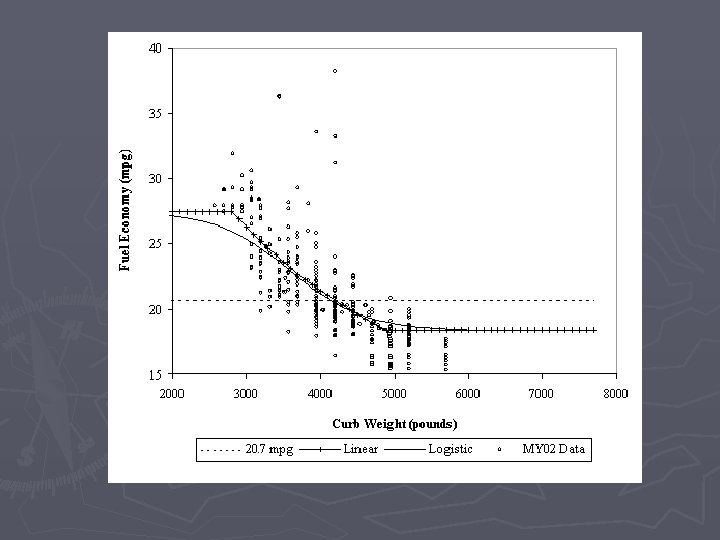
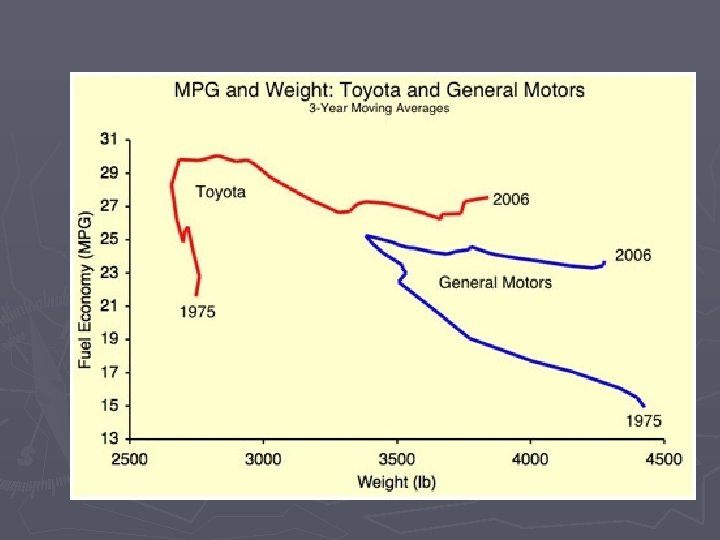
Aerodynamic Drag ► Aerodynamic drag depends on shape and speed ► All other forces depend on mass ► Reduce mass reduce force opposing motion increase economy

2. 1 - a smooth brick 0. 9 - a typical bicycle plus cyclist 0. 57 - Hummer H 2, 2003 0. 51 - Citroën 2 CV 0. 42 - Lamborghini Countach, 1974 0. 36 - Ferrari Testarossa, 1986 0. 34 - Chevrolet Caprice, 1994 -1996 0. 34 - Chevrolet Corvette Z 06, 2006 0. 338 - Chevrolet Camaro, 1995 0. 33 - Audi A 3, 2006 0. 29 - Subaru XT, 1985 0. 29 - BMW 8 -Series, 1989 0. 29 - Porsche Boxster, 2005 0. 29 - Chevrolet Corvette, 2005 0. 29 - Mercedes-Benz W 203 C-Class Coupe, 2001 - 2007 0. 28 - Toyota Camry and sister model Lexus ES, 2005 0. 28 - Porsche 997, 2004 0. 27 - Toyota Camry Hybrid, 2007 0. 26 - Toyota Prius, 2004 0. 25 - Honda Insight, 1999 0. 24 - Audi A 2 1. 2 TDI, 2001 0. 195 - General Motors EV 1, 1996 0. 137 - Ford Probe V prototype, 1985 Automobile_drag_coefficient

All other forces depend on mass

► Reduce mass reduce safety

Corporate Average Fuel Economy First enacted by Congress in 1975, the purpose of CAFE is to reduce energy consumption by increasing the fuel economy of cars and light trucks.

CAFE TESTING The city and highway tests are currently performed under mild climate conditions (75 degrees F) and include acceleration rates and driving speeds that EPA believes are generally lower than those used by drivers in the real world. Neither test is run while using accessories, such as air conditioning. The highway test has a top speed of 60 miles per hour, and an average speed of only 48 miles per hour.

Maximum Load ► The power that an engine can provide depends on the engine rpm. ► The greatest power an engine can provide at a given rpm in the maximum load for that rpm.

Maximum Load ► The power that an engine can provide depends on the engine rpm. The maximum load is the maximum power that the engine can generate at a given speed: e. g. at 3000 rpm, the max load is 100 hp.

Efficiency vs. Max Load ► Engine are most efficient when they are running near max load.

Efficiency vs. Maximum Load ► Engine are most efficient when they are running near their maximum load. ► Maximum load is often not needed to cruise at a given speed ► More power is needed to accelerate and to run accessories.

Example of the effects of an overpowered car ► Previous slides are for a typical 3500 lb car. ► At 70 mph the power required is 25 hp and the engine is running at 3000 rpm. ► The max load at 3000 rpm is 100 hp thus we have a partial load of only 0. 25 and thus our efficiency is only 19%. ► If we use a smaller engine our partial load increases and we get better efficiency ► If we use a more powerful engine, the partial load is decreases and we get worse efficiency.

Techniques to improve efficiency ► Only use some of the cylinders when cruising. Others engage when you need more power. ► Use two engines: example Hybrid cars that combine gas and electric motors. ,

Techniques to improve efficiency ► Only use some of the cylinders when cruising. Others engage when you need more power. ► Use two engines: example Hybrid cars that combine gas and electric motors. , ► The Stirling cycle engine has the highest theoretical efficiency of any thermal engine
- Slides: 31