Transparent metaanalysis a powerful tool for the researchers


 Search criteria and protocol Initial search Refine questions/search criteria Full")


 that includes the sign")
 Data reported as a test statistics")
 Data reported as means + error")
![. (c) Incidence of 2 outcomes (contingency table) r= Zr=0. 5 ln[(1+r)/(1 r)] S.](https://slidetodoc.com/presentation_image_h/060f77cd8f720ea2703cc11a68b8cadf/image-17.jpg ". (c) Incidence of 2 outcomes (contingency table) r= Zr=0. 5 ln[(1+r)/(1 r)] S.")
 philogenetic (can now be accounted in some packages: metafor, MCMCglmm 2) more")
 study/species effects 2) other")


) ###### LOADING all the libaries library(MCMCglmm) library(ape) ##### load dataset, phyl tree #")


- Slides: 29
Transparent meta-analysis a powerful tool for the researchers' toolbox Antica Culina, NIOO research days, 8 Nov 2017
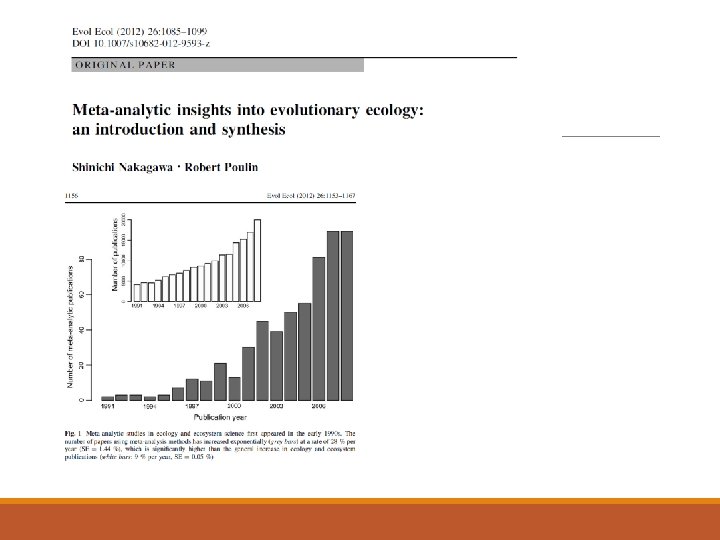
What is Meta-analysis? Ø statistically rigorous synthesis of research conducted on a certain topic Ø effects detected by each study are combined into one analysis Ø takes sampling error into account
What can MA do? Ø weight the overall evidence for the effect of interest Ø test for biological drivers of observed patterns Ø identify methodological flaws (e. g. study design) Ø guide/inform future research, inventions, policies…
Ø search for studies Collect data Øscreen studies Øextract info needed for effect size Øcontact the authors Calculate effect sizes Statitica l analysis Øcalculate r Øtransform it to Zr Øcalculate the variance Ørandom effects: control for dependencies Øheterogeneity in ES: biological and methodological moderators Øtest and correct for biases ANTICA CULINA, #SCIDATA 16, 26 OCT 2016 5
Formulate clear research question(s) Search criteria and protocol Initial search Refine questions/search criteria Full search Enough data?
Formulate a clear research qestion/scope/inclusion-exclusion criteria Lets practice! Ø Overal evidence, test for a certain effect/effects, braking down one main question/hypothesis into several Ø Study design? Ø Scope: geographical region, experiments vs observational, species, system…………………. Ø What is the causal/response variable(s)? Ø What other variables to include? 20 MIN
Conduct search and refine Ø What are my search terms? ØWhere will I search? Comprehensive search, minimise bias
Conduct search and refine 20 MIN
Read the abstracts Exclude irrelevant, record! Read the full text Exclude irrelevant, record! Extract data needed to calculate the effect size + other vairables of interest Contact the authors if needed Exclude problematic, record! Final list of studies Enough data?
PRIZMA diagram
Effect size = a common meausre of an outcome (effect) that includes the sign and the magnitude of an effect of interest Effect calculated using Effect size Means of two goups Cohen’s d; Hedges’ d and g Relationship/correlation Fisher’s Zr Incidence of two outcomes ln. OR
(a) Data reported as a test statistics
(b) Data reported as means + error
. (c) Incidence of 2 outcomes (contingency table) r= Zr=0. 5 ln[(1+r)/(1 r)] S. E. =1/
Non-independence 1) philogenetic (can now be accounted in some packages: metafor, MCMCglmm 2) more effect sizes within one study
Testing for heterogeniety Different views on this Think about: 1) study/species effects 2) other moderators
Publication bias
Publication bias • • • Funnel plots Eggers regression coeficient Trim-and-fill Fail-safe number p-curve Year of publication Only half of the MA in ecology/evolution explore piblication bias!
What software to use
What package to use? - Identified 64 different packages!
rm(list=ls()) ###### LOADING all the libaries library(MCMCglmm) library(ape) ##### load dataset, phyl tree # defining priors for random effects prior 1 <- list(G=list(G 1=list(V=1, nu=0. 002)), R=list(V=1, nu=0. 002)) prior 2 <- list(G=list(G 1=list(V=1, nu=0. 002), G 2=list(V=1, nu=0. 002)), R=list(V=1, nu=0. 002)) BS <- MCMCglmm (Z~BS-1, random=~title+latin_name, mev=before$SE^2, ginverse=list(latin_name=Ainv), burnin=200000, nitt=2000000, prior=prior 2, data=before)
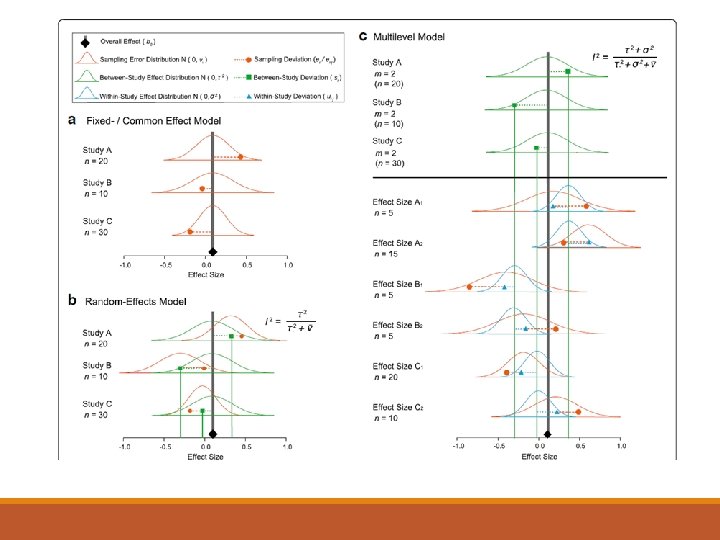
What MA model? 20 MIN
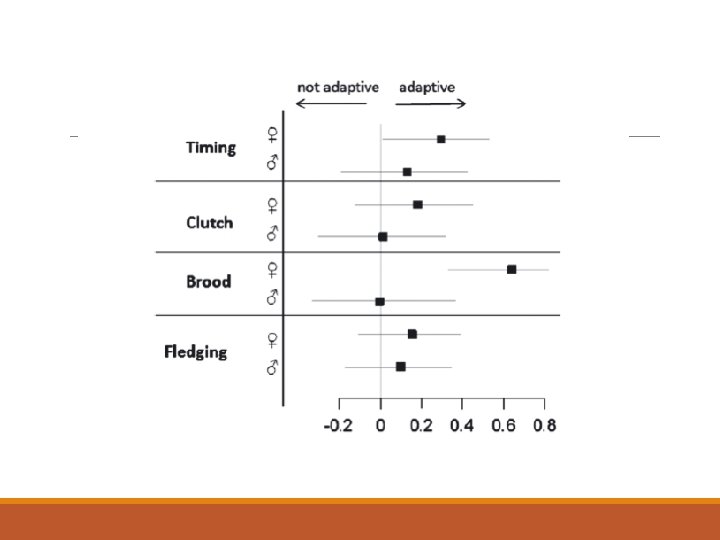
Interpreting results Ø Biological significance Ø What inferences can we make? Ø Biases?
Thats the start Will email you some literture