
Translating New Knowledge from Technology Based Research Projects
Translating New Knowledge from Technology Based Research Projects: Randomized Controlled Study of an Intervention Presenter: Vathsala I. Stone vstone@buffalo. edu University at Buffalo Center on Knowledge Translation for Technology Transfer http: //kt 4 tt. buffalo. edu AEA Annual Meeting, Nov. 5, 2011
Background Context: Knowledge Translation for Technology Transfer (KT 4 TT) • KT (CIHR, 2004; 2005; 2009; Sudsawad, 2007) Ø Problem: q Under-utilized Research (Weiss, 1979) ; q Accountability of funded Research (GPRA; Wholey et al, 2004) Ø Proposed solution: Research-to-practice • TT (Lane, 2003) Technology based R&D K Outputs Market Outcomes (products & services) Societal Impact (User Benefits) KT 4 TT: Links two processes to increase results (likelihood of impact). 2
KT 4 TT: Example related to Augmentative and Alternative Communication (AAC) technology Knowledge Output: Vocabulary and Symbol Sets for adult users of AAC (Bryen, 2008) Beneficiaries: Consumers with complex communication needs Expected Outcomes: • manufacturers – transform vocabulary for AAC machines ; • clinicians - fit AAC for consumers • brokers – facilitate use of AAC • policy makers –regulate the use of AAC • Researchers – advance the work. Impact: Improved function & quality of life for persons with disabilities. Key: Strategic Communication of New Knowledge to Stakeholders with potential to value and apply, to facilitate implementation and use to benefit society. 3
KT intervention studies: Purpose Problem: Sub-optimal demonstration of impact from R&D investment. Purpose: Develop and evaluate KT intervention strategies that are • feasible for use by technology R&D projects and • effective in increasing use of new knowledge • by potential users (stakeholders). K producers (technology grantees) can document evidence of impact from their project outputs Utility: 4
Relevance of the Study Funding agency: National Institute for Disability and Rehabilitation Research (NIDRR) Beneficiaries: Persons with Disabilities Knowledge Producers: NIDRR’s Technology grantees (R&D projects) – RERC on AAC Knowledge Users: (6 stakeholder groups) • Manufacturers; Clinicians; Transition Brokers; Researchers; Policy makers; Consumers with disabilities 5
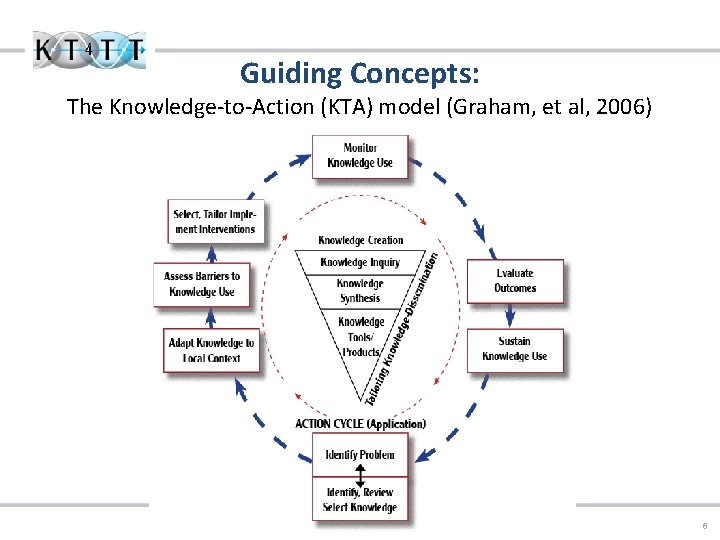
Guiding Concepts: The Knowledge-to-Action (KTA) model (Graham, et al, 2006) 6
Intervention: Key considerations • End-of-grant KT and Integrated KT by investigator Ø Study focus – NIDRR’s technology R&D project outputs • Target audience for Dissemination of K (KTA Step one) Ø Denominator in recommended practice (NIDRR/NCDDR) • Tailored K (Steps 2 -4 in KTA) ØContextualization • Communication Ø Accessible formats • Delivery Ø Multi modal channels (Sudsawad, 2007). 7
Intervention Targeted Dissemination of K (TDK) Through stakeholder affiliated organizations Ø Value mapping (Rogers, 2004; Lane and Rogers, 2011) (K user expectations and values regarding research) Ø Recruitment Targeted and Tailored Dissemination of K (TTDK) Ø Relevant audience targeted(as above) Ø Contextualized knowledge Packages (CKPs) Ø Formats of communication (accessible, usable) Ø Multi channel delivery – tailored webinar; tailored tech assistance offer 8
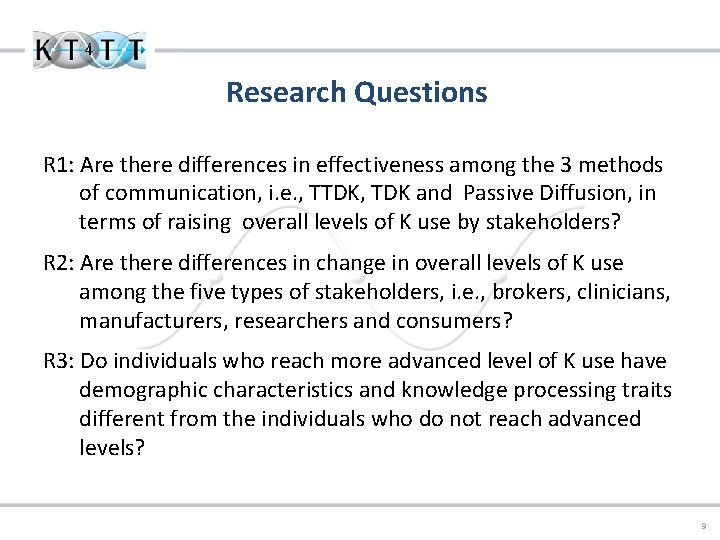
Research Questions R 1: Are there differences in effectiveness among the 3 methods of communication, i. e. , TTDK, TDK and Passive Diffusion, in terms of raising overall levels of K use by stakeholders? R 2: Are there differences in change in overall levels of K use among the five types of stakeholders, i. e. , brokers, clinicians, manufacturers, researchers and consumers? R 3: Do individuals who reach more advanced level of K use have demographic characteristics and knowledge processing traits different from the individuals who do not reach advanced levels? 9
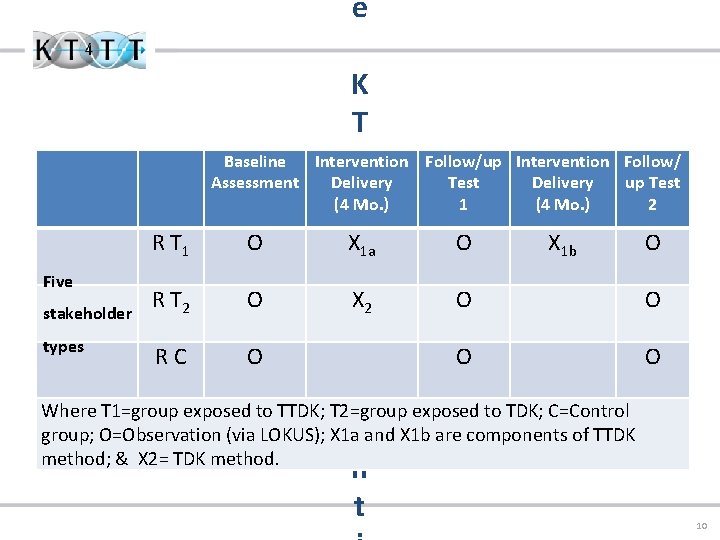
e K T Baseline Intervention Follow/up Intervention Follow/ Assessment Delivery Test Delivery up Test (4 Mo. ) 1 (4 Mo. ) 2 I R T 1 O Xn 1 a O X 1 b O t Five R T 2 O X 2 O O stakeholder e types r RC O O O v Where T 1=group exposed to TTDK; T 2=group exposed to TDK; C=Control group; O=Observation (via LOKUS); X 1 aeand X 1 b are components of TTDK method; & X 2= TDK method. n t 10
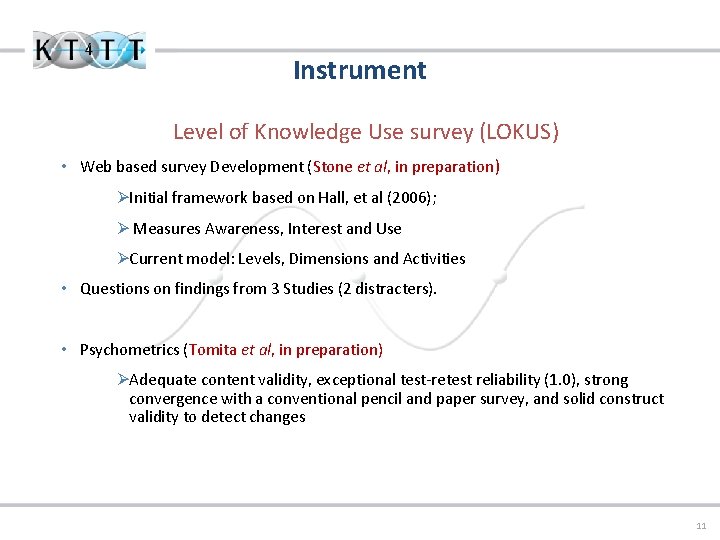
Instrument Level of Knowledge Use survey (LOKUS) • Web based survey Development (Stone et al, in preparation) ØInitial framework based on Hall, et al (2006); Ø Measures Awareness, Interest and Use ØCurrent model: Levels, Dimensions and Activities • Questions on findings from 3 Studies (2 distracters). • Psychometrics (Tomita et al, in preparation) ØAdequate content validity, exceptional test-retest reliability (1. 0), strong convergence with a conventional pencil and paper survey, and solid construct validity to detect changes 11
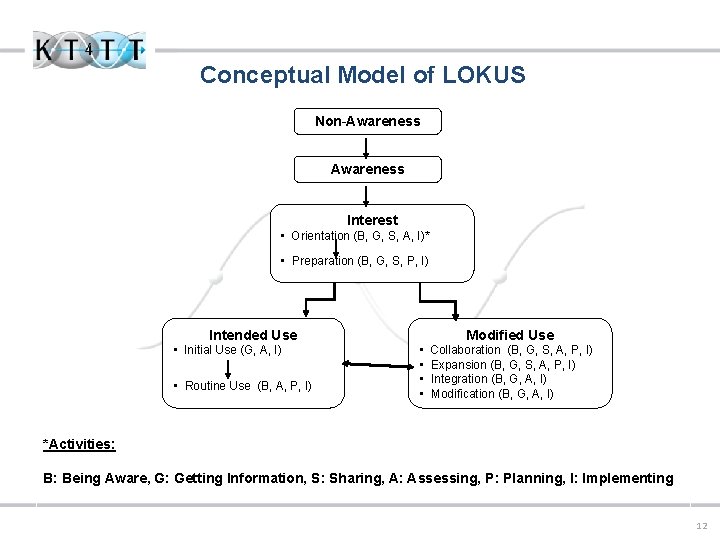
Conceptual Model of LOKUS Non-Awareness Interest • Orientation (B, G, S, A, I)* • Preparation (B, G, S, P, I) Intended Use • Initial Use (G, A, I) • Routine Use (B, A, P, I) Modified Use • Collaboration (B, G, S, A, P, I) • Expansion (B, G, S, A, P, I) • Integration (B, G, A, I) • Modification (B, G, A, I) *Activities: B: Being Aware, G: Getting Information, S: Sharing, A: Assessing, P: Planning, I: Implementing 12
Study Procedures 1. Select End-of-Grant Innovation (completed grantee research study) Inclusion Criteria • Quality- peer reviewed publication • Innovation - Novel? Feasible? Useful? • Selected K in AAC : Research by Bryen (2008) - Vocabulary for Adult users of AAC. 2. Create Intervention Strategy & tools • Identify and Interview organizations ØPrepare Knowledge Value Maps (KVM) –for User context, needs, expectations ØSource of participants • Tailored Tools: Ø Six “Contextualized Knowledge Packages” (CKPs) Six Webinars (training) Ø Technical Assistance upon request Ø 13
Study Procedures 3. Implement Intervention • Targeted Dissemination: Recruit K users via organizations. 4. Evaluate Intervention • Objective: Evaluate effectiveness of KT strategy for a given new K in AAC field; demonstrate what works for NIDRR and grantees (K producers). • Compare Tailored Targeted Dissemination of K (TTDK) with Targeted Dissemination of K (TDK) and Control (traditional diffusion) • Measure effects: Awareness, Interest and Use of New Knowledge. 14
Sample Size • Determined by power analysis • Based on study by Miller and Spilker (2003) • Needed N=206: for power =. 80, α 1=. 05, and effect size =. 24. • Planned N=270 considering attrition; Ø[3 study gps. x 6 stakeholder types x 15] • Actual N after attrition = 207 Ø( T 1 = 72; T 2 = 72; & Control = 63); Including 5 stakeholder types. 15
Recruitment • Individuals presumed to have interest in AAC related research findings. • Through national organizations of affiliation of Knowledge Users: ATIA - American Technology and Industry Association; ASHA -American Speech and Hearing Association; ISAAC - International Society for Augmentative and Alternative Communication; NCIL – national council on Independent Living; AHEAD – Association on Higher Education and Disability. • List of authors published in AAC research journals – (public domain) 16
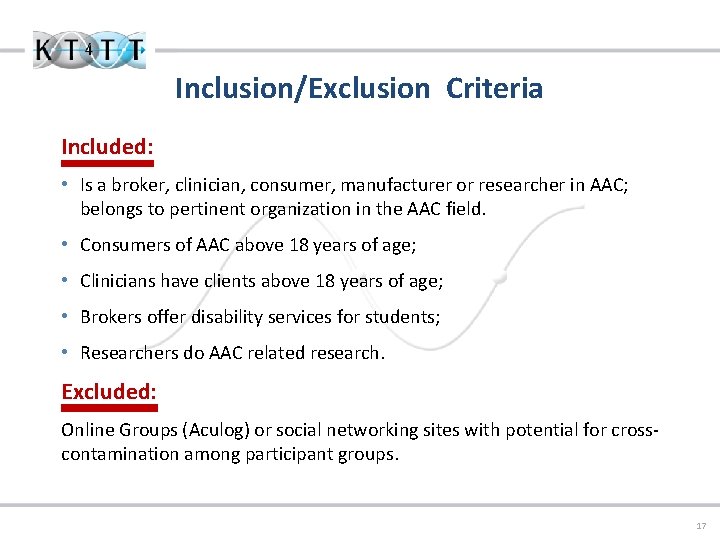
Inclusion/Exclusion Criteria Included: • Is a broker, clinician, consumer, manufacturer or researcher in AAC; belongs to pertinent organization in the AAC field. • Consumers of AAC above 18 years of age; • Clinicians have clients above 18 years of age; • Brokers offer disability services for students; • Researchers do AAC related research. Excluded: Online Groups (Aculog) or social networking sites with potential for crosscontamination among participant groups. 17
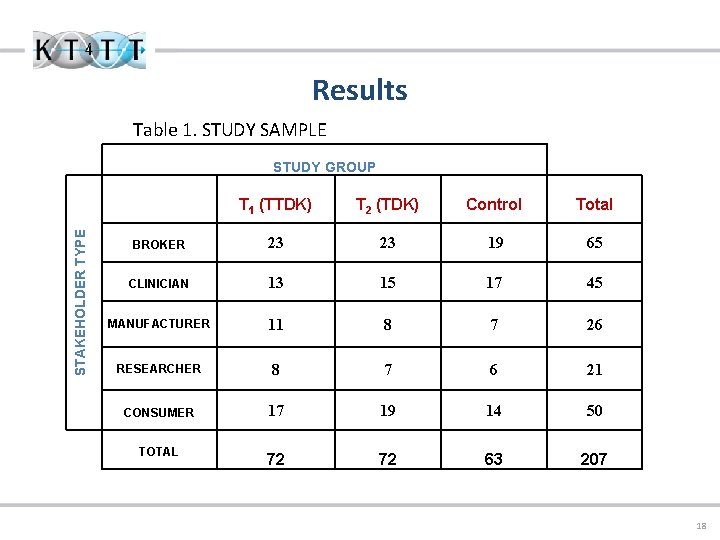
Results Table 1. STUDY SAMPLE STAKEHOLDER TYPE STUDY GROUP T 1 (TTDK) T 2 (TDK) Control Total BROKER 23 23 19 65 CLINICIAN 13 15 17 45 MANUFACTURER 11 8 7 26 RESEARCHER 8 7 6 21 CONSUMER 17 19 14 50 TOTAL 72 72 63 207 18
RESULTS: Demographic characteristics of participants • No difference among participants allocated to the TTDK, TDK and Control groups regarding age, years of experience, gender, race/ethnicity, education and work status. • 3 groups were equivalent (See next: Tables 2 a, 2 b, 2 c) 19
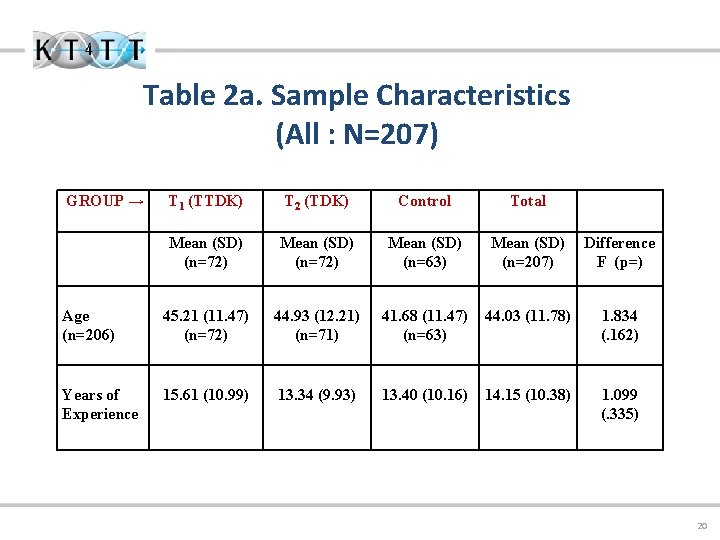
Table 2 a. Sample Characteristics (All : N=207) GROUP → T 1 (TTDK) T 2 (TDK) Control Total Mean (SD) (n=72) Mean (SD) (n=63) Mean (SD) (n=207) Difference F (p=) Age (n=206) 45. 21 (11. 47) (n=72) 44. 93 (12. 21) (n=71) 41. 68 (11. 47) (n=63) 44. 03 (11. 78) 1. 834 (. 162) Years of Experience 15. 61 (10. 99) 13. 34 (9. 93) 13. 40 (10. 16) 14. 15 (10. 38) 1. 099 (. 335) 20
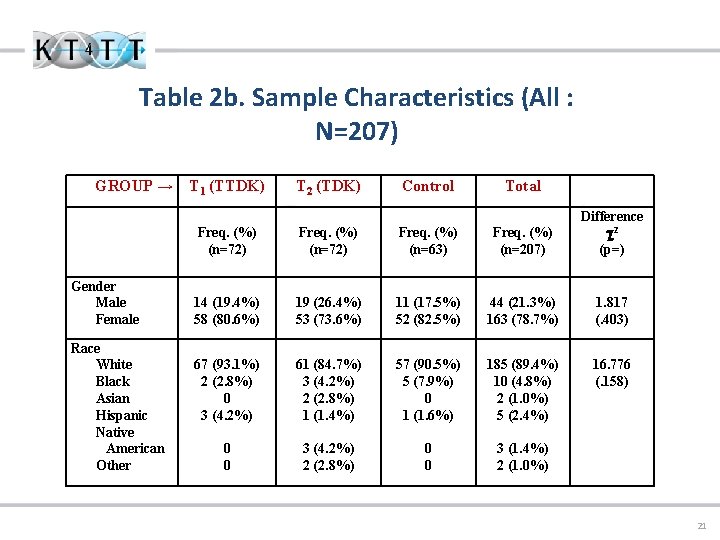
Table 2 b. Sample Characteristics (All : N=207) GROUP → Gender Male Female Race White Black Asian Hispanic Native American Other T 1 (TTDK) T 2 (TDK) Control Total Freq. (%) (n=72) Freq. (%) (n=63) Freq. (%) (n=207) Difference 2 (p=) 14 (19. 4%) 58 (80. 6%) 19 (26. 4%) 53 (73. 6%) 11 (17. 5%) 52 (82. 5%) 44 (21. 3%) 163 (78. 7%) 1. 817 (. 403) 67 (93. 1%) 2 (2. 8%) 0 3 (4. 2%) 61 (84. 7%) 3 (4. 2%) 2 (2. 8%) 1 (1. 4%) 57 (90. 5%) 5 (7. 9%) 0 1 (1. 6%) 185 (89. 4%) 10 (4. 8%) 2 (1. 0%) 5 (2. 4%) 16. 776 (. 158) 0 0 3 (4. 2%) 2 (2. 8%) 0 0 3 (1. 4%) 2 (1. 0%) 21
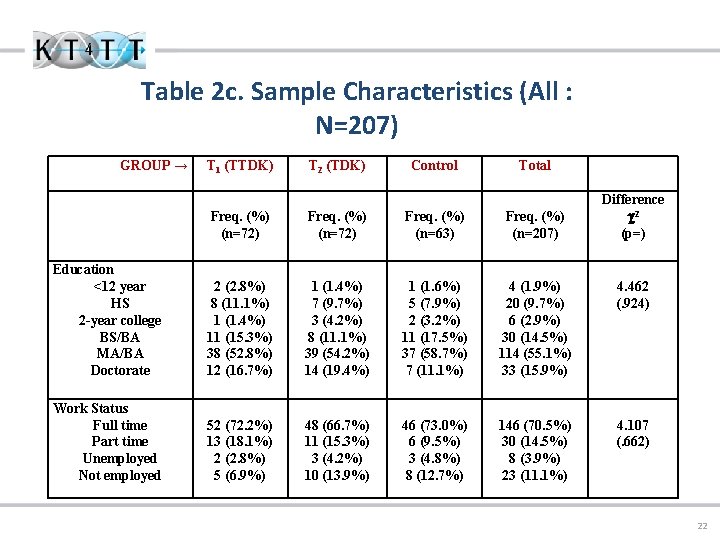
Table 2 c. Sample Characteristics (All : N=207) GROUP → T 1 (TTDK) T 2 (TDK) Control Total Difference 2 (p=) Freq. (%) (n=72) Freq. (%) (n=63) Freq. (%) (n=207) Education <12 year HS 2 -year college BS/BA MA/BA Doctorate 2 (2. 8%) 8 (11. 1%) 1 (1. 4%) 11 (15. 3%) 38 (52. 8%) 12 (16. 7%) 1 (1. 4%) 7 (9. 7%) 3 (4. 2%) 8 (11. 1%) 39 (54. 2%) 14 (19. 4%) 1 (1. 6%) 5 (7. 9%) 2 (3. 2%) 11 (17. 5%) 37 (58. 7%) 7 (11. 1%) 4 (1. 9%) 20 (9. 7%) 6 (2. 9%) 30 (14. 5%) 114 (55. 1%) 33 (15. 9%) 4. 462 (. 924) Work Status Full time Part time Unemployed Not employed 52 (72. 2%) 13 (18. 1%) 2 (2. 8%) 5 (6. 9%) 48 (66. 7%) 11 (15. 3%) 3 (4. 2%) 10 (13. 9%) 46 (73. 0%) 6 (9. 5%) 3 (4. 8%) 8 (12. 7%) 146 (70. 5%) 30 (14. 5%) 8 (3. 9%) 23 (11. 1%) 4. 107 (. 662) 22
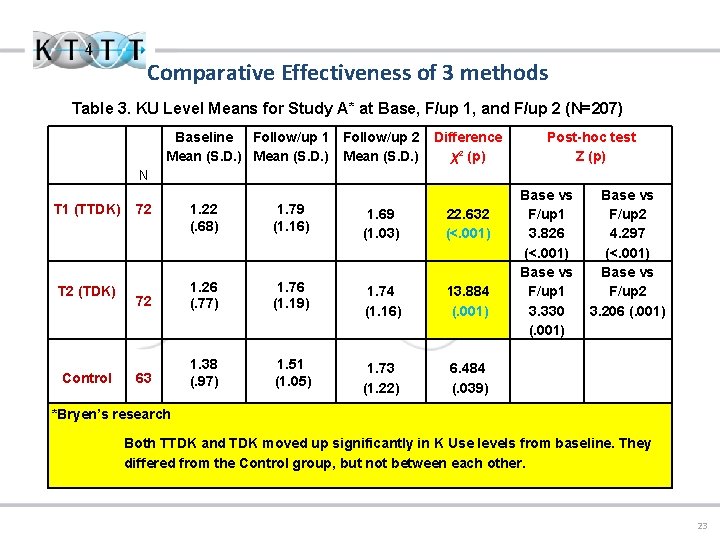
Comparative Effectiveness of 3 methods Table 3. KU Level Means for Study A* at Base, F/up 1, and F/up 2 (N=207) Baseline Follow/up 1 Follow/up 2 Mean (S. D. ) Difference χ² (p) Post-hoc test Z (p) N T 1 (TTDK) T 2 (TDK) Control 72 1. 22 (. 68) 1. 79 (1. 16) 1. 69 (1. 03) 22. 632 (<. 001) 72 1. 26 (. 77) 1. 76 (1. 19) 1. 74 (1. 16) 13. 884 (. 001) 63 1. 38 (. 97) 1. 51 (1. 05) 1. 73 (1. 22) 6. 484 (. 039) Base vs F/up 1 3. 826 (<. 001) Base vs F/up 1 3. 330 (. 001) Base vs F/up 2 4. 297 (<. 001) Base vs F/up 2 3. 206 (. 001) *Bryen’s research Both TTDK and TDK moved up significantly in K Use levels from baseline. They differed from the Control group, but not between each other. 23
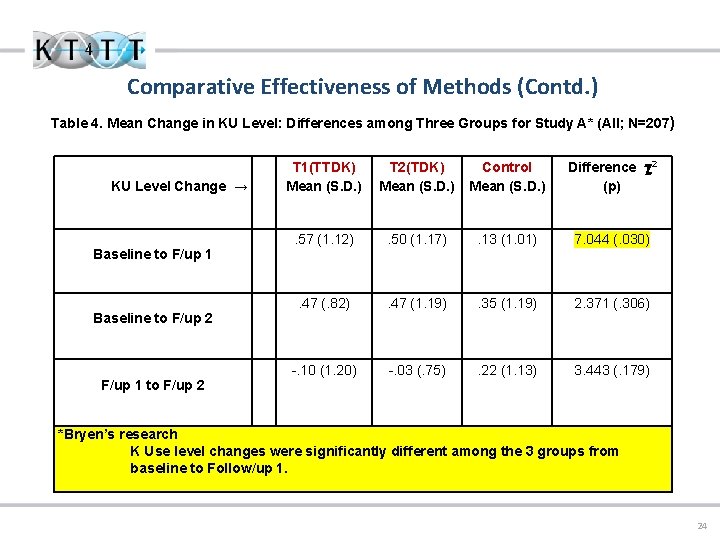
Comparative Effectiveness of Methods (Contd. ) Table 4. Mean Change in KU Level: Differences among Three Groups for Study A* (All; N=207) KU Level Change → Baseline to F/up 1 Baseline to F/up 2 F/up 1 to F/up 2 T 1(TTDK) Mean (S. D. ) T 2(TDK) Mean (S. D. ) Control Mean (S. D. ) Difference 2 (p) . 57 (1. 12) . 50 (1. 17) . 13 (1. 01) 7. 044 (. 030) . 47 (. 82) . 47 (1. 19) . 35 (1. 19) 2. 371 (. 306) -. 10 (1. 20) -. 03 (. 75) . 22 (1. 13) 3. 443 (. 179) *Bryen’s research K Use level changes were significantly different among the 3 groups from baseline to Follow/up 1. 24
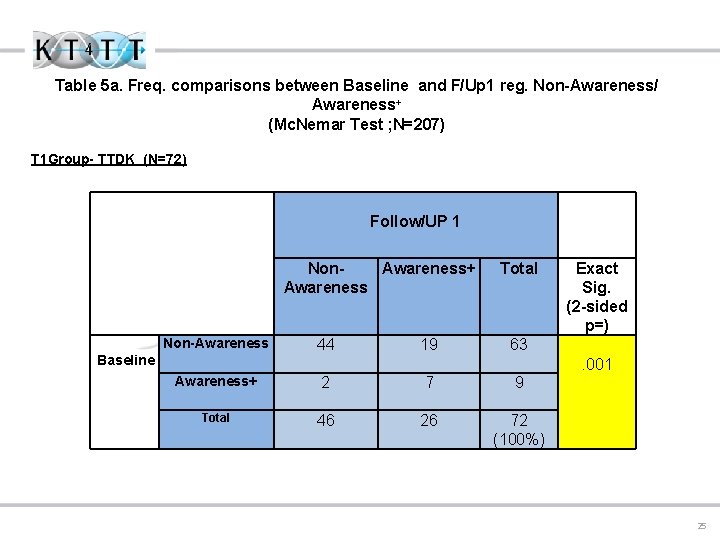
Table 5 a. Freq. comparisons between Baseline and F/Up 1 reg. Non-Awareness/ Awareness+ (Mc. Nemar Test ; N=207) T 1 Group- TTDK (N=72) Follow/UP 1 Non. Awareness+ Awareness Non-Awareness Baseline 44 19 Total Exact Sig. (2 -sided p=) 63. 001 Awareness+ 2 7 9 Total 46 26 72 (100%) 25
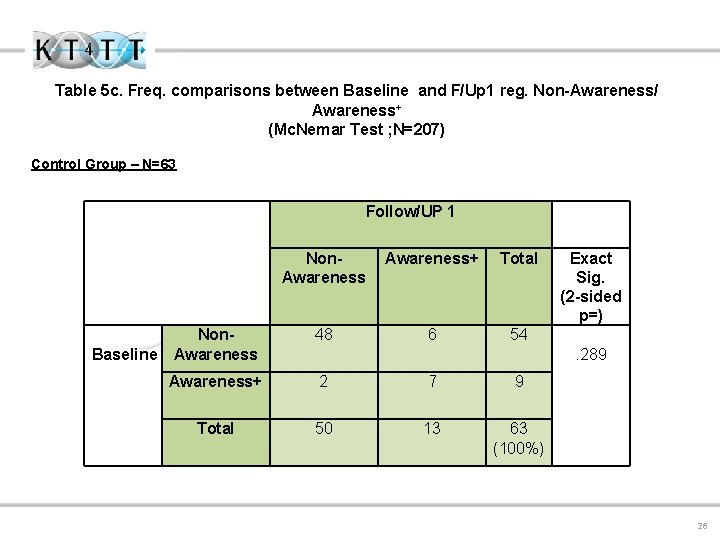
Table 5 c. Freq. comparisons between Baseline and F/Up 1 reg. Non-Awareness/ Awareness+ (Mc. Nemar Test ; N=207) Control Group – N=63 Follow/UP 1 Baseline Non. Awareness+ Total Non. Awareness 48 6 54 Awareness+ 2 7 9 Total 50 13 63 (100%) Exact Sig. (2 -sided p=). 289 26
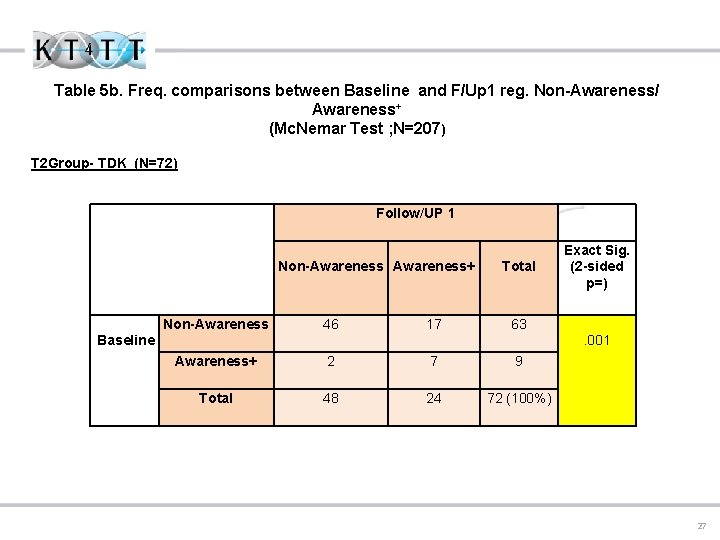
Table 5 b. Freq. comparisons between Baseline and F/Up 1 reg. Non-Awareness/ Awareness+ (Mc. Nemar Test ; N=207) T 2 Group- TDK (N=72) Follow/UP 1 Non-Awareness+ Non-Awareness 46 17 Total Exact Sig. (2 -sided p=) 63 Baseline . 001 Awareness+ 2 7 9 Total 48 24 72 (100%) 27
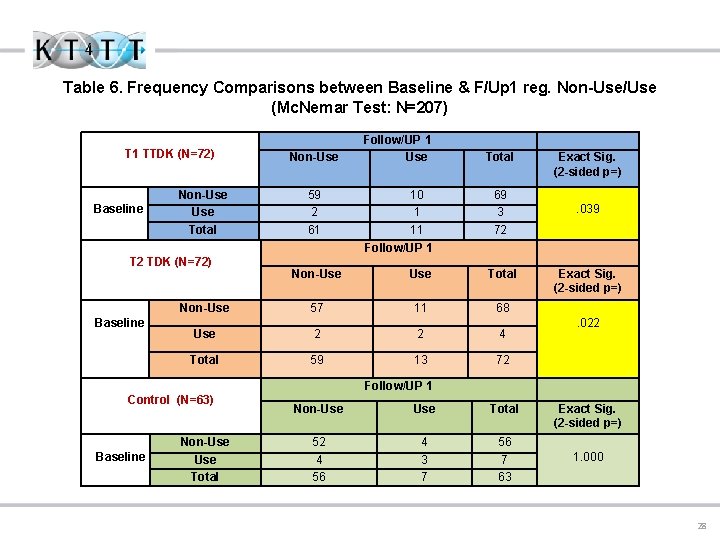
Table 6. Frequency Comparisons between Baseline & F/Up 1 reg. Non-Use/Use (Mc. Nemar Test: N=207) T 1 TTDK (N=72) Baseline Non-Use Total T 2 TDK (N=72) Baseline Non-Use 59 2 61 Follow/UP 1 Use 10 1 11 Follow/UP 1 Total 69 3 72 Non-Use Total Non-Use 57 11 68 Use 2 2 4 Total 59 13 72 Exact Sig. (2 -sided p=). 039 Exact Sig. (2 -sided p=). 022 Follow/UP 1 Control (N=63) Baseline Non-Use Total Non-Use 52 4 56 Use Total 4 56 3 7 7 63 Exact Sig. (2 -sided p=) 1. 000 28
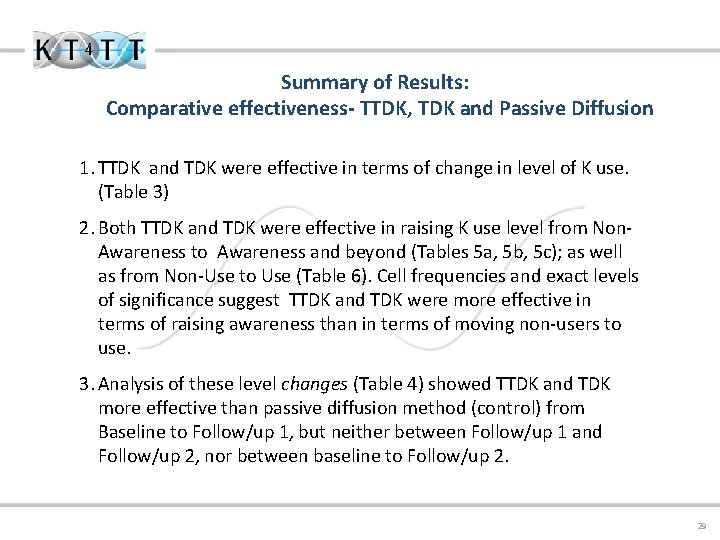
Summary of Results: Comparative effectiveness- TTDK, TDK and Passive Diffusion 1. TTDK and TDK were effective in terms of change in level of K use. (Table 3) 2. Both TTDK and TDK were effective in raising K use level from Non. Awareness to Awareness and beyond (Tables 5 a, 5 b, 5 c); as well as from Non-Use to Use (Table 6). Cell frequencies and exact levels of significance suggest TTDK and TDK were more effective in terms of raising awareness than in terms of moving non-users to use. 3. Analysis of these level changes (Table 4) showed TTDK and TDK more effective than passive diffusion method (control) from Baseline to Follow/up 1, but neither between Follow/up 1 and Follow/up 2, nor between baseline to Follow/up 2. 29
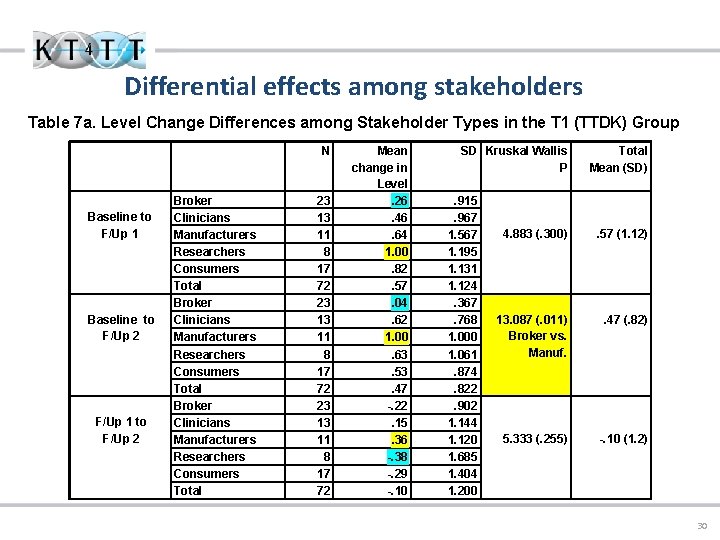
Differential effects among stakeholders Table 7 a. Level Change Differences among Stakeholder Types in the T 1 (TTDK) Group N Baseline to F/Up 1 Baseline to F/Up 2 F/Up 1 to F/Up 2 Broker Clinicians Manufacturers Researchers Consumers Total 23 13 11 8 17 72 Mean change in Level. 26. 46. 64 1. 00. 82. 57. 04. 62 1. 00. 63. 53. 47 -. 22. 15. 36 -. 38 -. 29 -. 10 SD Kruskal Wallis P. 915. 967 1. 567 1. 195 1. 131 1. 124. 367. 768 1. 000 1. 061. 874. 822. 902 1. 144 1. 120 1. 685 1. 404 1. 200 Total Mean (SD) 4. 883 (. 300) . 57 (1. 12) 13. 087 (. 011) Broker vs. Manuf. . 47 (. 82) 5. 333 (. 255) -. 10 (1. 2) 30
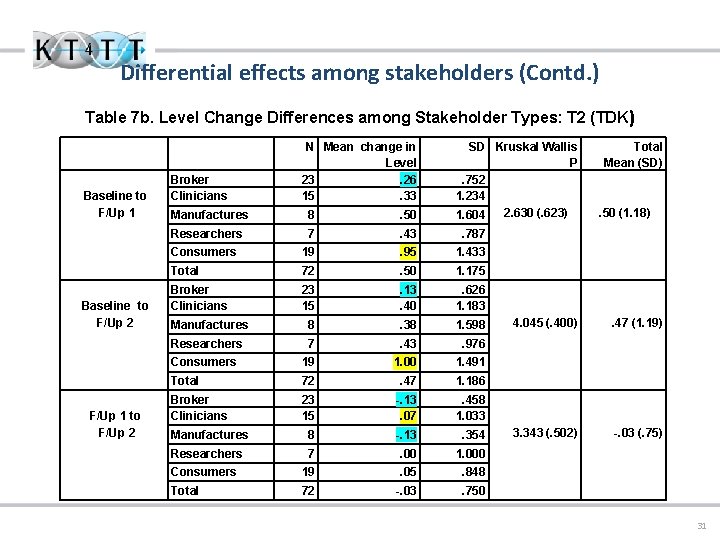
Differential effects among stakeholders (Contd. ) Table 7 b. Level Change Differences among Stakeholder Types: T 2 (TDK ) Baseline to F/Up 1 Baseline to F/Up 2 F/Up 1 to F/Up 2 Broker Clinicians N Mean change in Level 23. 26 15. 33 SD Kruskal Wallis P. 752 1. 234 2. 630 (. 623) 1. 604 Manufactures 8 . 50 Researchers 7 . 43 . 787 Consumers 19 . 95 1. 433 Total 72 . 50 1. 175 Broker Clinicians 23 15 . 13. 40 . 626 1. 183 Manufactures 8 . 38 1. 598 Researchers 7 . 43 . 976 Consumers 19 1. 00 1. 491 Total 72 . 47 1. 186 Broker Clinicians 23 15 -. 13. 07 . 458 1. 033 Manufactures 8 -. 13 . 354 Researchers 7 . 00 1. 000 Consumers 19 . 05 . 848 Total 72 -. 03 . 750 Total Mean (SD) . 50 (1. 18) 4. 045 (. 400) . 47 (1. 19) 3. 343 (. 502) -. 03 (. 75) 31
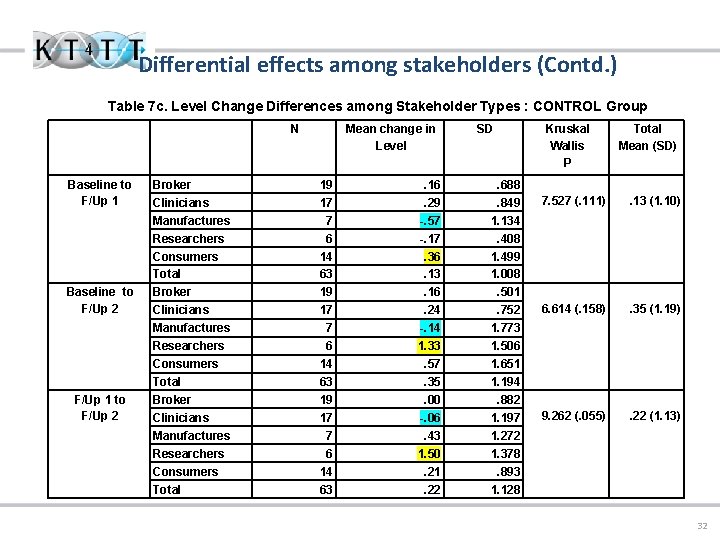
Differential effects among stakeholders (Contd. ) Table 7 c. Level Change Differences among Stakeholder Types : CONTROL Group N Baseline to F/Up 1 Baseline to F/Up 2 F/Up 1 to F/Up 2 Broker Clinicians Manufactures Researchers Consumers Total Mean change in Level 19 17 7 6 14 63 . 16. 29 -. 57 -. 17. 36. 13. 16. 24 -. 14 1. 33. 57. 35. 00 -. 06. 43 1. 50. 21. 22 SD . 688. 849 1. 134. 408 1. 499 1. 008. 501. 752 1. 773 1. 506 1. 651 1. 194. 882 1. 197 1. 272 1. 378. 893 1. 128 Kruskal Wallis P Total Mean (SD) 7. 527 (. 111) . 13 (1. 10) 6. 614 (. 158) . 35 (1. 19) 9. 262 (. 055) . 22 (1. 13) 32
Summary of Results: Differential effects on Stakeholder Groups From baseline to Follow/up 1 and from Follow/up 1 to Follow/up 2, there were no differences among stakeholders (Tables 7 a, 7 b and 7 c). However, a significant difference was identified between brokers and manufacturers between Baseline and Follow/up 2 for the TTDK group only. Manufacturers moved up the most and brokers the least (Table 7 a). 33
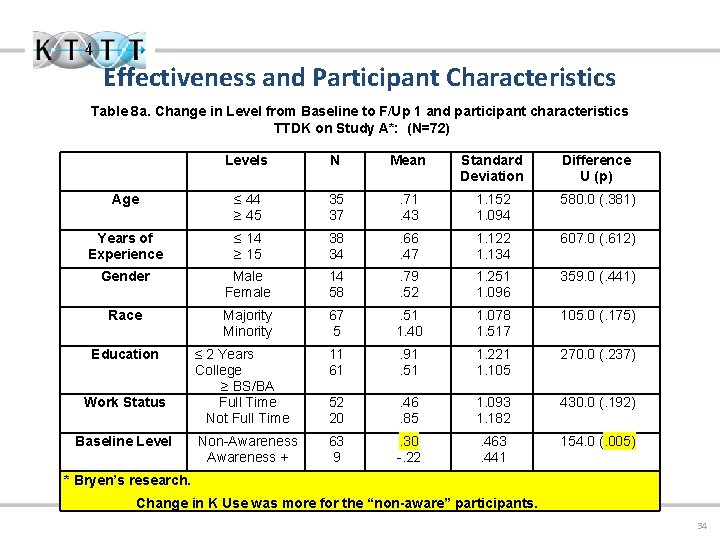
Effectiveness and Participant Characteristics Table 8 a. Change in Level from Baseline to F/Up 1 and participant characteristics TTDK on Study A*: (N=72) Levels N Mean Standard Deviation Difference U (p) Age ≤ 44 ≥ 45 35 37 . 71. 43 1. 152 1. 094 580. 0 (. 381) Years of Experience ≤ 14 ≥ 15 38 34 . 66. 47 1. 122 1. 134 607. 0 (. 612) Gender Male Female 14 58 . 79. 52 1. 251 1. 096 359. 0 (. 441) Race Majority Minority 67 5 . 51 1. 40 1. 078 1. 517 105. 0 (. 175) ≤ 2 Years College ≥ BS/BA Full Time Not Full Time 11 61 . 91. 51 1. 221 1. 105 270. 0 (. 237) 52 20 . 46. 85 1. 093 1. 182 430. 0 (. 192) Non-Awareness + 63 9 . 30 -. 22 . 463. 441 154. 0 (. 005) Education Work Status Baseline Level * Bryen’s research. Change in K Use was more for the “non-aware” participants. 34
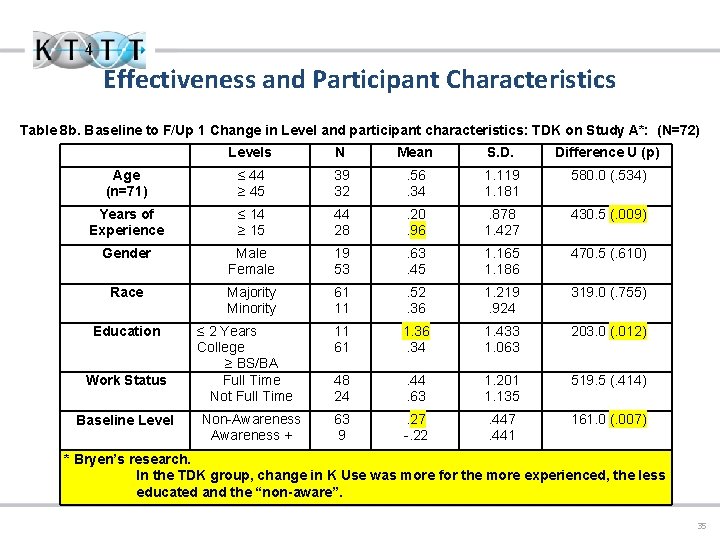
Effectiveness and Participant Characteristics Table 8 b. Baseline to F/Up 1 Change in Level and participant characteristics: TDK on Study A*: (N=72) Levels N Mean S. D. Difference U (p) Age (n=71) ≤ 44 ≥ 45 39 32 . 56. 34 1. 119 1. 181 580. 0 (. 534) Years of Experience ≤ 14 ≥ 15 44 28 . 20. 96 . 878 1. 427 430. 5 (. 009) Gender Male Female 19 53 . 63. 45 1. 165 1. 186 470. 5 (. 610) Race Majority Minority 61 11 . 52. 36 1. 219. 924 319. 0 (. 755) 11 61 1. 36. 34 1. 433 1. 063 203. 0 (. 012) 48 24 . 44. 63 1. 201 1. 135 519. 5 (. 414) 63 9 . 27 -. 22 . 447. 441 161. 0 (. 007) Education Work Status Baseline Level ≤ 2 Years College ≥ BS/BA Full Time Not Full Time Non-Awareness + * Bryen’s research. In the TDK group, change in K Use was more for the more experienced, the less educated and the “non-aware”. 35
Summary of Results: Increase in K Use and Participant Characteristics • Participants in the TTDK group who were at the Non. Awareness level regarding Bryen’s findings at baseline moved up significantly more than participants who were at Awareness and above (Table 8 a). • In the TDK group, participants who were at the Non. Awareness level for Bryen’s findings at baseline moved up significantly to Follow/up 1 more than others. Additionally, those who had lower education levels (<2 year-college), and those with more years of experience (15 yrs or more) moved up significantly more than the others in these characteristics (Table 8 b). 36
Conclusions are tentative; replication RCTs are underway. 1. Targeting stakeholders for dissemination (common component of TTDK and TDK) is an effective way to raise K use; although Tailoring did not add to KT effectiveness. 2. Within TTDK, the tailored CKP was effective (intervention between baseline and Follow/up 1); however, the tailored webcast was not(intervention between Follow/ups 1 and 2). 3. Both TTDK and TDK were more effective in moving stakeholders beyond nonawareness than in moving non-users to use. (Approx. 30% Vs. 15%) 4. No differential effects on stakeholders except brokers vs. manufacturers for TTDK. Suggests that tailoring the K (in AAC) might hold most value for manufacturers in this field, and least for brokers (K use facilitators in academic environment) 5. Both TTDK and TDK strategies were more effective with those who are at the Nonawareness level. Corroborates earlier conclusion #3. 6. The TDK (disseminating the original article about K with no CKP) was more effective in raising awareness of those with lower educational level and those who were more experienced working with AAC. 37
Discussion • Effects of CKP vs. webcast/Tech assistance: Did the order of intervention play a role? Did the duration of intervention play a role? • Nevertheless, the main results are not surprising. In End-of-Grant/Integrated KT, investigator generates K assuming audience have needs for the K; solution is to match the problem (find audience) to fit the capabilities of K. The opposite is argued in the Prior-to-grant KT approach proposed in the Nt. K model (Lane & Flagg, 2010). Ø Need should be validated prior to initiating any technology based R&D project (Based on Project’s TT experience) Ø Future RCTs to test this may shed further light. 38
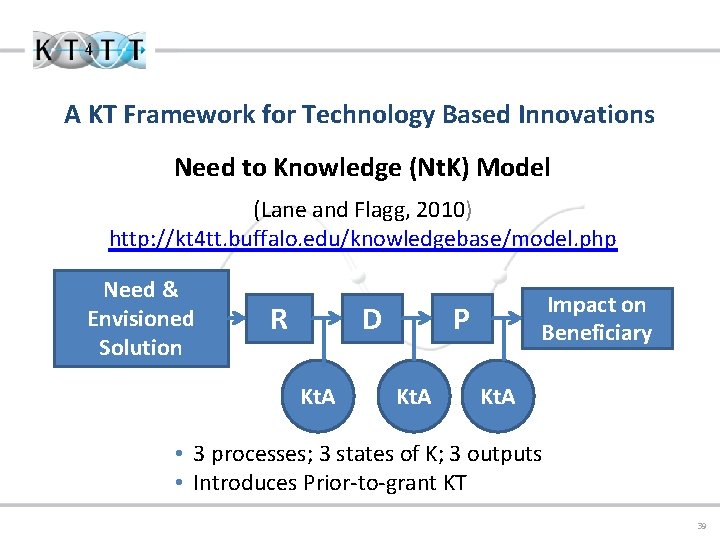
A KT Framework for Technology Based Innovations Need to Knowledge (Nt. K) Model (Lane and Flagg, 2010) http: //kt 4 tt. buffalo. edu/knowledgebase/model. php Need & Envisioned Solution R D Kt. A Impact on Beneficiary P Kt. A • 3 processes; 3 states of K; 3 outputs • Introduces Prior-to-grant KT 39
Evaluation Quality Intervention Evaluation considered: A. Professional Standards • Utility: to technology R&D grantees – an effective KT strategy and any specific feedback from K users. • Feasibility – of KT tools (CKPs, webinars, LOKUS) from grantee perspective; we replicate process for different technology outputs. • Accuracy – RCT design (merit) + follow up (worth). • Propriety – involve K producer (grantee) in translation. B. Both rigor and relevance as important for KT: • Is the K credible? --- Merit (rigor) of evidence (Peer reviewed publication) • Is the K worthy? --- Relevance to K users (Review Committee of Stakeholders) 40
Acknowledgement This is a presentation of the KT 4 TT Center which is funded by the National Institute on Disability and Rehabilitation Research of the U. S. Department of Education, under grant number H 133 A 080050. The opinions contained in this presentation are those of the grantee and do not necessarily reflect those of the U. S. Department of Education. We also acknowledge collaboration and expert input from the RERC on Communication Enhancement during the implementation phase of the study. 41
Key References 1. Bozeman, B. , & Rogers, J. D. (2002). A churn model of scientific knowledge value: Internet researchers as a knowledge value collective, Research Policy, 31, 769 -794. 2. Bryen D. N. (2008). Vocabulary to Support Socially-Valued Adult Roles. Augmentative and alternative Communication, Vol. 24, No. 4, Pages 294 -301 3. CIHR. About knowledge translation. Retrieved October 25, 2009, from http: //www. cihr-irsc. gc. ca/e/29418. html 4. Graham, I. D. , Logan, J. , Harrison, M. B. , Straus, S. E. , Tetroe, J. , Caswell, W. , & Robinson, N. (2006). Lost in translation: time for a map? The Journal of Continuing Education in the Health Professions, 26(1), 13 -24. 5. Hall, G. E. , Dirksen, D. J. , and George, A. A. (2006). Measuring Implementation in Schools: Levels of Use. Austin, TX: Southwest Educational Development Laboratory (SEDL). 6. Lane JP (ed. ) (2003. “The science and practice of technology transfer: implications for the field of technology transfer, ” Journal of Technology Transfer: 28, 3/4, 333 -354 7. Lane, JP and Flagg JL(2010). Translating three states of knowledge--discovery, invention, and innovation, Implementation Science 2010, 5: 9. 8. Lane, JP and Rogers JD (2011). Engaging national organizations for knowledge translation: comparative case studies in knowledge value mapping, Implementation Science 2011, 6: 106. 9. Rogers, J. D. (2000). Theoretical consideration of collaboration in scientific research. In J. S. Hauger and C. Mc. Enaney (Eds. ), Strategies for competitiveness in Academic Research (Chapter 6). 10. Stone VI. (2010). Translating Knowledge from Technology based research projects: an end-of-grant intervention evaluation study – rationale and methods. AEA 2010 annual meeting, Nov. 10 -13, San Antonio, Tx. 11. Stone VI and Colleagues. Development of LOKUS. (Manuscript in preparation ) 12. Sudsawad, P (2007). Knowledge Translation: Introduction to Models, Strategies, and Measures. Austin: Southwest Educational Development Laboratory, National Center for the Dissemination of Disability Research. (p. 4; 21 -22) 13. Tomita, MR, Stone VI and Telang SR. Psychometric Properties of LOKUS. (Manuscript in preparation ) 14. Weiss, C H (1979). The Many Meanings of Research Utilization. Public Administration Review, 39(5): 426 -431. 15. Wholey J S. , Hatry H P. , and Newcomer, K E (eds. ) (2004). Handbook of Practical Program Evaluation, San Francisco: Jossey. Bass. 42
Thank you! Questions? Email : vstone@buffalo. edu http: //kt 4 tt. buffalo. edu http: //www. ncddr. org/webcasts/webcast 32. html 43
- Slides: 43